Contents
Dashboards
After the ARB package is imported to ArcSight, the following dashboards become available:
- CyberTrace Detection map
Displays all devices that sent events containing malicious URLs, IP addresses, or hashes. This map displays all feeds that were involved in the detection process.
- CyberTrace match statistics
Detection statistics: how many times a specific feed was involved in the detection process. If a feed has not been involved in the detection process, the dashboard does not display it.
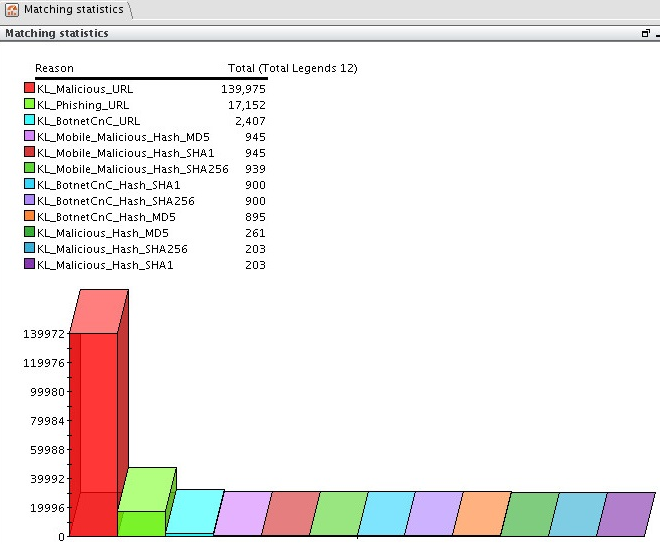
Matching statistics dashboard
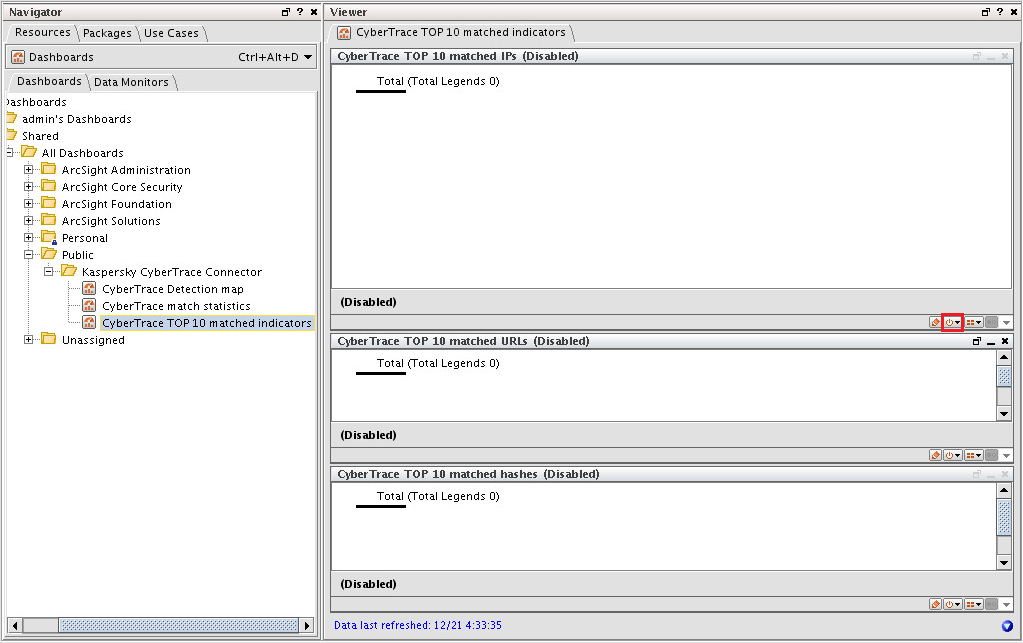
- CyberTrace TOP 10 matched indicators
Contains three charts:
- CyberTrace TOP 10 matched IPs
Top 10 detected IP addresses.
- CyberTrace TOP 10 matched URLs
Top 10 detected URLs.
- CyberTrace TOP 10 matched hashes
Top 10 detected hashes.
- CyberTrace TOP 10 matched IPs
The dashboards display data collected during the last 48 hours.
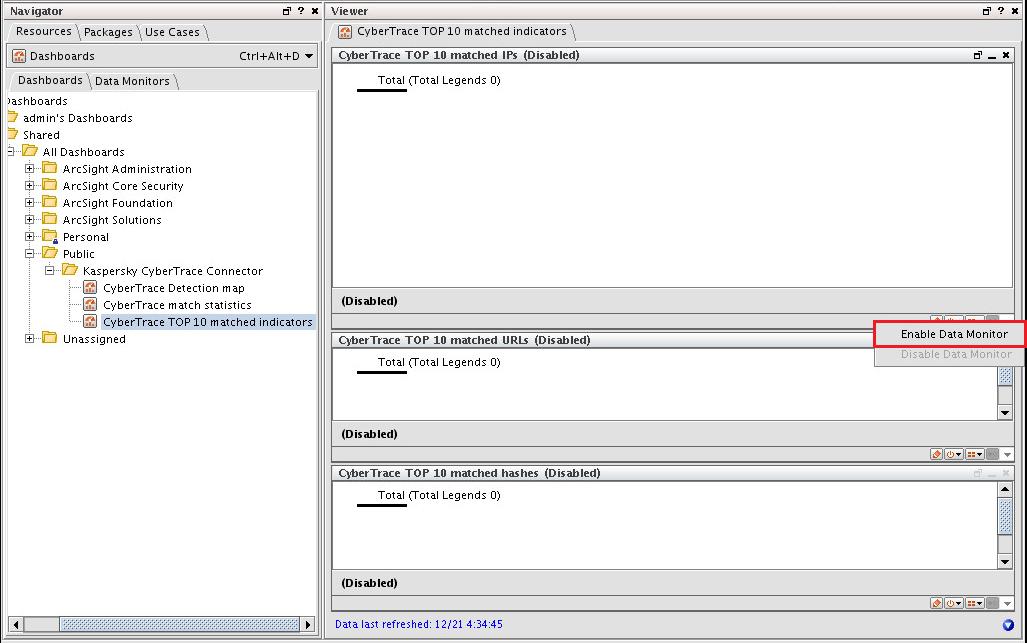
You can enable a disabled dashboard by clicking the Enable Data Monitor split button ( ) and selecting Enable Data Monitor in the drop-down list.
Enable Data Monitor button
Enabling a dashboard in versions 6.8 and 6.11
The instructions above are relevant for ArcSight ESM versions 6.8 and 6.11. To start using a dashboard in ArcSight ESM version 7.0, select Dashboards and then the Data Monitors tab. In the console tree, select Data Monitors > Shared > All Data Monitors > Public.
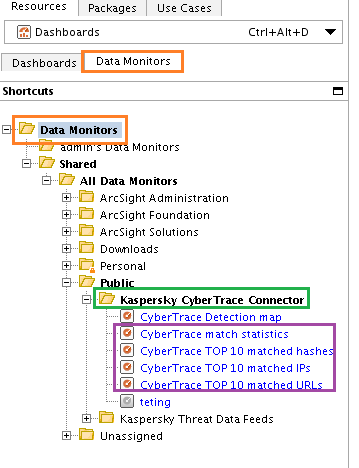
Enabling a dashboard in ArcSight ESM version 7.0
Right-click Kaspersky CyberTrace Connector and select Edit Data Monitor. On the Attributes tab, specify 300 as the Bucket size in Seconds setting and 288 as the Number of Buckets setting.
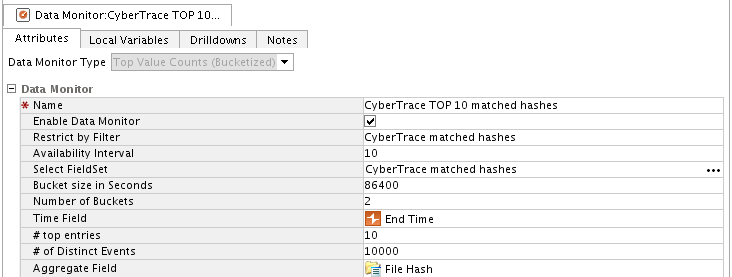
Editing Data Monitor
After performing these actions, data for the last 24 hours will be displayed in the dashboard. Follow the same steps for all monitors except CyberTrace Detection map.
Page top