Kaspersky CyberTrace dashboard
Kaspersky CyberTrace Web opens with the Dashboard tab selected. The Dashboard displays the statistics of the work of Kaspersky CyberTrace and contains several sections:
- Statistics overview
- Feed statistics
- Indicator statistics
Note that if Feed Service works in ReplyBack mode or you use Log Scanner in report mode (with the -r or --report command-line option), Kaspersky CyberTrace does not keep the statistics of the detection events and the Dashboard does not display the statistics.
Starting from Kaspersky CyberTrace version 3.1.0, you can download a detection statistics report by using the Dashboard tab. The report is an HTML file. For more information, see subsection "Downloading statistics reports".
Specifying the statistics period
You specify the time period for displaying statistics by selecting one of the Time range options on the Dashboard tab. You can select one of the following periods:
- Day (24 hours)
- Week
- Month (31 days)
- 3 months (93 days)
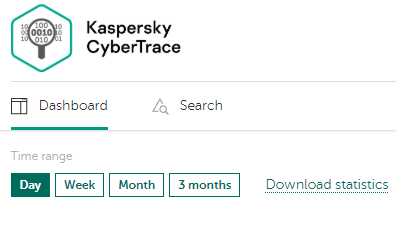
Kaspersky CyberTrace Web Dashboard. Time ranges for statistics display
Statistics overview
This section provides an overview of detection statistics and contains the following items:
- Graph showing the number of detections
A line graph displays the number of detections that occurred during the specified period. The time scale is divided into hours, days, or weeks depending on the specified period.
The graph is displayed when the Number of detections button is selected.
- Graph showing the number of detected indicators, for each indicator type (URL, IP address, and hash)
A line graph displays the number of detected indicators during the specified period. The time scale is divided into hours, days, or weeks depending on the specified period.
The graph is displayed when the Number of detected indicators button is selected.
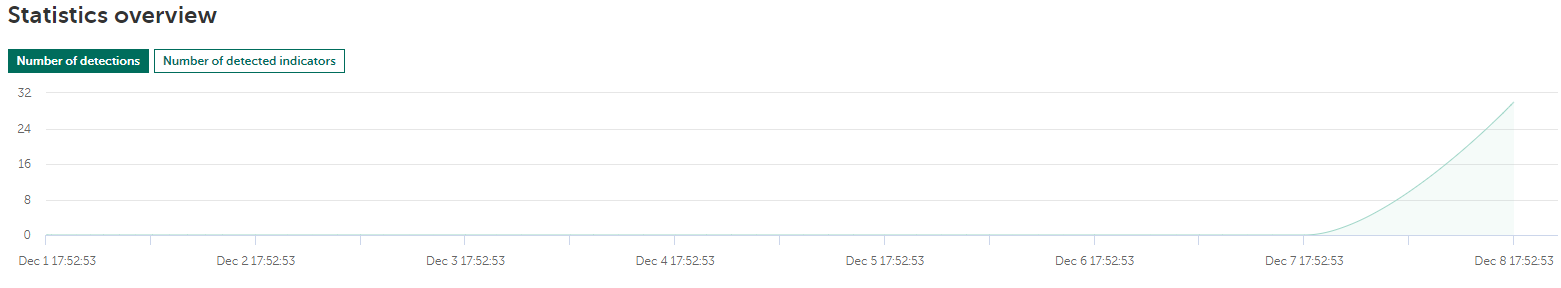
Kaspersky CyberTrace Web Dashboard. Statistics overview
Also, you can display a notification that the actual number of events per second (EPS) received by Kaspersky CyberTrace exceeds the limit imposed by the license key or licensing level.
Feed statistics
This section provides detection statistics, organized by feed, and contains the following items:
- Table with statistics of detections for each feed in use
The table contains the following columns with data:
- Feed name—Names of the feeds in use
- Indicators—Number of indicators in each feed
- A mark indicating whether the feed is not loaded or loaded partially due to license restrictions
- Whitelisted—Number of whitelisted indicators in each feed (false positives)
- Detected—Number of detected indicators for each feed
The table also gives a total for each column.
If a feed is not loaded or is loaded only partially because of license restrictions, this feed will be marked explicitly with a warning symbol (
 ).
). - Donut chart that presents the number of detections for each feed in use
This donut chart is displayed when the Detected button is selected. Let your mouse hover over a slice of the ring: the feed name, number of detections, and percentage of total detections appear.
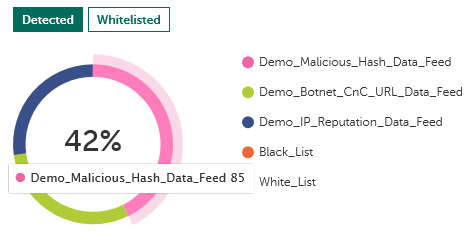
Detections donut chart
- Donut chart that presents the number of whitelisted indicators for each feed in use
This donut chart is displayed when the Whitelisted button is selected. Let your mouse hover over a slice of the ring: the feed name, number of whitelisted indicators, and percentage of total whitelisted indicators appear.
If the white list contains records, the Feed statistics table has a row with White_List.json in the Feed name column and the size of the white list in the Indicators column. Other columns in this row contain 0.
If the black list contains records, the Feed statistics table has a row with Black_List.json in the Feed name column and the size of the black list in the Indicators column. The Detected column in this row contains the number of detections against the black list, and the Whitelisted column contains 0.
If you disable or remove a previously enabled feed, this feed will still be displayed in the table. Values in the Detected and Whitelisted columns will reflect the number of true and false detections produced by this feed while it was enabled, but the value in the Indicators column will always remain - (hyphen). To check if some feed is disabled, let your mouse hover over a string with the feed name: if the feed is disabled, the pop-up window with the feed status appears.
Indicator statistics
This section provides statistics of the checked indicators and contains the following items:
- Table with the statistics of the checked indicators
The table contains the following columns with data:
- Indicator type—Different types of indicators
- Checked—Number of indicators of each type (URL, IP address, and hash) that are checked by Feed Service
- Detected—Number of indicators of each type (URL, IP address, and hash) that are detected by Feed Service
The table also gives a total for each column.
- Donut chart that presents the relative numbers of the checked indicators of each type (URL, IP address, and hash)
This donut chart is displayed when the Checked button is selected. Let your mouse hover over a slice of the ring: the indicator type, number of indicators, and percentage of total appear.
- Donut chart that presents the relative numbers of the detected indicators of each type (URL, IP address, and hash)
This donut chart is displayed when the Detected button is selected. Let your mouse hover over a slice of the ring: the indicator type, number of indicators, and percentage of total appear.
Downloading statistics reports
You can download a detection statistics report by using the Dashboard tab. The report is an HTML file.
To download a report,
Select the Download statistics link.
Note that the data displayed in the report is based on the data that is displayed on the Dashboard tab.
The generated file contains the following:
- Graph with the number of detections
This graph is displayed in the report when on the Dashboard tab the Number of detections button is selected.
- Graph with the number of detected indicators, for each indicator type
This graph is displayed in the report when on the Dashboard tab the Number of detected indicators button is selected.
- Table with feed statistics
- Table with indicator statistics
- Donut chart that shows the number of detections for each feed in use
This donut chart is displayed in the report when on the Dashboard tab the Detected button is selected.
- Donut chart that shows the number of whitelisted indicators for each feed in use
This donut chart is displayed in the report when on the Dashboard tab the Whitelisted button is selected.
- Donut chart that shows the relative numbers of the checked indicators of each type
This donut chart is displayed in the report when on the Dashboard tab the Checked button is selected.
- Donut chart that shows the relative numbers of the detected indicators of each type
This donut chart is displayed in the report when on the Dashboard tab the Detected button is selected.