Creating a dashboard
This section describes how you can create a dashboard in RSA NetWitness by using the Feed Service rules.
To create a dashboard in RSA NetWitness:
- On the RSA NetWitness menu, select Dashboard > Reports. (In RSA NetWitness 11, you select Monitor > Reports.)
- Select the rule on the basis of which you will create a report (for example, the
CyberTrace Top 10 URLsreport). - For the selected rule, click the Settings split button (
 ) and select the Create Chart action.
The Build Chart window opens.
- Specify the following data:
- Chart name
- Data source
Specify the data source that issues Feed Service events.
- Update period
- Data limit
For example, for charts containing TOP 10 objects, specify
10.
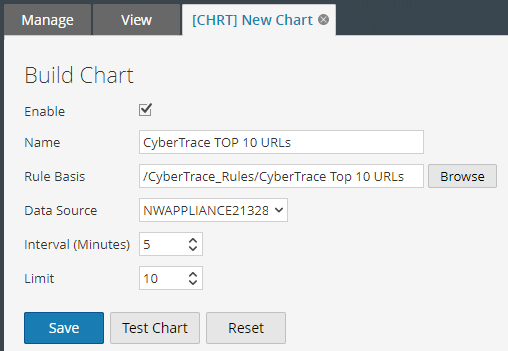
Build Chart window
- Click Save.
- Activate the Dashboard form. (In RSA NetWitness 11, you select Monitor > Overview instead.)
- The action performed in this step depends on the RSA NetWitness version.
- In RSA NetWitness 10, click the New split button (
 ) and select Add Dashlet.
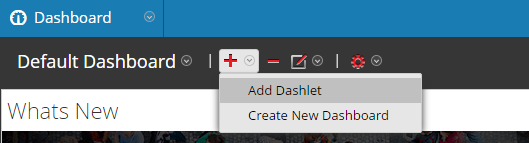
Adding a dashlet window
- In RSA NetWitness 11, do the following:
- Click the Add Row split button and select the type of new row that you want.
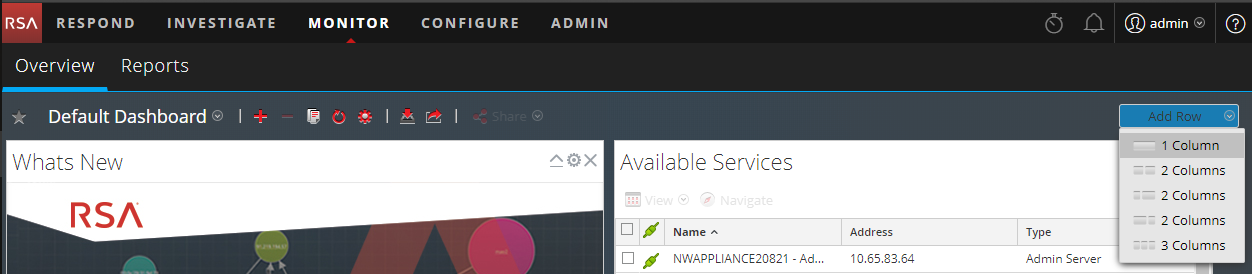
Adding a row
- In the cell that appears, click the Add Dashlet button (
 ).
).In the figure below, the cell is shown enclosed in a dotted line.
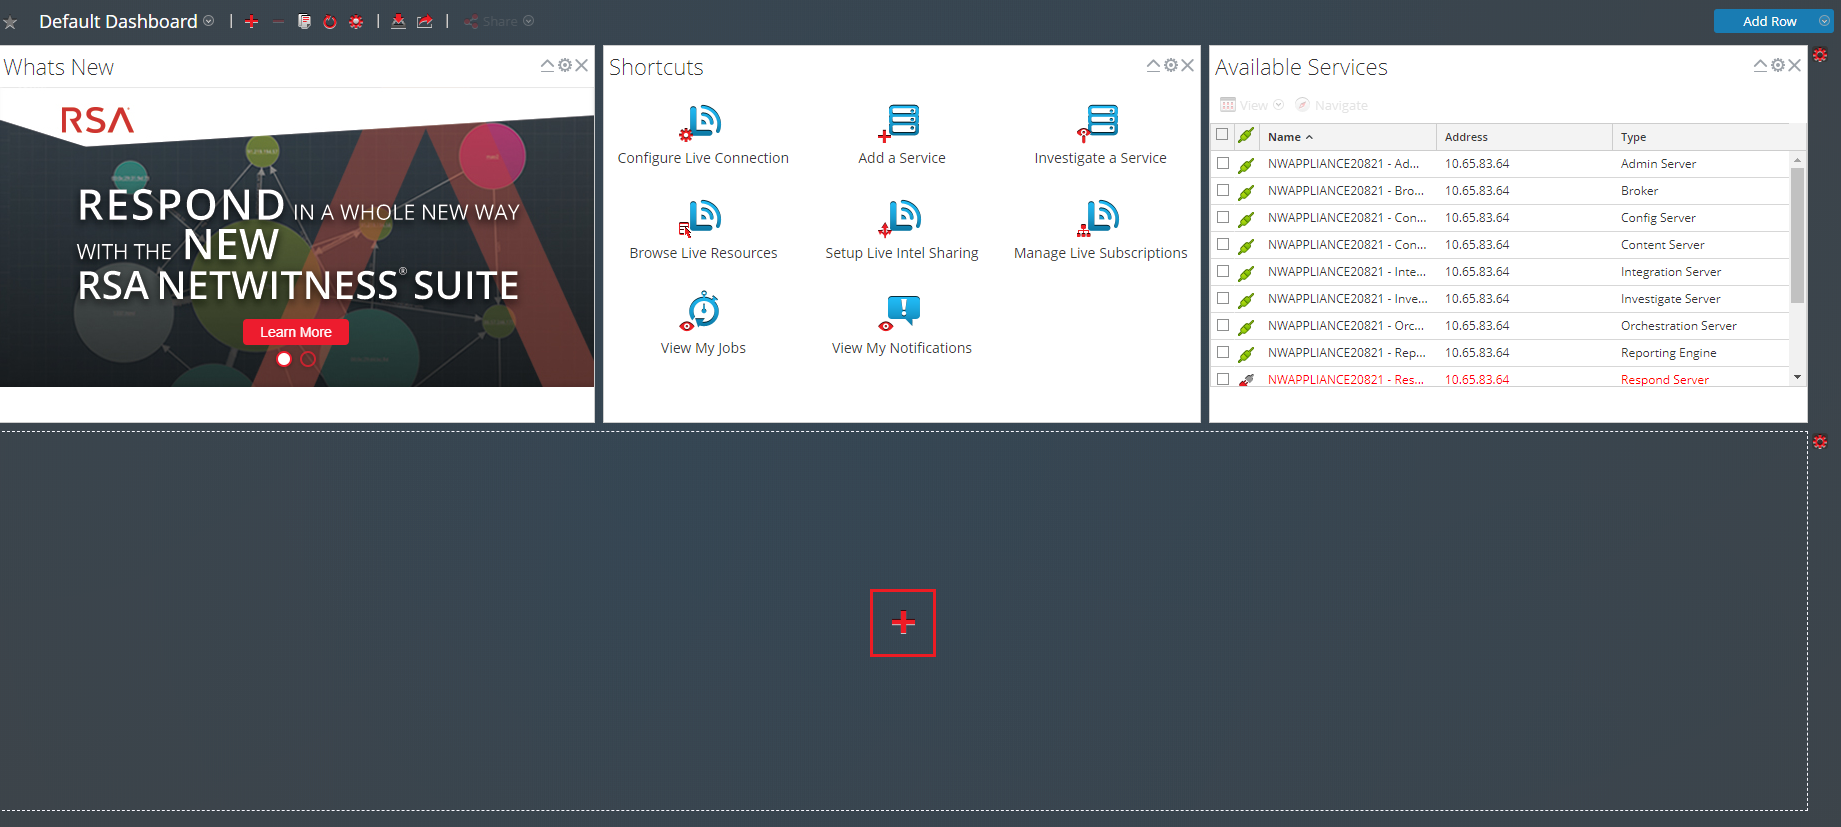
Adding a dashlet
The Add a Dashlet window opens.
- In RSA NetWitness 10, click the New split button (
- Specify the following information:
- The
Reports Realtime Chartas the dashlet type - The chart to display (in this case, it is
CyberTrace Top 10 URLs) - Dashlet name
- Chart type (in this case, it is a column)
- Period up to the present during which the data to be displayed is collected
- Dashlet update period
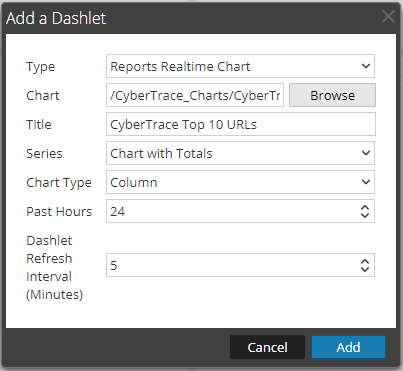
Add a Dashlet window
- The
- Click the Add button.