Monitoring the application state when connected through the web interface
You can view information about the current state of the application when connected to the Server through a web browser.
Information about disabled protection functions
In the web browser window, the lower part of the menu shows the  icon and a notification if some protection functions are disabled (see the figure below).
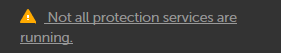
Message about disabled protection functions in the web browser window
The icon is displayed in the following cases:
- One or more monitoring points are disabled.
- One or more protection functions are disabled (for example, rule-based Intrusion Detection).
- Learning mode is enabled for one or multiple protection functions (for example, for Network Integrity Control technology).
To view information about disabled protection functions:
Click the icon or the text of the message about disabled protection functions.
Notifications about application operation problems
The upper part of the web interface menu contains a button for opening the list of notifications about problems in application operation (see the figure below).
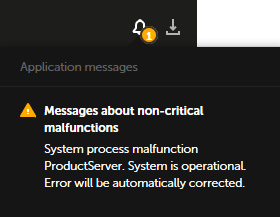
List of notifications about problems in application operation in the web browser window
If the list contains notifications about critical problems (for example, messages about disruption of application operation), a red icon is displayed. If the list contains only notifications about non-critical problems, a yellow icon is displayed.
The list contains only up-to-date notifications. If a problem has been resolved (for example, a lost connection with the Server has been restored), the corresponding notification is automatically removed from the list.
You can view detailed information about notifications (except notifications regarding unavailability of the Server or database).
To view information about a notification:
- In the menu, click the
 button.
 - In the list of notifications, click the text of the notification.
The web browser window shows a section containing information pertaining to the notification (for example, the Application messages tab in the Settings section).
Information about the current state of the application
You can view information about the current state of the application in the Tags section. The Application state field displays the status as the presence or absence of problems in application operation.
If the application is running normally, the Application state field displays the No problems detected status.
If the An error occurred or Unknown status is displayed, industrial network protection functions may be only partially operational. You need to take steps to restore normal operation of the application.
Page top