Monitoring and reporting capabilities for MSPs
Kaspersky Security Center Cloud Console provides you with monitoring and reporting capabilities. These capabilities give you an overview of your organization infrastructure, protection statuses, and statistics.
When you have deployed Kaspersky Security Center Cloud Console, you can configure the monitoring and reporting features to best suit your needs.
Kaspersky Security Center Cloud Console provides the following types features of monitoring and reporting:
- Dashboard
- Reports
- Event selections
- Email notifications
Dashboard
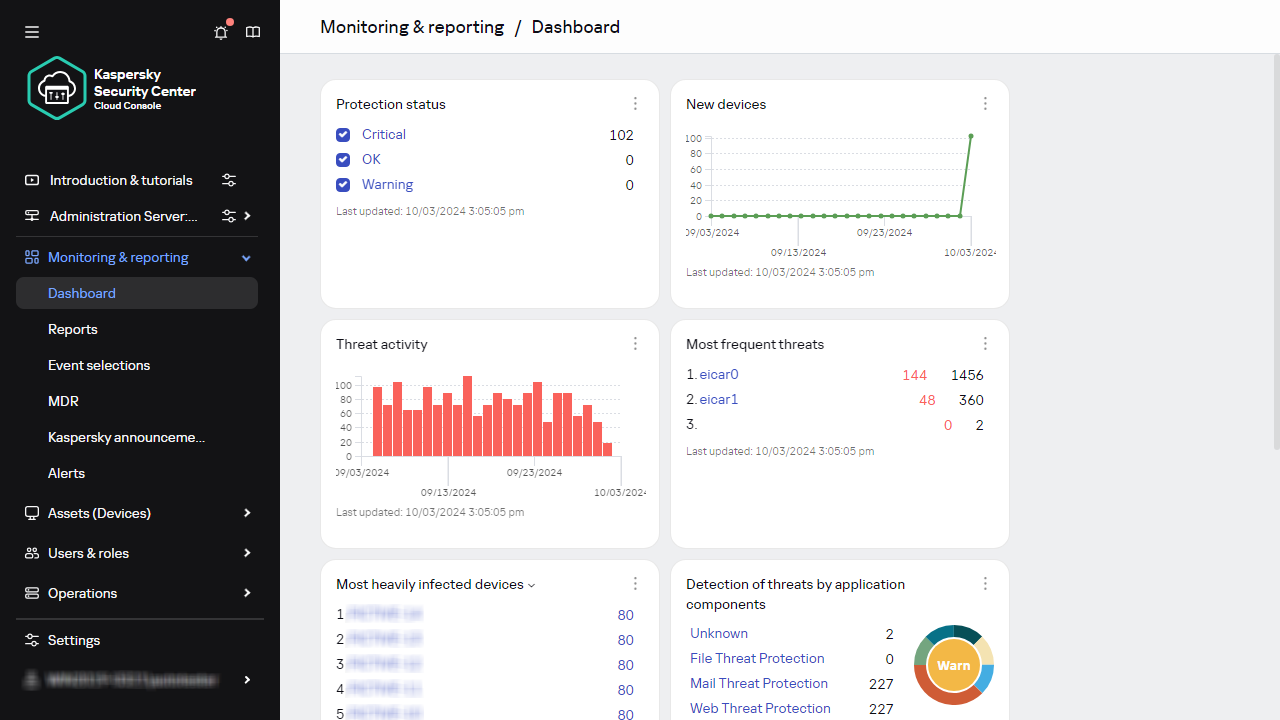
The dashboard allows you to monitor security trends on your organization's network by providing you with a graphical display of information. (See the figure below.)

The Dashboard section
Reports
The Reports feature allows you to get detailed numerical information about the security of your organization's network, save this information to a file, send it by email, and print it. You can also schedule report delivery by email (see the figure below).

The Reports section
Event selections
Event selections provide an onscreen view of named sets of events that are selected from the Administration Server database. Kaspersky Security Center Cloud Console contains a number of predefined event selections (for example, Recent events and Critical events). Also, you can create custom event selections.
Email notifications
You can configure email notification about events occurring in Kaspersky Security Center Cloud Console and on your customers' devices.
Page top