Configuration on the Windows side
To configure the reception of DNS server events using the ETW connector on the Windows side:
- Start the Event viewer by running the following command:
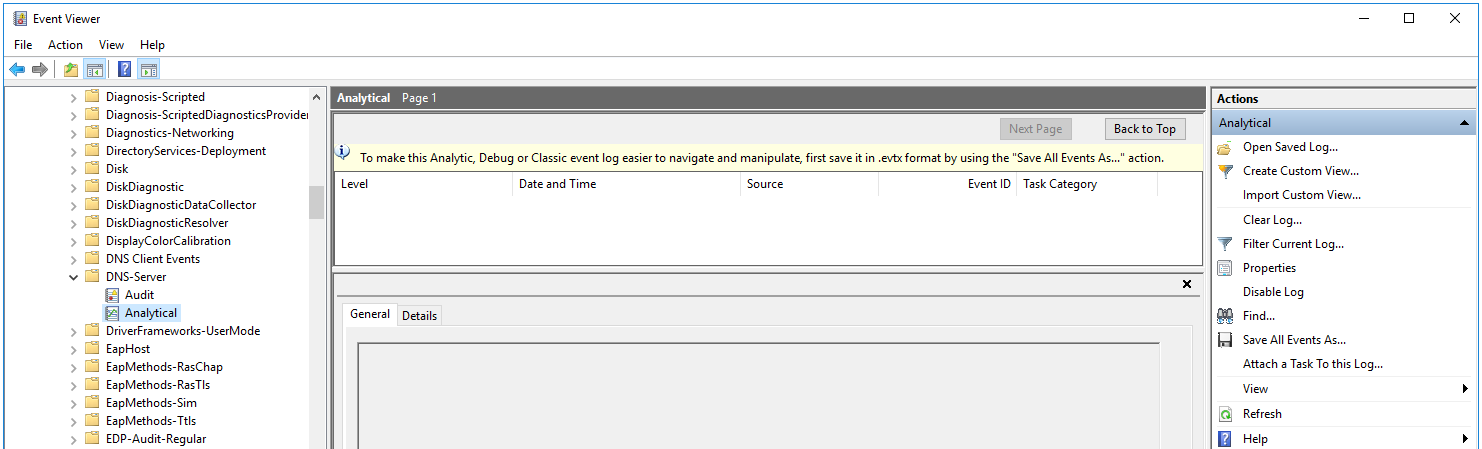
eventvwr.msc - This opens a window; in that window, go to the Applications and Services Logs → Microsoft → Windows → DNS-Server folder.
- Open the context menu of the DNS-Server folder and select View → Show Analytic and Debug Logs.
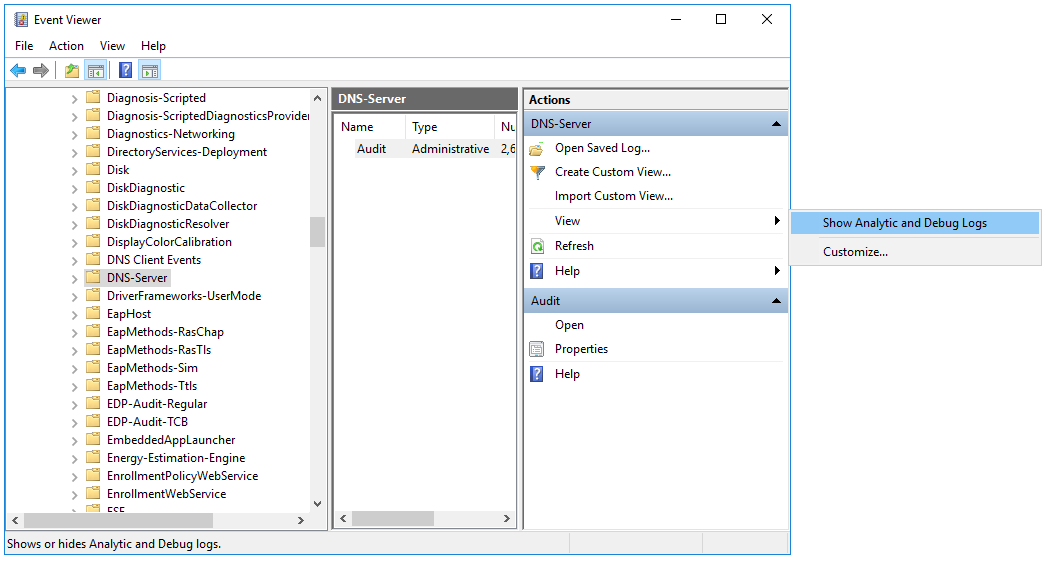
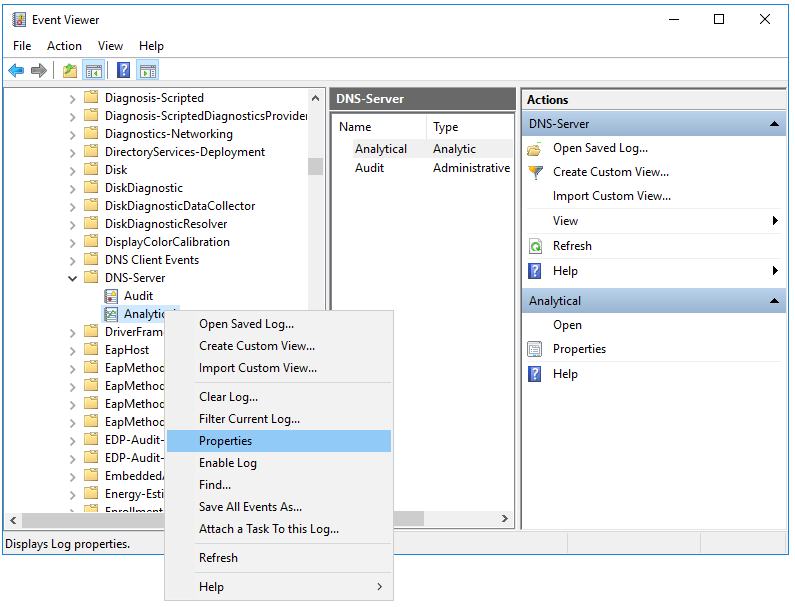
The Audit debug log and Analytical log are displayed.
- Configure the analytic log:
- Open the context menu of the Analytical log and select Properties.
- This opens a window; in that window, make sure that in the Max Log Size (KB) field, the value is
1048576.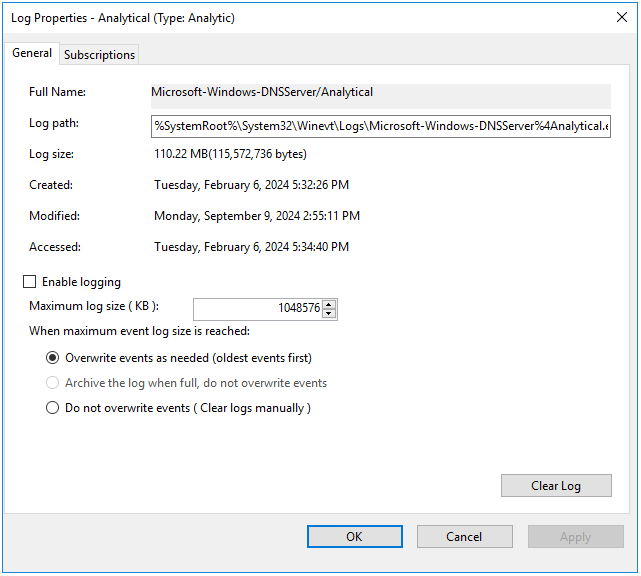
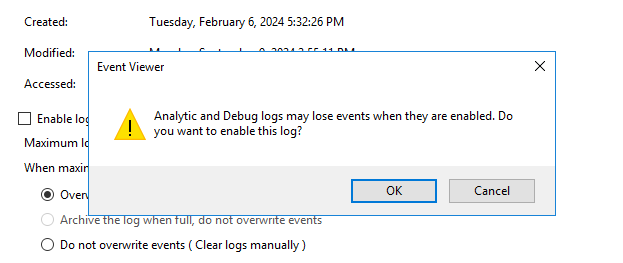
- Select the Enable logging check box and in the confirmation window, click OK.
The analytic log must be configured as follows:
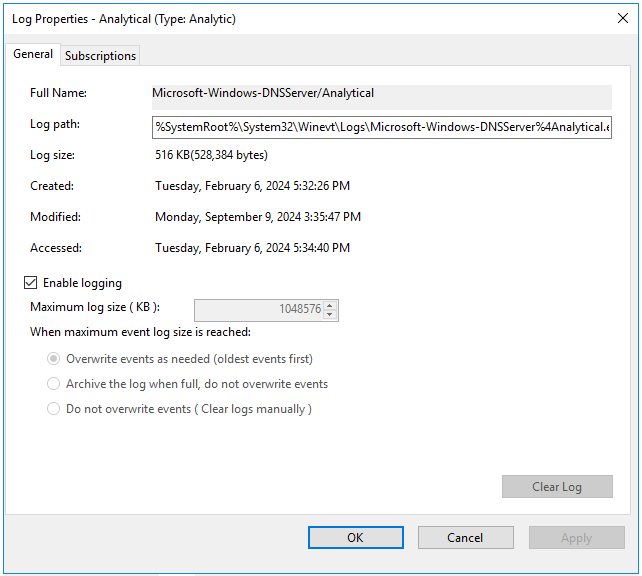
- Click Apply, then click OK.
An error window is displayed.
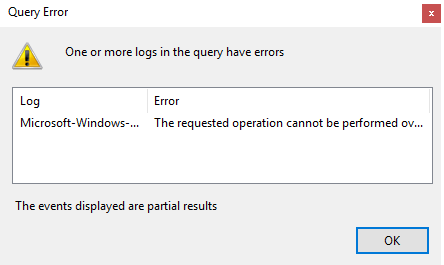
When analytic log rotation is enabled, events are not displayed. To view events, in the Actions pane, click Stop logging.
- Open the context menu of the Analytical log and select Properties.
- Start Computer management as administrator.
- This opens a window; in that window, go to the System Tools → Performance → Startup Event Trace Sessions folder.
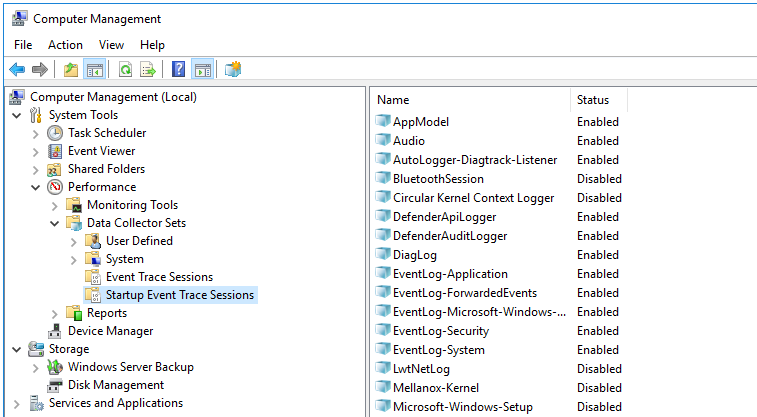
- Create a provider:
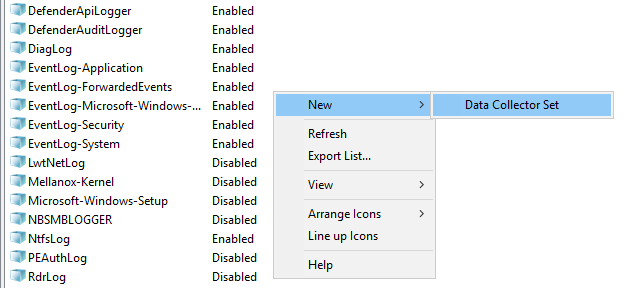
- Open the context menu of the Startup Event Trace Sessions folder and select Create → Data Collector Set.
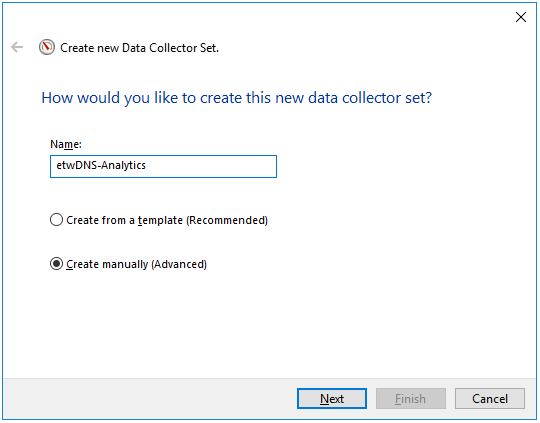
- This opens a window; in that window, enter the name of the provider and click Next.
- Click Add... and in the displayed window, select the Microsoft-Windows-DNSServer provider.
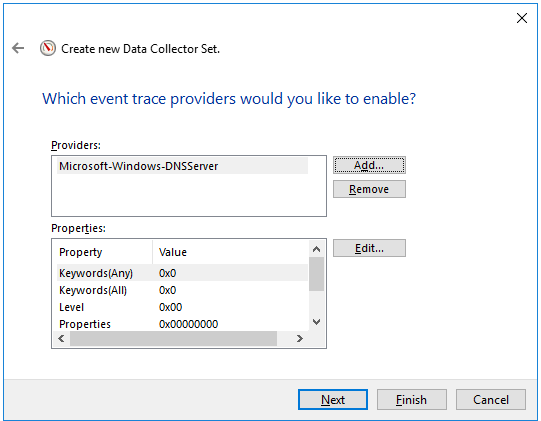
The KUMA agent with the ETW connector works only with System.Provider.Guid: {EB79061A-A566-4698-9119-3ED2807060E7} - Microsoft-Windows-DNSServer.
- Click Next twice, then click Finish.
- Open the context menu of the Startup Event Trace Sessions folder and select Create → Data Collector Set.
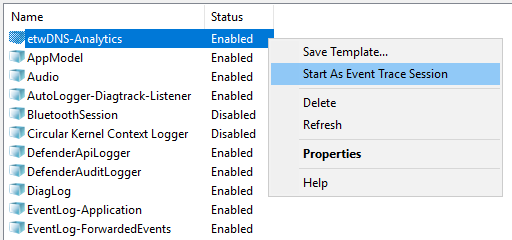
- Open the context menu of the created provider and select Start As Event Trace Session.
- Go to the Event Trace Sessions folder.
Event trace sessions are displayed.
- Open the context menu of the created event trace session and select Properties.
- This opens a window; in that window, select the Trace Sessions tab and in the Stream Mode drop-down list, select Real Time.
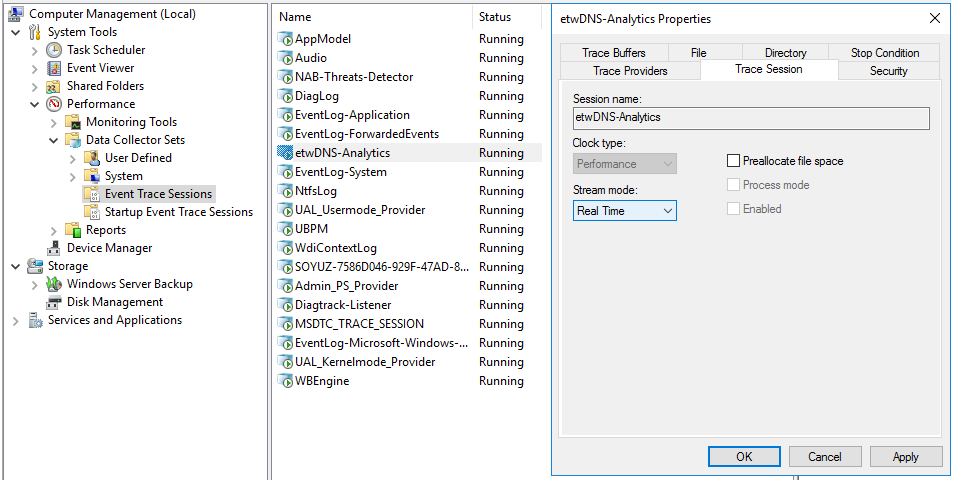
- Click Apply, then click OK.
DNS server event reception using the ETW connector is configured.
Page top