KUMA metric alert triggering conditions
If the value of a KUMA metric for a service exceeds the threshold of the corresponding parameter configured in the Service monitoring section of KUMA, VictoriaMetrics sends an alert, and an error message is displayed in the status of that service.
Alerts are received from VictoriaMetrics at the following intervals:
- VictoriaMetrics collects information from KUMA services every 15 seconds.
- VictoriaMetrics updates alerts for KUMA services every minute.
- The KUMA Core service collects information from VictoriaMetrics every 15 seconds.
Thus, the total delay before a service status is updated is less than 2–3 minutes.
If you disabled the receipt of alerts from VictoriaMetrics, some KUMA services may still be displayed with a yellow status. This can happen in the following cases:
- For a storage service:
- If an alert was received in response to an API request in the /status parameter from ClickHouse
- If cold storage of the Storage service is not being monitored
- For a collector service: If an alert was received in response to an API request in the /status parameter.
- For a correlator service: If a response rule exists that requires the Advanced Responses module, but this module is not covered by the current license, or the license that covers this module has expired.
The table below provides information on which error messages may appear in the service status when an alert is received from VictoriaMetrics, and which metrics and parameters they are based on and in what way. For details on KUMA metrics that can trigger VictoriaMetrics alerts, see Viewing KUMA metrics.
For example, if the Active services table for a service displays a yellow status and the High distribution queue error message (the "Error message" column in the table below), you can view the information in the Enrichment widget, the Distribution Queue metric (the "KUMA metrics" column in the table below).
Description of error messages for KUMA services
Error message |
Configurable alert parameters |
KUMA metric |
Description |
|---|---|---|---|
|
QPS interval/window, minutes QPS Threshold |
Clickhouse / General → Failed QPS |
An error message is displayed if the Failed QPS metric exceeds the specified QPS Threshold value for the duration specified by the QPS interval/window, minutes parameter. For example, if 25 out of 100 requests from VictoriaMetrics to the service were unsuccessful, and the QPS Threshold is 0.2, the alert is calculated as follows: (25 / 100) * 100 > 0.2 * 100 25% > 20% Because the percentage of unsuccessful requests is greater than the specified threshold, an error message is displayed for the service. |
|
Failed insert QPS calculation interval/window, minutes Insert QPS threshold |
Clickhouse / Insert → Failed Insert QPS |
An error message is displayed if the Failed Insert QPS metric exceeds the specified QPS Insert Threshold value for the duration specified by the Failed Insert QPS calculation interval/window, minutes parameter. For example, if 25 out of 100 requests from VictoriaMetrics to the service were unsuccessful, and the QPS Insert Threshold is 0.2, the alert is calculated as follows: (25 / 100) * 100 > 0.2 * 100 25% > 20% Because the percentage of unsuccessful requests is greater than the specified threshold, an error message is displayed for the service. |
|
Distribution queue threshold Distribution queue calculation interval/window, minutes |
Clickhouse / Insert → Distribution Queue |
An error message is displayed if the Distribution Queue metric exceeds the specified Distribution queue threshold value for the duration specified by the Distribution queue calculation interval/window, minutes parameter. |
|
Free space on disk threshold |
OS → Disk |
An error message is displayed if the amount of free disk space (as a percentage) indicated by the Disk metric value is less than the value specified in the Free disk space threshold parameter. For example, an error message is displayed if the partition on which KUMA is installed takes up all the disk space. |
|
Free space on partition threshold |
OS → Disk |
An error message is displayed if the amount of free space (as a percentage) on the disk partition that KUMA is using is less than the value specified in the Free space on partition threshold parameter. For example, an error message is displayed in the following cases:
|
|
Output Event Loss |
IO → Output Event Loss |
An error message is displayed if the Output Event Loss metric has been increasing for one minute. You can enable or disable the display of this error message using the Output Event Loss parameter. |
|
Disk buffer increase interval/window, minutes |
IO → Output Disk Buffer SIze |
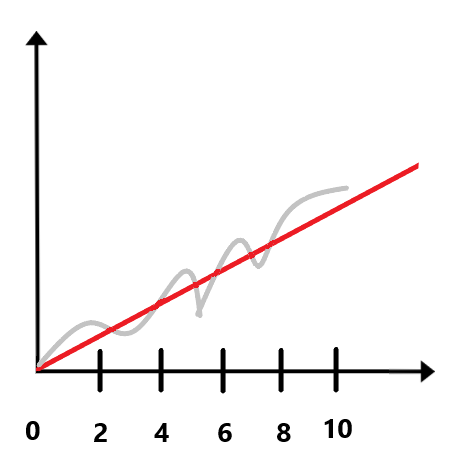
An error message is displayed if the Output Disk Buffer Size metric monotonically increases for 10 minutes with the sampling interval specified by the Disk buffer increase interval/window, minutes parameter. For example, if the Disk buffer increase interval/window, minutes is set to 2 minutes, an error message is displayed if the disk buffer size has monotonically increased for 10 minutes with a sampling interval of 2 minutes (see the figure below).
|
|
Growing enrichment queue interval/window, minutes |
Enrichment → Queue |
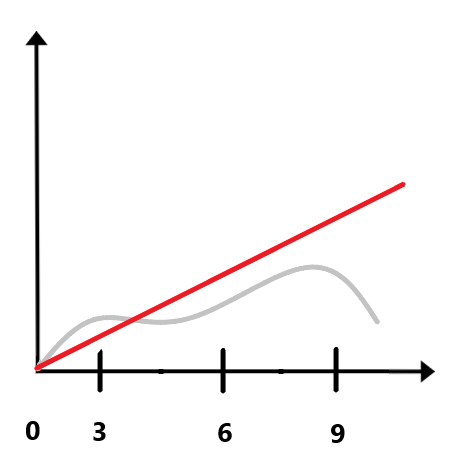
An error message is displayed if the Queue metric monotonically increases for 10 minutes with the sampling interval specified by the Growing enrichment queue interval/window, minutes parameter. For example, if the value of the Growing enrichment queue interval/window, minutes is 3, an error message is displayed if the enrichment queue has monotonically increased every 10 minutes with a sampling interval of 3 minutes. In the case shown in the figure below, the error message is not displayed because at the ninth minute the value of the metric decreased instead of increasing monotonically.
|
|
Enrichment errors |
Enrichment → Errors |
An error message is displayed if the Errors metric has been increasing for one minute. You can enable or disable the display of this error message using the Enrichment errors parameter. |
|
Disable connector errors |
IO → Connector Errors |
An error message is displayed if the Connector Errors metric has been increasing between consecutive polls of the metric by VictoriaMetrics for one minute. You can enable or disable the display of this error message using the Disable connector errors parameter. |

