Events section
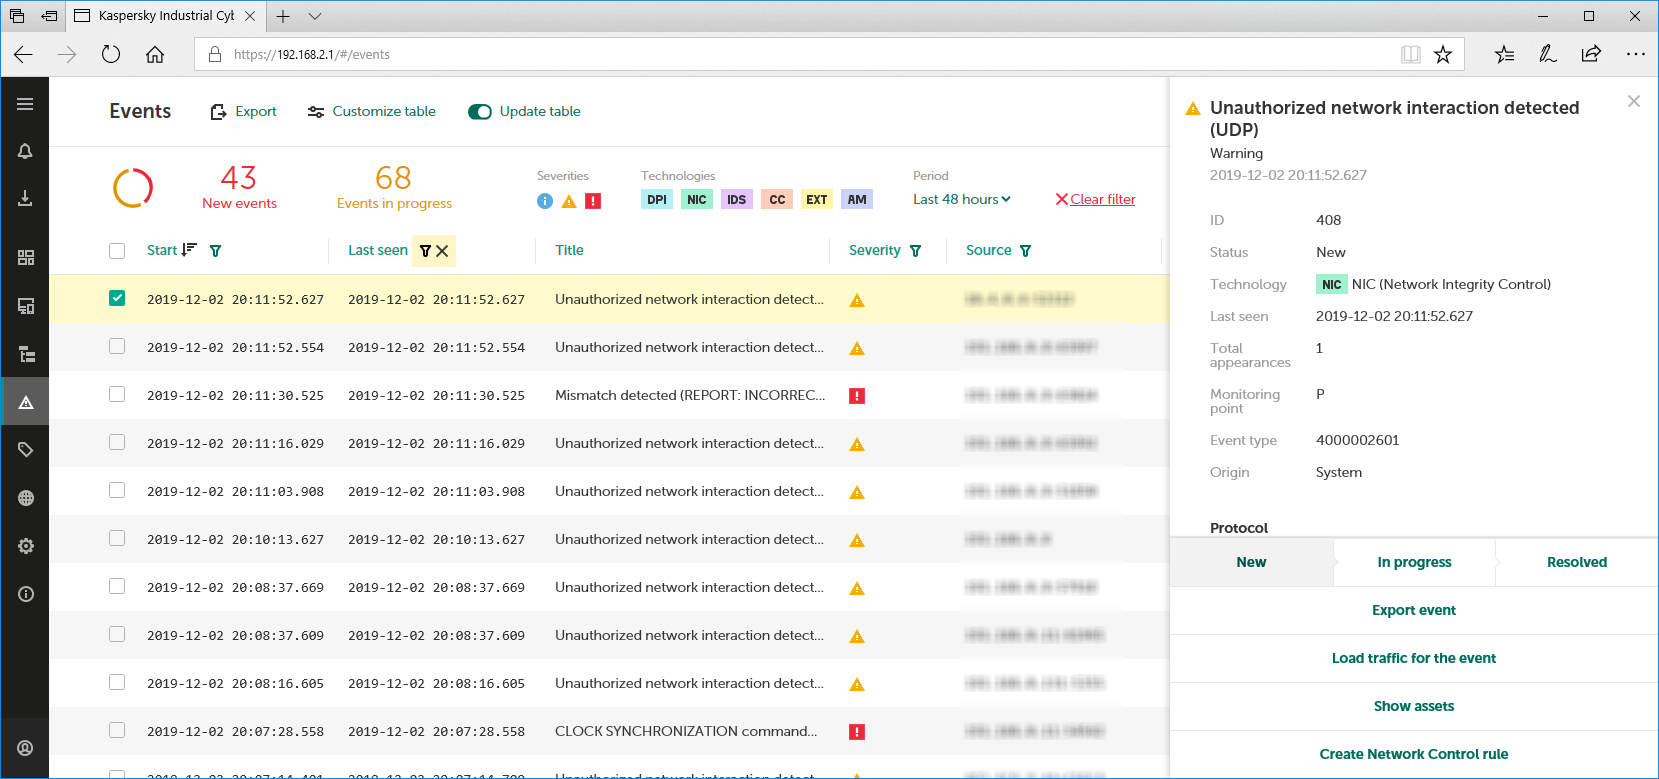
In the Events section of the application web interface (see the figure below), you can view and process events and incidents registered by the application.

Events section
The upper part of the Events section has a toolbar containing the following elements for managing the table:
- Export – lets you export information about all events and incidents with respect to the current filter and search settings in the events table.
- Customize table – opens a window for configuring how the events table is displayed. In this window, you can enable or disable the display of the information panel, select the display mode for events and incidents, and specify the displayed columns and change the order in which they are displayed.
- Update table – enables and disables automatic update of the events table. Automatic update is enabled by default. When automatic update is enabled, the table of registered events is updated in online mode. In this case, the table is sorted by the Last seen column in descending order of the dates and times when the conditions for event registration occurred. If you choose to sort by another column, the events table will no longer be updated.
- Search field – lets you enter a query to search for events and incidents in the table.
- Information panel – contains a chart showing the ratio between events with the New status and events with the In progress status. On the right of the chart is the number of events with these statuses in the database. You can enable and disable the display of the information panel in the window that lets you configure the display of the events table.
- Severity – groups buttons for enabling and disabling the filtering of events and incidents based on their importance level: Informational
 , Warning
  and Critical
  .
. - Technologies – groups buttons for enabling and disabling event filtering based on technology: Deep Packet Inspection (DPI), Network Integrity Control (NIC), Intrusion Detection (IDS), Command Control (CC), External (EXT) and Asset Management (AM).
- Period – lets you filter events and incidents by time period. You can select one of four standard periods or manually specify a period using the Specify a period option. When manually configuring the period, you will see additional fields for selecting the date and time of the beginning and end of the period. If you manually specify a period, the table will no longer be updated.
- Clear filter – resets the defined events filter and search settings to their default state. The button is displayed if search or filter settings are defined.
The main part of the Events section shows a table containing information about registered events and incidents. The information is presented in the columns configured to be displayed. You can sort and filter events and incidents based on values in the columns.
When events or incidents are selected, the details area opens in the right part of the web interface window. This area contains information about the selected events and incidents and the tools for managing them.
Page top