Settings section
The Settings section of the application web interface may contain the following tabs:
- Deployment
On the Deployment tab in the Settings section (see the figure below), you can view information about nodes that have application components installed, and about network interfaces and monitoring points on nodes. If a user account with the Administrator role was used to connect to the Server, you can also manage monitoring points on this tab.
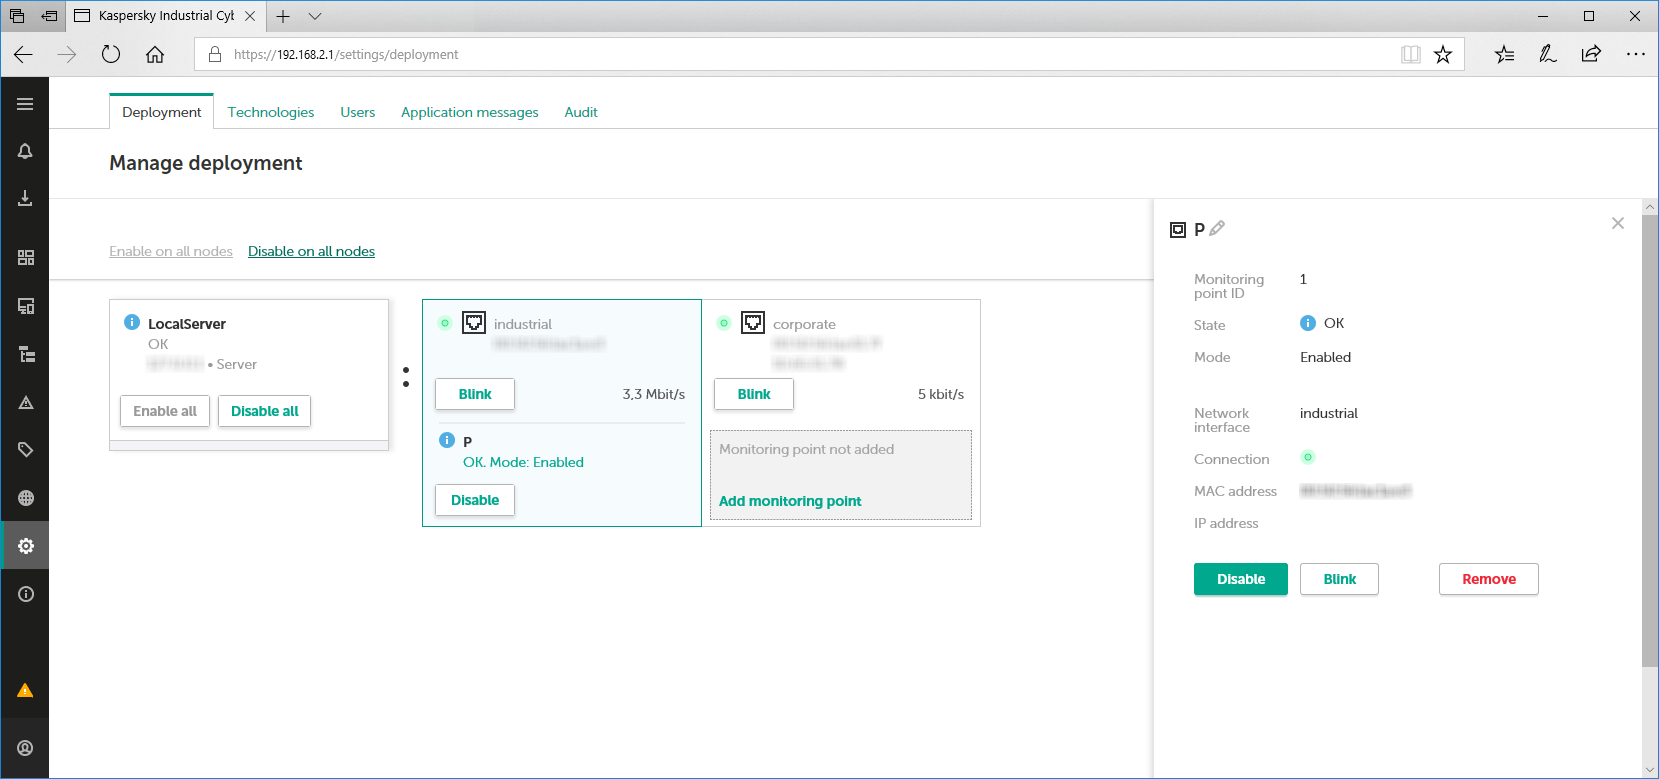
Settings section. Deployment tab
The Deployment tab contains the tiles of nodes that have application components installed (on the left) and tiles of the network interfaces on these nodes (on the right of each node). When you select a node tile or network interface tile, the details area appears in the right part of the window.
- Technologies
On the Technologies tab in the Settings section (see the figure below), you can manage the technologies and methods used for analyzing traffic in Kaspersky Industrial CyberSecurity for Networks. The Technologies tab is displayed if a user account with the Administrator role was used to connect to the Server.
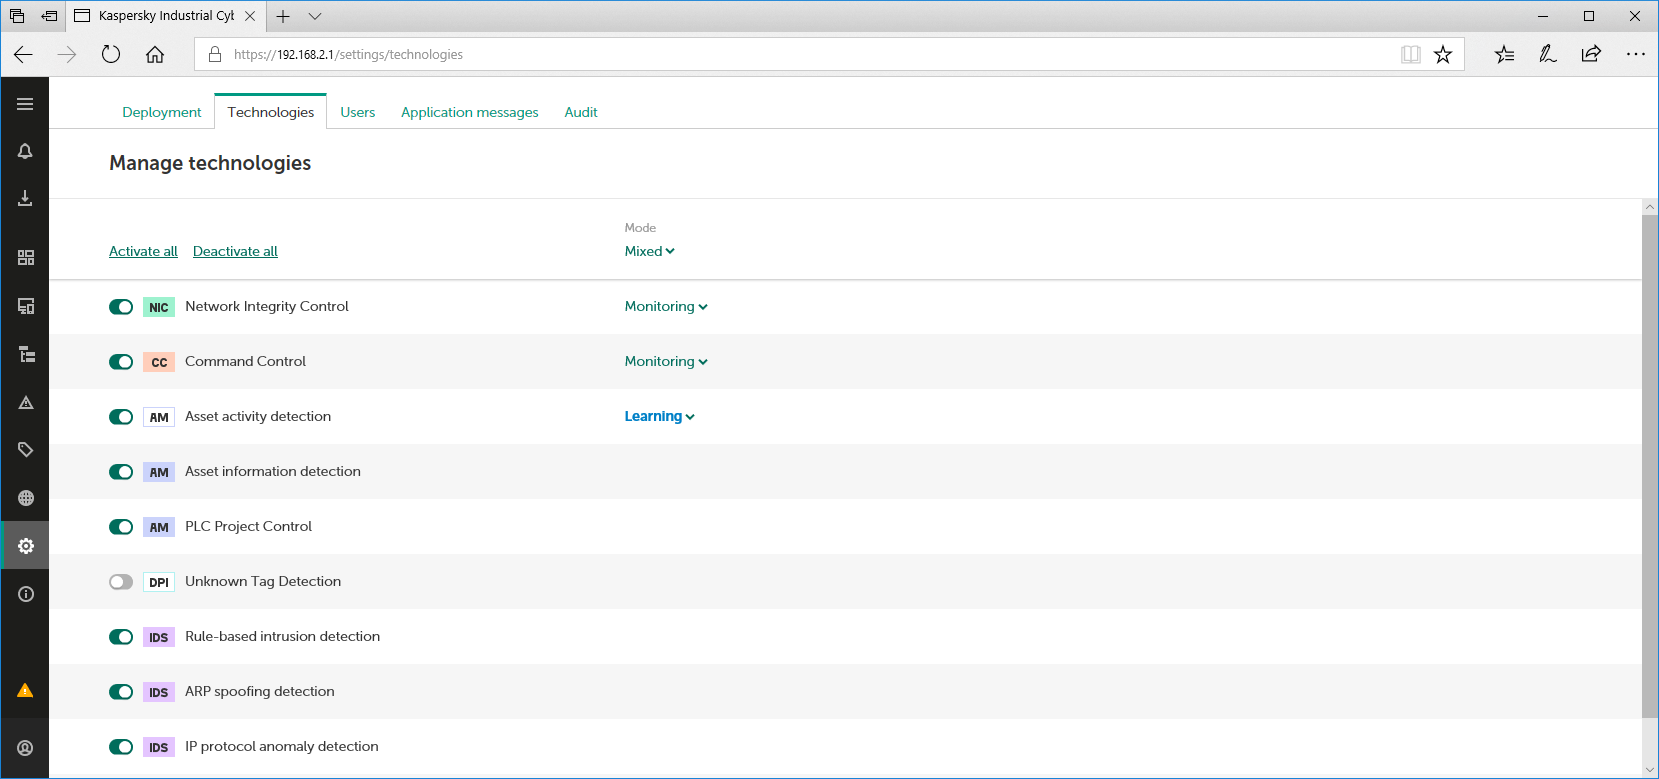
Settings section. Technologies tab
The Technologies tab contains a list of technologies and methods for which you can change the states and operating modes.
- Users
On the Users tab in the Settings section (see the figure below), you can manage application user accounts. The Users tab is displayed if a user account with the Administrator role was used to connect to the Server.
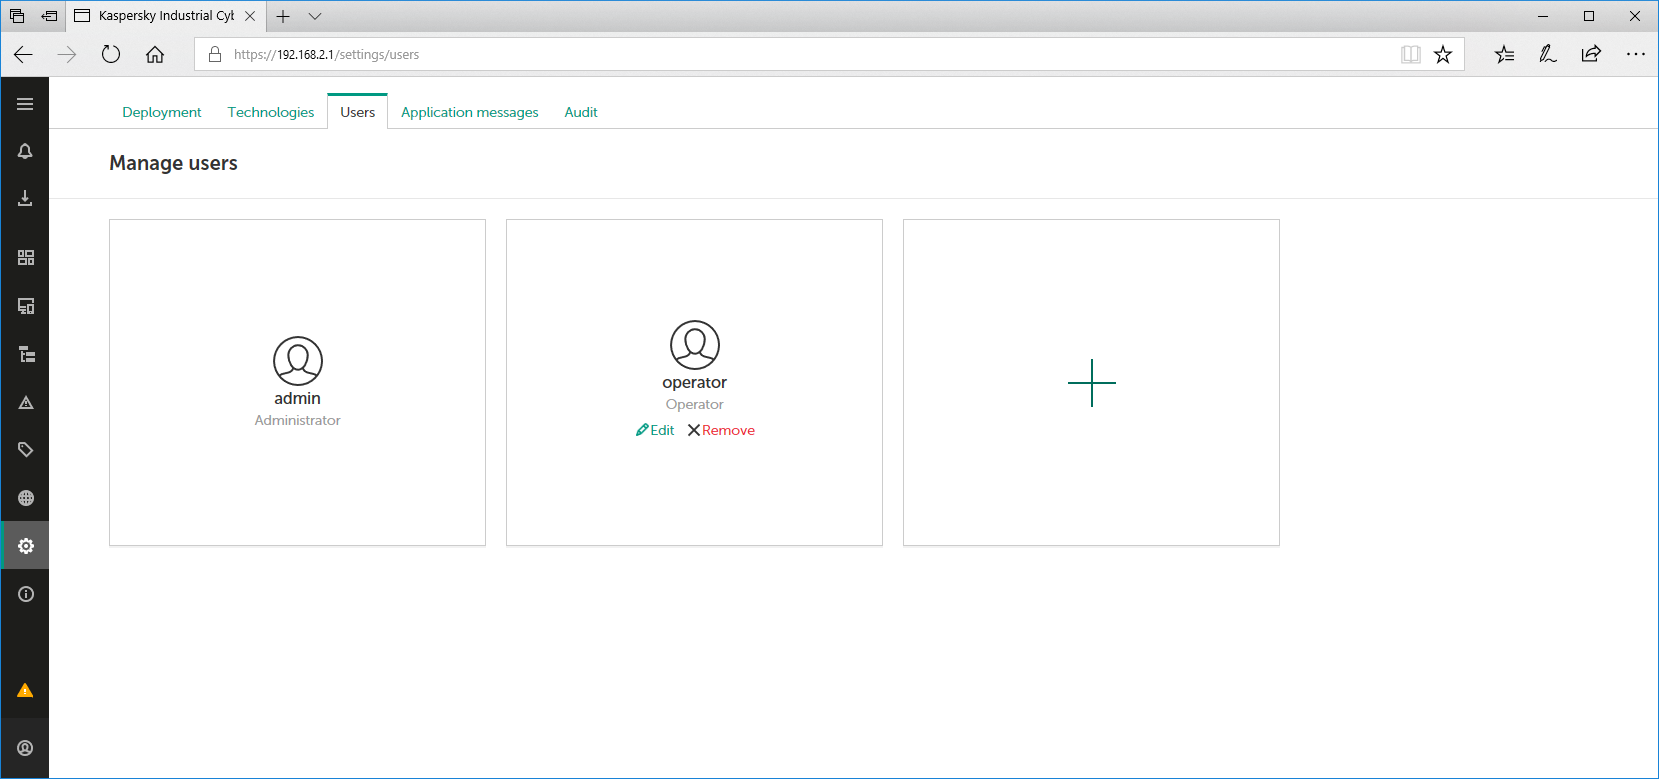
Settings section. Users tab
The Users tab contains tiles for application users and a tile with the plus (+) icon for adding user accounts.
- Application messages
On the Application messages tab in the Settings section (see the figure below), you can view messages about application operation.
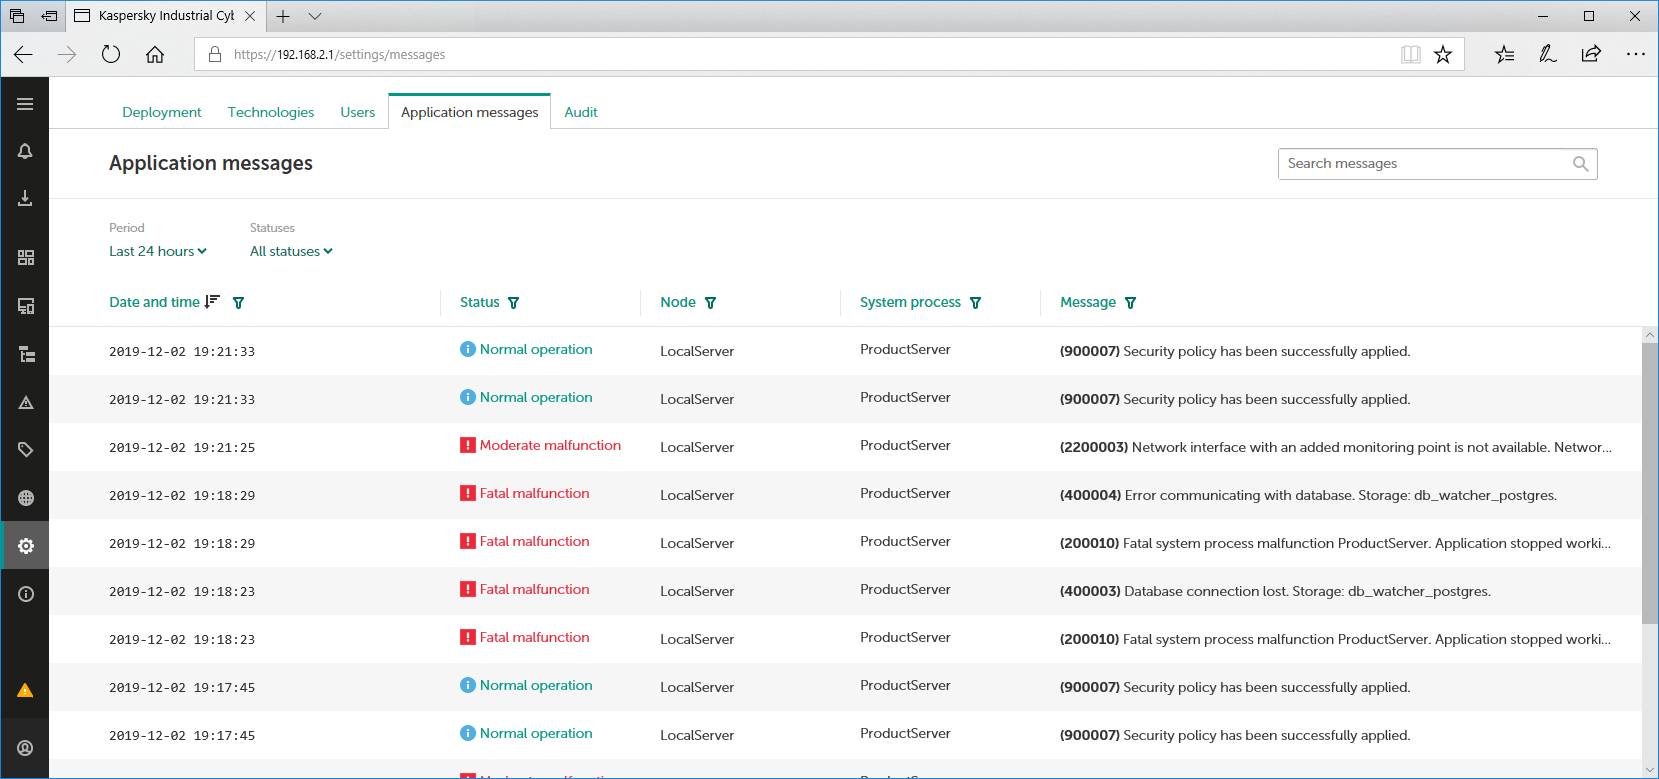
Settings section. Application messages tab
The upper part of the Application messages tab has a toolbar containing the following management elements:
- Search field – lets you enter a query to search messages in the table.
- Period – lets you filter application messages by time period. You can select one of four standard periods or manually specify a period using the Specify a period option. When manually configuring the period, you will see additional fields for selecting the date and time of the beginning and end of the period. If you manually specify a period, the table will no longer be updated.
- Statuses – lets you configure filtering of messages based on their statuses.
- Clear filter – resets the defined message filter and search settings to their default state. The button is displayed if search or filter settings are defined.
Below is a table containing information about registered application messages. You can sort and filter messages based on values in the table columns.
- Audit
On the Audit tab in the Settings section (see the figure below), you can view audit log entries and enable or disable the user activity audit. The Audit tab is displayed if a user account with the Administrator role was used to connect to the Server.
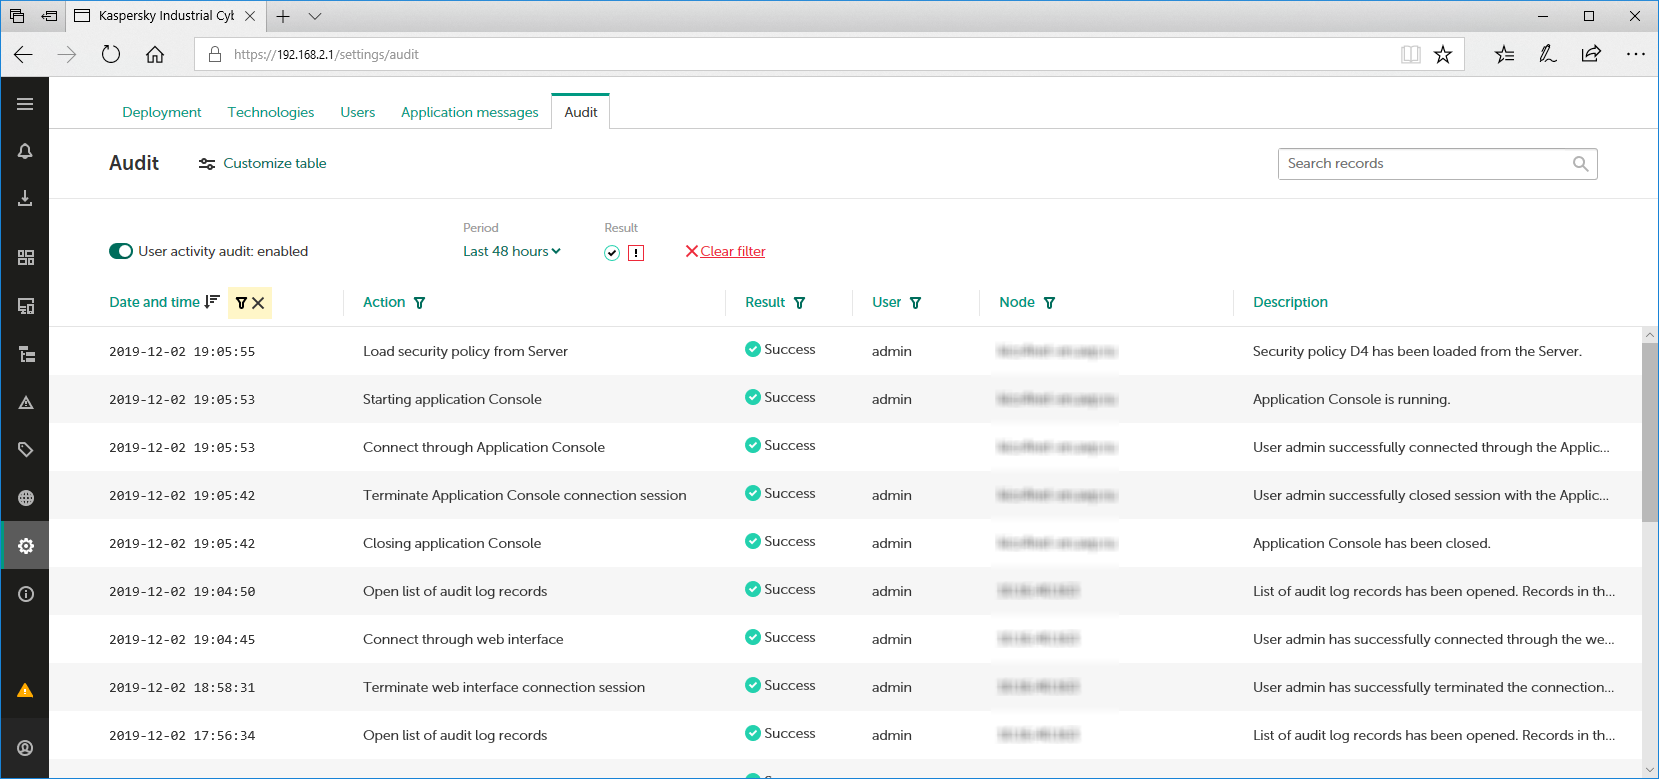
Settings section. Audit tab
The upper part of the Audit tab has a toolbar containing the following management elements:
- Customize table – opens a window for configuring how the audit entries table is displayed. In this window, you can specify the columns to display and change the order in which they are displayed.
- Search field – lets you enter a query to search entries in the table.
- User activity audit: enabled / disabled – enables or disables the user activity audit.
- Period – lets you filter audit entries by time period. You can select one of four standard periods or manually specify a period using the Specify a period option. When manually configuring the period, you will see additional fields for selecting the date and time of the beginning and end of the period. If you manually specify a period, the table will no longer be updated.
- Result – groups buttons for enabling and disabling audit entry filtering based on the results of actions: Success
 and Failure
  .
. - Clear filter – resets the defined entries filter and search settings to their default state. The button is displayed if search or filter settings are defined.
Below is a table containing information about registered audit entries. You can sort and filter entries based on values in the table columns.
The displayed tabs depend on which role is assigned to the user who established the connection to the Server.
Page top