Network map section
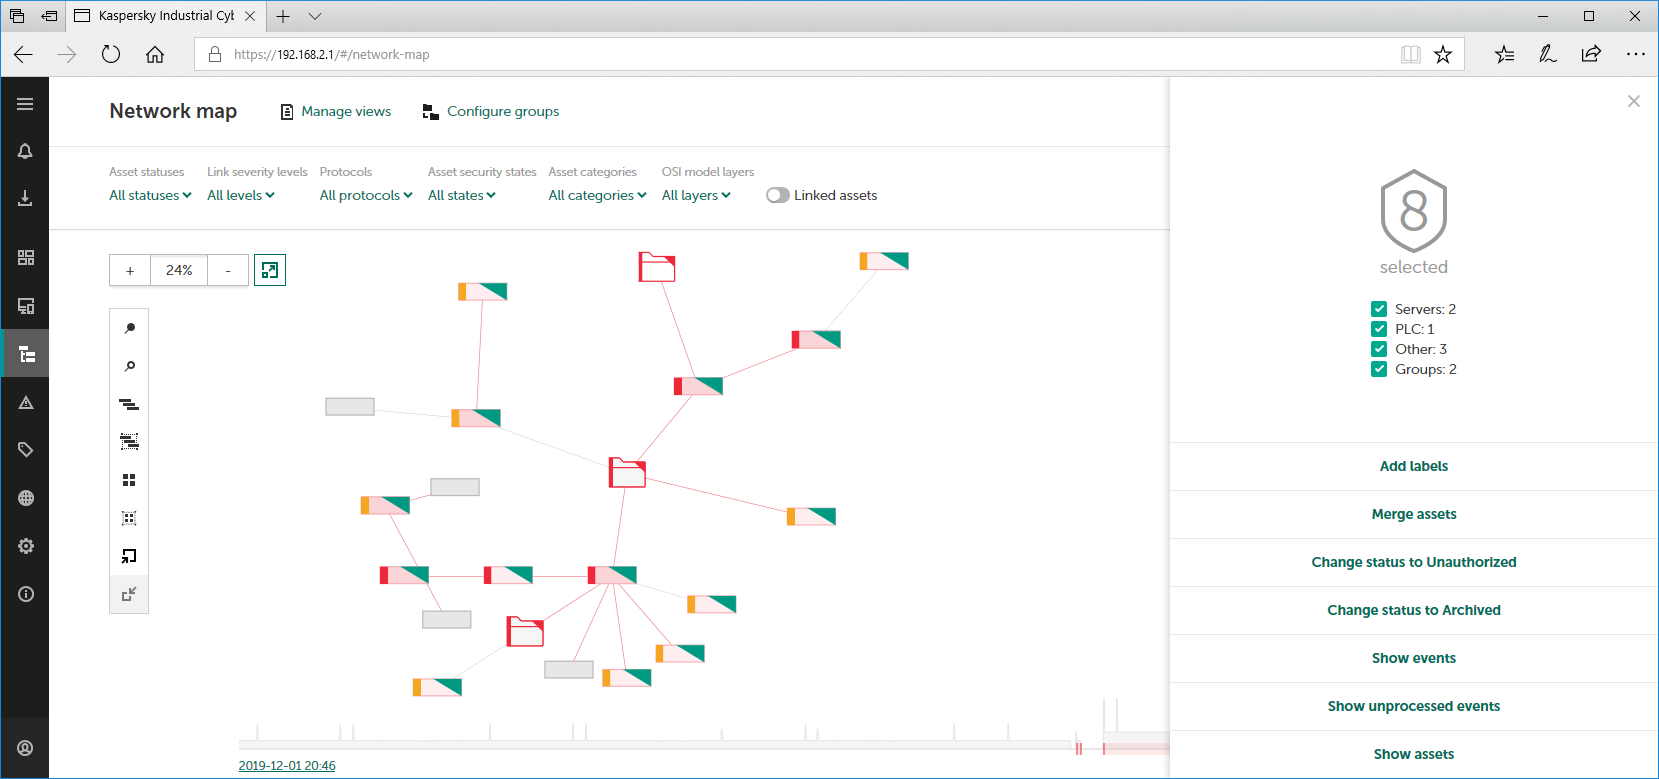
In the Network map section of the application web interface (see the figure below), you can view information about the interactions of assets.

Network map section
The upper part of the Network map section has a toolbar containing the following management elements:
- Manage views – opens a window for saving and applying the network map display settings.
- Configure groups – opens a window for creating an asset group tree. In this window, you can add or remove asset groups, arrange them in the tree, and rename them.
- Search field – lets you enter a query to search nodes on the network map.
- Asset statuses – lets you configure filtering of nodes by asset status.
- Link severity levels – lets you configure filtering of links based on the severity of their associated events.
- Protocols – lets you configure filtering of links based on their communication protocols.
- Asset states – lets you configure filtering of nodes based on the security states of assets.
- Asset categories – lets you configure filtering of nodes by asset category.
- OSI model layers – lets you configure filtering of links based on the levels of communications corresponding to the layers of the OSI model (Open Systems Interconnection) for the network protocol stack.
- Linked assets – enables and disables the display of all nodes that have communicated with the filtered nodes (regardless of the defined filter settings).
- Clear filter – resets the defined object filter settings to their default state. This button is displayed if filter settings have been defined.
The network map display area shows nodes, links, and asset groups. The left part of the display area contains the following toolbars:
- Horizontal panel containing the + and – buttons for changing the scale, and the
 button for automatic positioning of the network map.
 - Vertical panel with the following buttons:
 – pins all the displayed nodes and collapsed groups.
 – unpins all the displayed nodes and collapsed groups.
-
 – radially arranges all nodes and collapsed groups.
  . – radially arranges the selected nodes and collapsed groups.
 – aligns all nodes and collapsed groups to the grid.
 – aligns the selected nodes and collapsed groups to the grid.
 – expands all the collapsed groups of assets.
 – collapses all the expanded groups of assets.
When one or multiple nodes or collapsed groups are selected, or when a link is selected, the details area opens in the right part of the web interface window. This area contains information about the selected objects and the tools for managing them.
The lower part of the Network map section contains a time scale that you can use to select the period for filtering nodes and links based on the time of their communications.
Page top