Working with incidents and groups of incidents
In Kaspersky MLAD, an ML model can simultaneously use multiple types of detectors that analyze incoming telemetry data and detect incidents independent of each other. The Kaspersky MLAD web interface provides the capability to investigate detected incidents. Depending on the type of detector that registered an incident, information about the incident and the methods you can use to investigate it may differ.
You can perform the following actions for any incident:
- Analyze the incident details.
- Find out if any similar incidents were detected previously.
- Study the behavior of the monitored asset at the moment when the incident was detected.
- Leave a note or expert opinion for a registered incident or incident group.
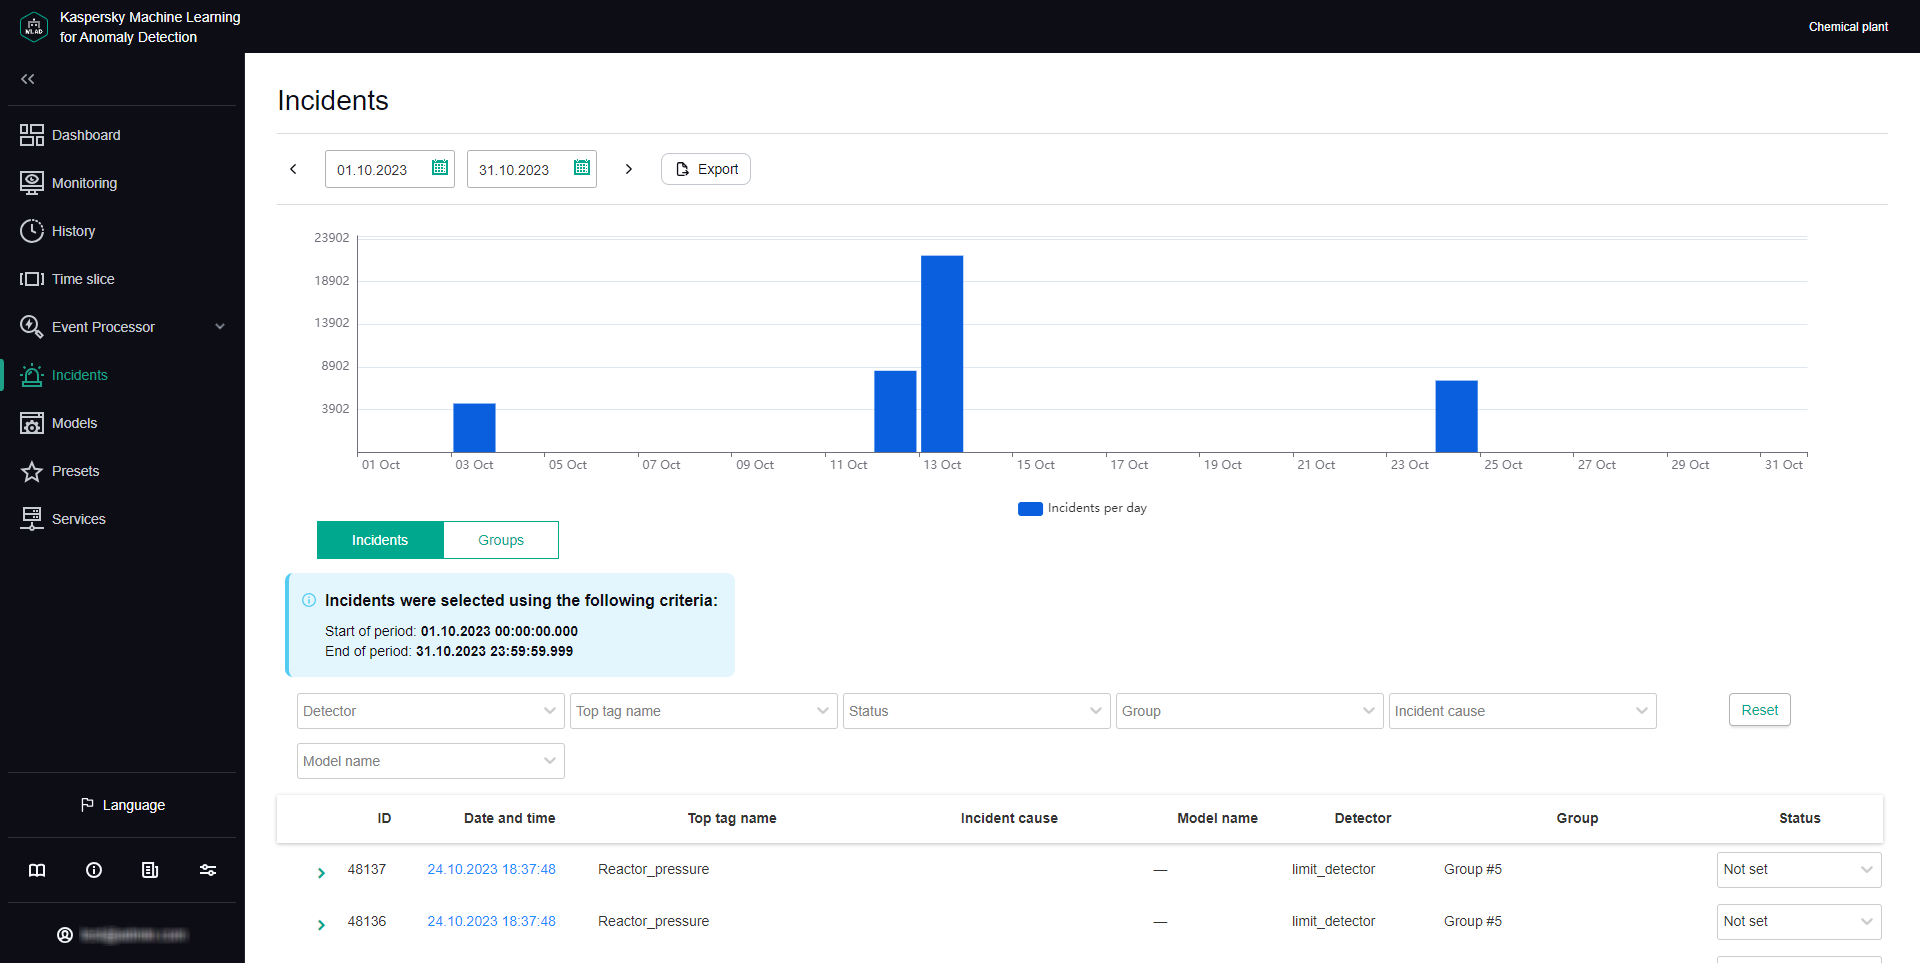
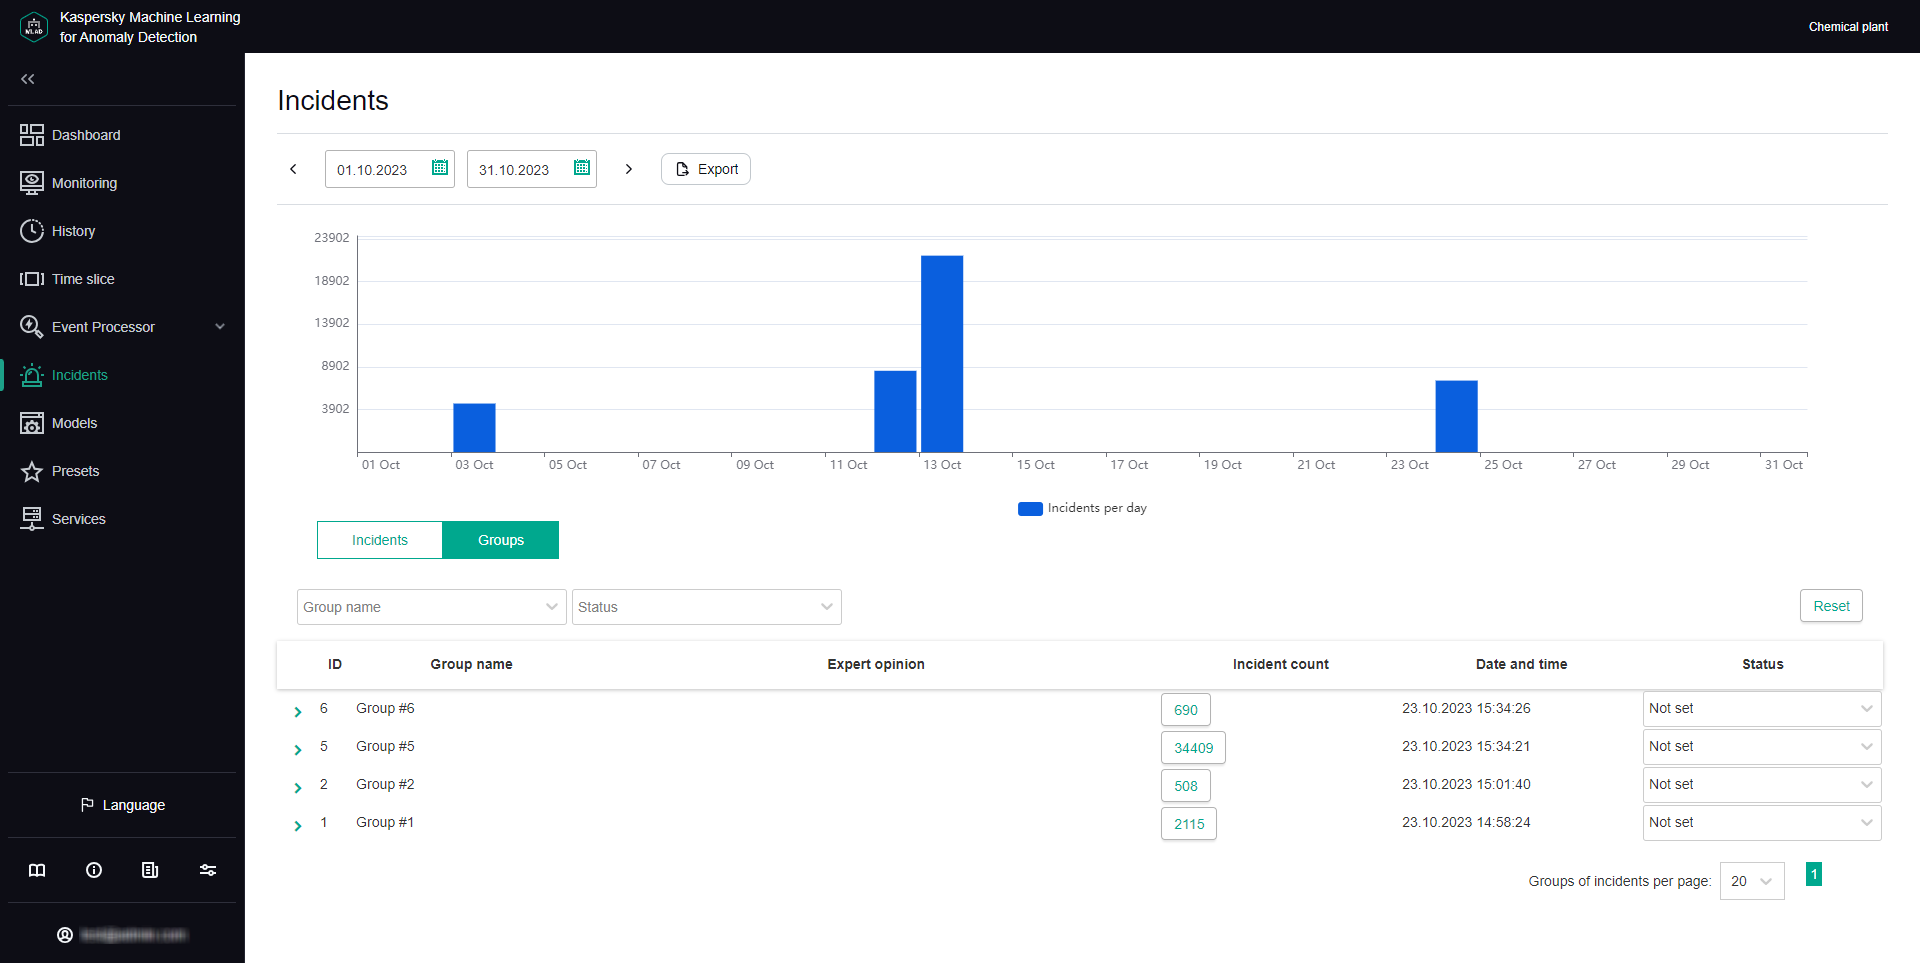
The Incidents section displays a column graph showing the incidents that match the filtering criteria specified under the graph. The graph displays statistics on the registered incidents for the period specified above the graph.
The graph can display up to 60 bars. If the specified period does not exceed 60 days, incidents on the graph are grouped by days. If the specified period is between 60 days and 60 weeks, incidents on the graph are grouped by weeks. If the specified period is longer than 60 weeks, incidents on the graph are grouped by months.
Hovering the mouse pointer over a bar of the graph displays a window showing the number of registered incidents per corresponding time period. Upon clicking a bar, the graph and in the table below display information about the incidents registered during the corresponding time period.
In this section, you can view individual incidents as well as groups of incidents.
Incidents tab
The Incidents tab shows a table of registered incidents. Incidents are sorted by date in descending order, with the newest incidents shown first.

Incidents tab
You can go to the History section by clicking the date and time of the incident.
Groups tab
The Groups tab shows a table of incident groups. Kaspersky MLAD automatically generates groups of similar incidents.
You can change the group name that was assigned automatically and set the status of incidents that belong to this group. You can also provide an expert opinion that contains the recommended actions to take in response to new incidents in this group, for example.

Groups tab