Contents
- Integration with Splunk
- Integration steps (Splunk)
- Single-instance integration (Splunk)
- About the single-instance integration scheme
- Step 1. Installing Kaspersky CyberTrace App (single-instance deployment)
- Step 2 (optional). Configuring Kaspersky CyberTrace App (single-instance deployment)
- Step 3 (optional). Configuring the lookup script (single-instance deployment)
- Step 4. Performing the verification test (Splunk, single-instance integration)
- Distributed integration scheme (Splunk)
- About the distributed integration scheme
- Step 1. Installing Forwarder and Search Head apps
- Step 2. Configuring Forwarder and Search Head apps (distributed deployment)
- Step 3 (optional). Configuring the lookup script (distributed deployment)
- Step 4. Performing the verification test (Splunk, distributed integration)
Integration with Splunk
This chapter describes how to integrate Kaspersky CyberTrace with Splunk.
Integration steps (Splunk)
This chapter describes how to integrate Kaspersky CyberTrace with Splunk.
About the integration schemes
Kaspersky CyberTrace can be integrated with Splunk in two integration schemes:
- Single-instance integration scheme
In the single-instance integration scheme, Feed Service and the Splunk instance are configured to work on the same computer or on different computers.
- Distributed integration scheme
In the distributed integration scheme, you install Feed Service, Search Head App, and Forwarder App in your distributed Splunk environment and configure the service and the apps to interact with each other.
How to integrate Kaspersky CyberTrace with Splunk in the single-instance integration mode
To integrate Kaspersky CyberTrace with Splunk in the single-instance integration mode:
- Make sure that you have installed Kaspersky CyberTrace.
In the single-instance integration scheme, Kaspersky CyberTrace and the Splunk instance are installed on the same computer or on different computers. By default, Kaspersky CyberTrace App for Splunk is configured to be installed on the same computer with Kaspersky CyberTrace. However, we recommend that you install Kaspersky CyberTrace on a separate computer; in this case, Feed Service must be configured during the installation, and Kaspersky CyberTrace App for Splunk must be configured in step 2 (below).
- Step 1. Install Kaspersky CyberTrace App for Splunk.
- Step 2 (optional). Configure Kaspersky CyberTrace App for Splunk.
This step is optional. If you skip this step, Kaspersky CyberTrace App for Splunk will use the default configuration. Email alerts will not be sent in this case.
By default, Kaspersky CyberTrace App for Splunk uses port
9999to send events to Kaspersky CyberTrace and port9998to receive events from Kaspersky CyberTrace. If these ports are used by another application, you must configure either Kaspersky CyberTrace App for Splunk or the other application to use different ports. - Step 3 (optional). Configure the lookup script.
This step is optional. If you skip this step, the lookup script will use the default configuration.
- Step 4. Perform the verification test.
Please make sure you perform the verification test before editing any matching process settings.
How to integrate with Splunk in the distributed integration mode
To integrate Kaspersky CyberTrace with Splunk in the distributed integration mode:
- Make sure that you have installed Kaspersky CyberTrace.
In the distributed deployment scheme, you can install Kaspersky CyberTrace on one of the computers that has Forwarder or Indexer already installed, or on a separate computer.
In the distributed deployment scheme, you must configure Feed Service during the installation to receive events from other Splunk entities such as heavy forwarders and indexers, and send its own events to the indexer that stores the index used by Kaspersky CyberTrace App for Splunk.
- Step 1. Install Forwarder App and Search Head App.
- Step 2. Configure Forwarder App and Search Head App so that they can interact with each other and forward events to Kaspersky CyberTrace.
- Step 3 (optional). Configure the lookup script.
This step is optional. If you skip this step, the lookup script will use the default configuration.
- Step 4. Perform the verification test.
Please make sure you perform the verification test before editing any matching process settings.
Single-instance integration (Splunk)
This section contains instructions for integrating Kaspersky CyberTrace and Splunk in the single-instance integration scheme.
About the single-instance integration scheme
By default, both Feed Service and Kaspersky CyberTrace App use the following integration scheme. This scheme is the single-instance integration scheme.
About apps and services
The single instance integration scheme uses one app and one service:
- Feed Service
This service matches Splunk events against Kaspersky Threat Data Feeds.
Feed Service sends the resulting events to Splunk. Splunk stores the events from Feed Service in the
mainindex. - Kaspersky CyberTrace App
This app contains Kaspersky CyberTrace App dashboards, alert templates, and a lookup script. The app also contains parsing rules for Feed Service events and rules for forwarding events from Splunk to Feed Service.
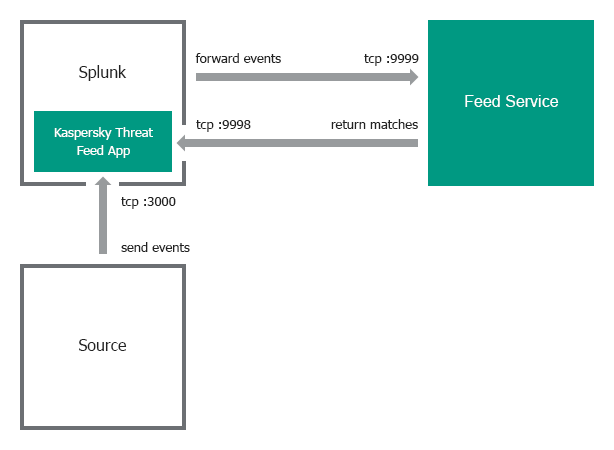
Single-instance integration scheme
In the single-instance integration scheme, Splunk Apps and Feed Service work on the same computer by default (IP address is 127.0.0.1). Kaspersky CyberTrace App receives input on port 3000 and forwards it to Feed Service on port 9999. Feed Service then returns matches to Kaspersky CyberTrace App on port 9998.
If you want to install Feed Service on a separate computer, you must specify addresses and ports used by Feed Service and Kaspersky CyberTrace App when installing Kaspersky CyberTrace.
Single-instance integration scheme
Event format
By default, Kaspersky CyberTrace App and Feed Service receive events in a certain format:
- Feed Service uses regular expressions from its configuration file to parse events. You can view and configure these regular expressions on the Settings > Matching tab in Kaspersky CyberTrace Web. These regular expressions parse a specific format of inbound data. For example, the default regular expression for URLs matches strings that contains a protocol (for example,
http://orhttps://). If URLs in the events that come from your devices do not contain protocols, you must change the regular expression. - The lookup script that comes with Kaspersky CyberTrace App sends events to Feed Service in a format that matches the regular expressions used by Feed Service. When you change the regular expressions, edit the lookup script so that it uses a format that matches the new regular expressions.
Step 1. Installing Kaspersky CyberTrace App (single-instance deployment)
This section describes the process of installing Kaspersky CyberTrace App.
Kaspersky CyberTrace App is installed from the %service_dir%/integration/splunk/Kaspersky-CyberTrace-App-for-Splunk.tar.gz file.
Installing the app
To install Kaspersky CyberTrace App:
- In Splunk Web, go to the home page.
- On the home page, click the Manage Apps button.
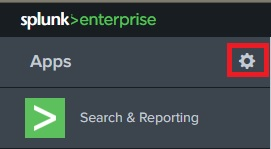
Manage Apps button
- On the Apps page, click the Install app from file button.

Install app from file button
- In the Upload an app window, click Choose File and select the Kaspersky CyberTrace App application file.
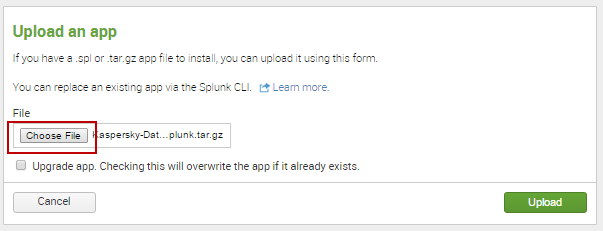
Choose File button
- In the Upload an app window, click the Upload button.
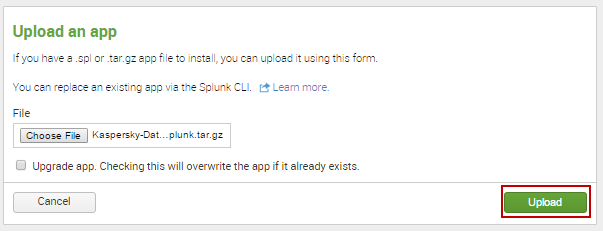
Upload button
- In the Restart required window, click the Restart Splunk button.
This step can be skipped, depending on the Splunk version. If Splunk does not display the Restart required window, skip this step.
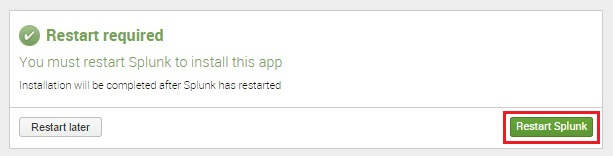
Restart Splunk button
- When Splunk starts again, the Apps page will open with information about the successful installation of Kaspersky CyberTrace App. Kaspersky CyberTrace App will appear in the list of apps on the Splunk home page.
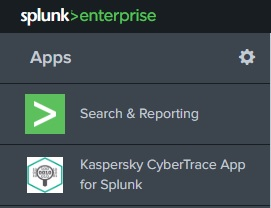
Kaspersky CyberTrace App for Splunk in the list of apps
Step 2 (optional). Configuring Kaspersky CyberTrace App (single-instance deployment)
Kaspersky CyberTrace App reads its parameters from the configuration files. These configuration files define input settings, output settings, and the event format used by Kaspersky CyberTrace App.
Restart Splunk after you have made changes to the Kaspersky CyberTrace App configuration files.
Edit only those Kaspersky CyberTrace App configuration files that are described in this section. Editing other Kaspersky CyberTrace App configuration files may result in unpredictable behavior.
About the configuration files
The following configuration files can be used to configure Kaspersky CyberTrace App ($SPLUNK_HOME is the Splunk installation directory):
$SPLUNK_HOME/etc/apps/Kaspersky-CyberTrace-App-for-Splunk/default/commands.confThis configuration file specifies the command for the lookup script.
$SPLUNK_HOME/etc/apps/Kaspersky-CyberTrace-App-for-Splunk/default/inputs.confThis configuration file specifies the Kaspersky CyberTrace App input settings. This includes ports and addresses for data from event sources and for incoming detection events from Feed Service.
$SPLUNK_HOME/etc/apps/Kaspersky-CyberTrace-App-for-Splunk/default/outputs.confThis configuration file specifies the parameters for forwarding events to Feed Service.
$SPLUNK_HOME/etc/apps/Kaspersky-CyberTrace-App-for-Splunk/default/props.confThis configuration file specifies the parameters for processing input data.
$SPLUNK_HOME/etc/apps/Kaspersky-CyberTrace-App-for-Splunk/default/savedsearches.confThis configuration file specifies the parameters for alert templates.
Default commands.conf file
This file specifies the lookup script that Kaspersky CyberTrace App will use when the user runs the klsearch command.
Below, you can view the default contents of the commands.conf configuration file.
[klsearch] filename = kl_search.py |
Default inputs.conf file
This file specifies input settings for Kaspersky CyberTrace App.
By default, Kaspersky CyberTrace App does the following:
- It receives detection events from Feed Service at address
:9998. - It receives data from sources at address
:3000(and then forwards it to address127.0.0.1:9999, which is specified in outputs.conf).
Below, you can view the default contents of the inputs.conf configuration file.
[tcp://:9998] _INDEX_AND_FORWARD_ROUTING=local connection_host = dns index = main sourcetype = kl_cybertrace_events source = tcp:9998 disabled = false
[tcp://:3000] _TCP_ROUTING = service9999 |
Default outputs.conf file
This file specifies the output settings for Kaspersky CyberTrace App.
By default, Kaspersky CyberTrace App forwards data from the address :3000 to the Feed Service at the address 127.0.0.1:9999. The input port (:3000) is specified in inputs.conf.
Below, you can view the default contents of the outputs.conf configuration file.
[tcpout] defaultGroup = noforward disabled = false
[indexAndForward] index=true
[tcpout:service9999] disabled=false server = 127.0.0.1:9999 sendCookedData = false |
Default props.conf file
This file specifies how Splunk processes incoming data.
By default, Kaspersky CyberTrace App does the following:
- It defines how time stamps are extracted from incoming data.
- It defines a delimiter (line breaker) between events for incoming data.
For example, if the incoming data has the sequence
"%data_1%\n\n%data_2%"and the line breaker is one or more\nsymbols, Splunk splits this sequence into two events (%data_1%and%data_2%).
Below, you can view the default contents of the props.conf configuration file.
[source::tcp:3000] TIME_PREFIX = ^ MAX_TIMESTAMP_LOOKAHEAD = 17 TIME_FORMAT = %b %d %H:%M:%S LINE_BREAKER = ([\n]+) SHOULD_LINEMERGE = false
[source::tcp:9998] TIME_PREFIX = ^ MAX_TIMESTAMP_LOOKAHEAD = 17 TIME_FORMAT = %b %d %H:%M:%S LINE_BREAKER = ([\n]+) SHOULD_LINEMERGE = false |
Managing event sources
You can change the port Kaspersky CyberTrace App listens on for incoming events from a source, or add new event sources.
To change the port Kaspersky CyberTrace App listens on for incoming events from a source:
- In inputs.conf, change the default port number
3000to the port number that you want.For example, if you want to change
3000to3010, the record in inputs.conf looks like the following:[tcp://:3010]
_TCP_ROUTING = service9999
- In props.conf, also change the default port number 3000 to the port number that you want.
For example, if you want to change
3000to3010, the record in props.conf looks like the following:[source::tcp:3010]
TIME_PREFIX = ^
MAX_TIMESTAMP_LOOKAHEAD = 17
TIME_FORMAT = %b %d %H:%M:%S
LINE_BREAKER = ([\n]+)
SHOULD_LINEMERGE = false
- Restart Splunk.
To add a new event source:
- In inputs.conf, specify a new event source that uses the
service9999TCP routing rule.All data from this input will be forwarded to Feed Service.
- In props.conf, specify how data from this source must be processed.
- Restart Splunk.
Make sure that data from the new event source matches the regular expressions used by Kaspersky CyberTrace.
Below is an example of adding the address :3001 as the event source; it specifies that data from :3001 must be processed as are other input data in the default integration scheme (in this scheme, the forwarder, indexer, and search head are installed on a single computer).
# to inputs.conf [tcp://:3001] _TCP_ROUTING = service9999
# to props.conf [source::tcp:3001] TIME_PREFIX = ^ MAX_TIMESTAMP_LOOKAHEAD = 17 TIME_FORMAT = %b %d %H:%M:%S LINE_BREAKER = ([\n]+) SHOULD_LINEMERGE = false |
Changing the address and port for data from Feed Service
By default, Kaspersky CyberTrace App is configured to receive data from Feed Service at port 9998 at any available address. This is specified in the inputs.conf configuration file of Kaspersky CyberTrace App. If you want to receive data from Feed Service only at a specific address and port (for example, if Splunk has access to several network interfaces), edit the inputs.conf file accordingly.
Use the following rules to specify the address and port where data from Feed Service must be received by Kaspersky CyberTrace App:
- If Feed Service and Splunk are located on the same computer, use the following format to specify the port where data from Feed Service must be received by Kaspersky CyberTrace App:
[tcp://127.0.0.1:<port>] - If Feed Service and Splunk are located on different computers, use the following format to specify the address and port where data from Feed Service must be received by Kaspersky CyberTrace App:
[tcp://<address>:<port>] - To specify that Kaspersky CyberTrace App will receive data from Feed Service at any available address, use the following format:
[tcp://:<port>]Note that this format can affect security, because Kaspersky CyberTrace App will receive information at the specified port of every available network interface.
In the format examples above, <address> and <port> are the IP address and port that Kaspersky CyberTrace App will listen on for incoming data from Feed Service.
You may also have to change the addresses and ports for outbound events used by Kaspersky CyberTrace.
Below are examples of specifying the address and port where data from Feed Service is to be received.
In the following example, Feed Service and Splunk are located on the same computer. Kaspersky CyberTrace App receives detection events at port 9998 port of that same computer.
[tcp://127.0.0.1:9998] _INDEX_AND_FORWARD_ROUTING=local connection_host = dns index = main sourcetype = kl_cybertrace_events source = tcp:9998 disabled = false |
In the following example, Feed Service and Splunk are located on different computers. Kaspersky CyberTrace App receives detection events from Feed Service at address 192.0.2.42:9997.
[tcp://192.0.2.42:9997] _INDEX_AND_FORWARD_ROUTING=local connection_host = dns index = main sourcetype = kl_cybertrace_events source = tcp:9997 disabled = false |
In the following example, Kaspersky CyberTrace App receives detection events from Feed Service at port 3000 of any available address.
[tcp://:3000] _INDEX_AND_FORWARD_ROUTING=local connection_host = dns index = main sourcetype = kl_cybertrace_events source = tcp:3000 disabled = false |
Configuring alert templates
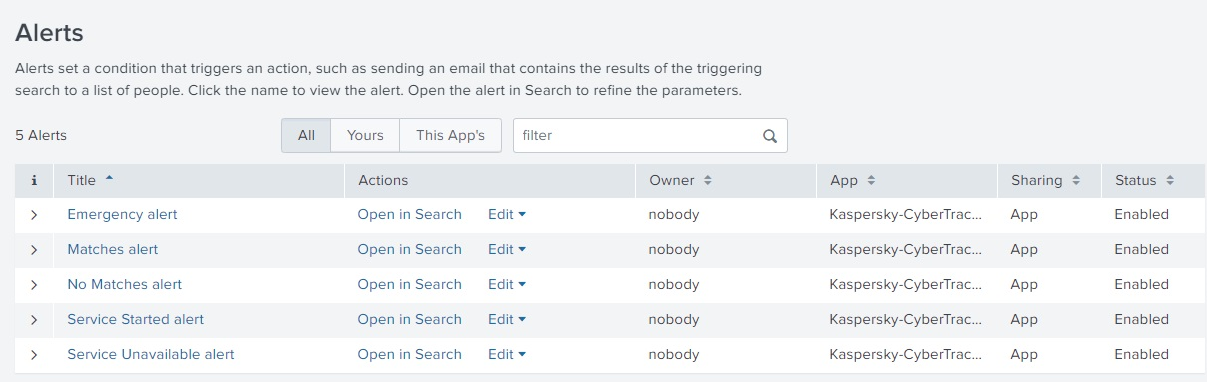
Kaspersky CyberTrace App comes with several alert templates that you can use and customize from the Alerts dashboard.
The following alert templates are available:
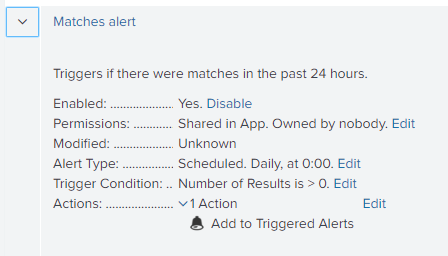
- Matches alert
This alert is triggered if there were matches with Kaspersky Threat Data Feeds in the past 24 hours.
- No Matches alert
This alert is triggered if there were no matches with Kaspersky Threat Data Feeds in the past 24 hours.
- Emergency alert
This alert is triggered if there were 5000 matches with Kaspersky Threat Data Feeds in the course of one minute.
- Service Unavailable alert
This alert is triggered if Feed Service is unavailable.
- Service Started alert
This alert is triggered when Feed Service is started.
Following are the default Kaspersky CyberTrace App settings:
- All of the alerts included in Kaspersky CyberTrace App are turned on.
To turn them off, use the Alerts dashboard.
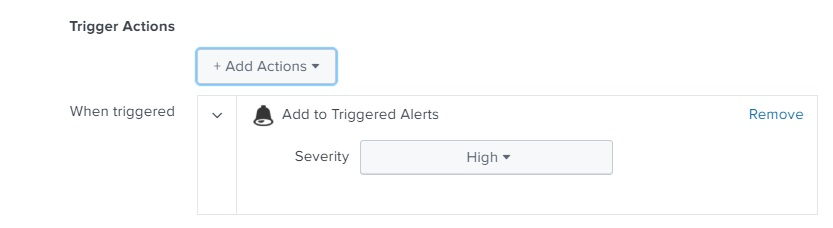
- The "Add to Triggered Alerts" action is defined for all alerts.
Splunk will display the alert in Triggered Alerts.
To enable email notifications for alerts:
- In Kaspersky CyberTrace App, open Alerts.
- Expand the parameters of an alert that you want to configure.
- Locate the Actions field, and then click Edit.
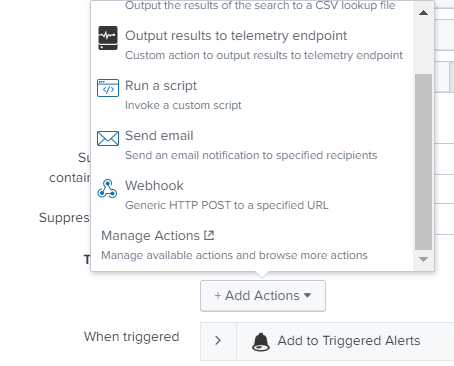
- Under Trigger Actions, click Add Actions.
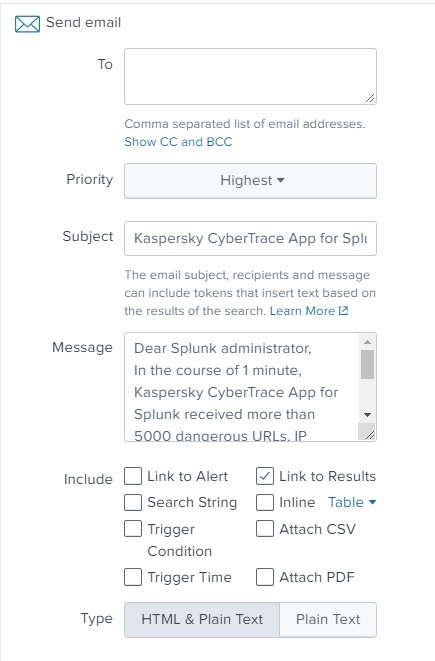
- From the list of options, select Send email.
- Enter the email message parameters and save the changes.
Step 3 (optional). Configuring the lookup script (single-instance deployment)
The lookup script is used to match individual URLs, IP addresses, and hashes to Kaspersky Threat Data Feeds. It can be invoked from the Indicators lookup tab in Kaspersky CyberTrace App.
To configure the lookup script:
- In Kaspersky CyberTrace App, go to the Indicators lookup tab.
- Specify Kaspersky CyberTrace connection strings:
- In the Kaspersky CyberTrace address field, specify the IP address of Kaspersky CyberTrace
- In the Kaspersky CyberTrace port field, specify the port that Kaspersky CyberTrace uses
The script is ready for use.
Page topStep 4. Performing the verification test (Splunk, single-instance integration)
This section explains how to check the capabilities of Kaspersky CyberTrace by performing the verification test.
Please make sure you perform the verification test before editing any matching process settings.
About the verification test
The verification test is a procedure that is used to check the capabilities of Kaspersky CyberTrace and to confirm the accuracy of the integration.
During this test you will check whether events from Splunk are received by Feed Service, whether events from Feed Service are received by Splunk, and whether events are correctly parsed by Feed Service using the regular expressions.
This section describes the verification scenario for the default integration scheme (in this scheme, the forwarder, indexer, and search head are installed on a single computer), but you can also use the verification test after changes were made to the configuration parameters to check that Kaspersky CyberTrace and the SIEM solution work correctly.
Verification test file
The %service_dir%/verification/kl_verification_test_cef.txt file is a verification test file. It contains a collection of events with URLs, IP addresses, and hashes.
Verification test scenario
To perform the verification test:
- Specify the Feed Service address in the Log Scanner utility configuration file.
- Send the verification file to Feed Service by using the Log Scanner utility.
If you run the Log Scanner utility, you cannot erase test data from the index.
- Compare the verification test results with the target numbers displayed on the Kaspersky CyberTrace Matches dashboard.
- Perform the Self-test.
The Self-test is an automatic feed test performed by Kaspersky CyberTrace App.
- Optionally, clear Splunk of events that arrived when the verification test was being performed.
Verification test scenario
The verification test scenario proceeds in stages:
Stage 1. Specifying the Feed Service address in the Log Scanner configuration file
Specify the address and port that Feed Service listens on in the Connection element of the Log Scanner configuration file.
Stage 2. Sending the verification file to Feed Service
You must send the verification file to Feed Service by using the Log Scanner utility.
Before you send the file, make sure that Feed Service is running.
The following commands send the contents of the kl_verification_test_cef.txt file to Feed Service:
- In Linux:
./log_scanner -p ../verification/kl_verification_test_cef.txt - In Windows:
log_scanner.exe -p ..\verification\kl_verification_test_cef.txt
After receiving data from Log Scanner, Feed Service sends the test results to Splunk. The address of Splunk is specified in the Service settings of Kaspersky CyberTrace. Also, this address is specified during the installation or reconfiguration of Kaspersky CyberTrace.
Stage 3. Checking the verification test results
In this step, you must verify that URLs, IP addresses, and hashes are processed correctly by Kaspersky CyberTrace App.
To check the verification test results:
- In Kaspersky CyberTrace App, on the navigation bar select Kaspersky CyberTrace Matches.
The Kaspersky CyberTrace Matches Dashboard opens.
- Compare numbers in the Matches by eventName panel to the numbers of the detected objects in the table shown below.
The verification test results depends on the feeds you use. The following table summarizes target numbers for the verification test when all commercial feeds are used.
Verification test results (commercial feeds)
Feed used
eventName value
Detected objects
Malicious URL Data Feed
KL_Malicious_URL
http://fakess123.nu
http://badb86360457963b90faac9ae17578ed.com
Phishing URL Data Feed
KL_Phishing_URL
http://fakess123ap.nu
http://e77716a952f640b42e4371759a661663.com
Botnet CnC URL Data Feed
KL_BotnetCnC_URL
http://fakess123bn.nu
http://a7396d61caffe18a4cffbb3b428c9b60.com
IP Reputation Data Feed
KL_IP_Reputation
192.0.2.0
192.0.2.3
Malicious Hash Data Feed
KL_Malicious_Hash_MD5
FEAF2058298C1E174C2B79AFFC7CF4DF
44D88612FEA8A8F36DE82E1278ABB02F
C912705B4BBB14EC7E78FA8B370532C9
Mobile Malicious Hash Data Feed
KL_Mobile_Malicious_Hash_MD5
60300A92E1D0A55C7FDD360EE40A9DC1
Mobile Botnet CnC URL Data Feed
KL_Mobile_BotnetCnC_Hash_MD5
001F6251169E6916C455495050A3FB8D
Mobile Botnet CnC URL Data Feed
KL_Mobile_BotnetCnC_URL
http://sdfed7233dsfg93acvbhl.su/steallallsms.php
Ransomware URL Data Feed
KL_Ransomware_URL
http://fakess123r.nu
http://fa7830b4811fbef1b187913665e6733c.com
Vulnerability Data Feed
KL_Vulnerable_File_Hash_MD5
D8C1F5B4AD32296649FF46027177C594
APT URL Data Feed
KL_APT_URL
http://b046f5b25458638f6705d53539c79f62.com
APT Hash Data Feed
KL_APT_Hash_MD5
7A2E65A0F70EE0615EC0CA34240CF082
APT IP Data Feed
KL_APT_IP
192.0.2.4
IoT URL Data Feed
KL_IoT_URL
http://e593461621ee0f9134c632d00bf108fd.com/.i
ICS Hash Data Feed
KL_ICS_Hash_MD5
7A8F30B40C6564EFF95E678F7C43346C
The following table summarizes target numbers for the verification test when only demo feeds are used.
Verification test results (demo feeds)
Feed used |
eventName value |
Detected objects |
DEMO Botnet_CnC_URL_Data_Feed |
KL_BotnetCnC_URL |
http://5a015004f9fc05290d87e86d69c4b237.com http://fakess123bn.nu |
DEMO IP_Reputation_Data_Feed |
KL_IP_Reputation |
192.0.2.1 192.0.2.3 |
DEMO Malicious_Hash_Data_Feed |
KL_Malicious_Hash_MD5 |
776735A8CA96DB15B422879DA599F474 FEAF2058298C1E174C2B79AFFC7CF4DF 44D88612FEA8A8F36DE82E1278ABB02F |
Stage 4. Performing the Self-test
The Self-test is an automatic feed test performed by Kaspersky CyberTrace App using the lookup script. You must verify that results of this test are correct.
To perform a Self-test:
- In Kaspersky CyberTrace App, on the navigation bar select Kaspersky CyberTrace Status.
The Kaspersky CyberTrace Status dashboard opens.
- For all the feeds that you use, check the
statusvalues in the Self-test panel:- If you use only demo feeds, the value for demo feeds must be
OKand values for all other feeds must beFALSE. - If you use commercial feeds, the value for all feeds that you use must be
OK. All other values including values for demo feeds must beFALSE.
- If you use only demo feeds, the value for demo feeds must be
The following figure shows an example of a Self-test results for commercial feeds. In this example, all commercial feeds are used, and demo feeds are not used. The value for demo feeds is FALSE, as expected.
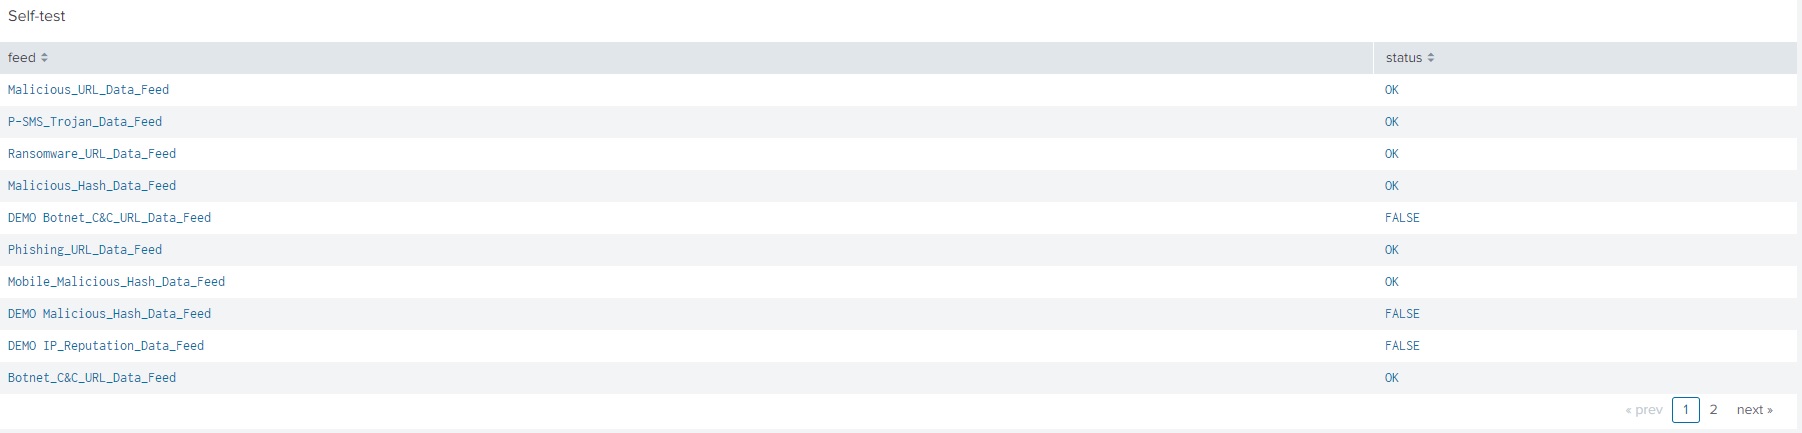
Self-test results
Stage 5 (optional). Clearing Splunk of events received when the verification test was performed
To clear Splunk of events received from Kaspersky CyberTrace when the verification test was performed:
- On the Search dashboard of the Splunk GUI, click the Search & Reporting button to run the Search & Reporting app.
- Delete the events from Kaspersky CyberTrace:
- In the Search field, type the following command:
index="main" sourcetype="kl_cybertrace_events" | delete - Click the All time split button next to the Search field.
If the split button has another name, click it and in the drop-down list select All time.
- Click Search (
 ).
).

Search & Reporting app
- In the Search field, type the following command:
Distributed integration scheme (Splunk)
This section contains instructions for integrating Kaspersky CyberTrace and Splunk in the distributed integration scheme.
For a description of the integration process, see Integration guide (Splunk).
For a description of distributed integration scheme, see About the distributed integration scheme.
About the distributed integration scheme
Kaspersky CyberTrace supports distributed Splunk environments. The integration scheme for distributed Splunk environments is called the distributed integration scheme.
About the apps and services used in the distributed integration scheme
In the distributed integration scheme, Kaspersky CyberTrace is divided into two apps and one service:
- Feed Service
This service matches Splunk events against Kaspersky Threat Data Feeds.
Feed Service sends the resulting events to a single indexer that keeps the index with events from Kaspersky CyberTrace.
This service can be installed on a separate computer.
- Kaspersky CyberTrace App Search Head (or Search Head App)
This app contains Kaspersky CyberTrace App dashboards, alert templates, and the lookup script.
This app is intended for installation on a Splunk instance that acts as a search head and sends search requests to the indexer that keeps the index with events from Kaspersky CyberTrace.
- Kaspersky CyberTrace App Forwarder (or Forwarder App)
This app contains rules for forwarding events from Splunk to Feed Service. It also receives events from Feed Service.
This app is intended for installation on Splunk instances that must forward events to Feed Service.
About the integration scheme variants
The following variants of the distributed integration scheme demonstrate a general approach to integrating Kaspersky CyberTrace with your distributed Splunk environment. Depending on how your distributed Splunk environment is organized, you may have to change or combine these variants.
One indexer, multiple forwarders variant
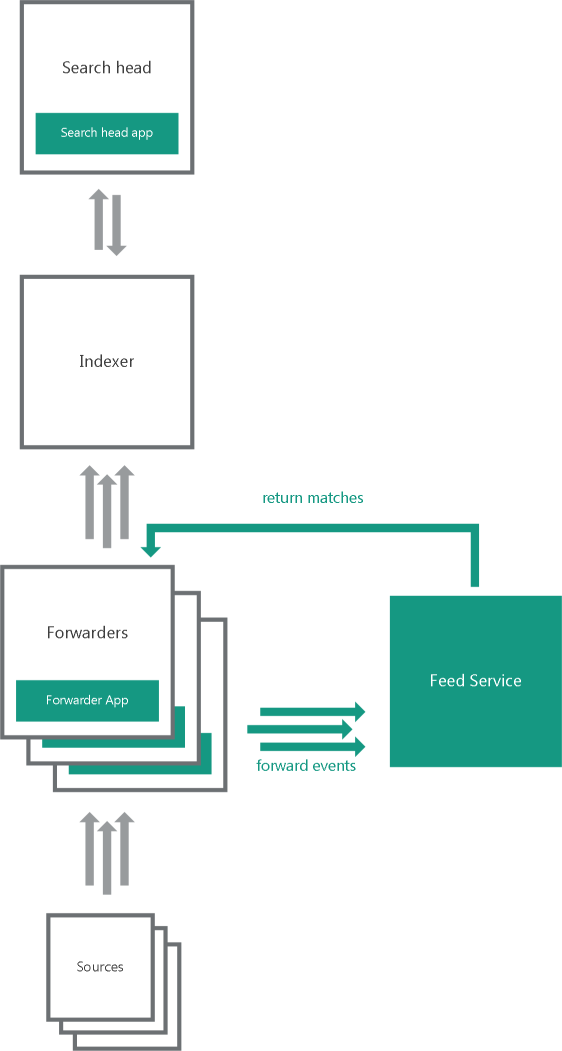
One indexer, multiple forwarders
In the one indexer, multiple forwarders variant, several heavy forwarders parse and send events directly to Feed Service. These forwarders must use Forwarder App. One of the forwarders receives matches from Feed Service. The forwarders send the matches to the indexers that store them in the index used by Kaspersky CyberTrace for Splunk Search Head App.
Multiple indexers, multiple forwarders variant
In the multiple indexers, multiple forwarders variant, several heavy forwarders parse and send events directly to Feed Service. These forwarders must use Forwarder App. One of the forwarders receives matches from Feed Service. The forwarders send the matches to the indexers that store them in the index used by Kaspersky CyberTrace App.
Default ports and addresses
By default, Forwarder App and Feed Service are configured to use certain addresses and ports for forwarding events and receiving matches. You must change these addresses and ports based on the organization of your distributed Splunk environment.
You must change the default addresses and ports that are used by Forwarder App and Feed Service.
By default, Forwarder App:
- Receives events at
:3000port. - Receives events from Kaspersky CyberTrace at
:9998port. These events are stored in themainindex. - Forwards events to
127.0.0.1:9999.
By default, Feed Service does the following:
- Receives events at
127.0.0.1:9999. - Sends its own events to
127.0.0.1:9998.
Event format
By default, Kaspersky CyberTrace App and Feed Service are configured to receive events in a certain format:
- Feed Service parses events with regular expressions defined in its configuration file (the regular expressions are also displayed in Kaspersky CyberTrace Web). These regular expressions are created for a specific format of inbound data. For example, the default regular expression for URLs will match a URL containing the protocol (for example, HTTP, HTTPS). If the URLs in the events generated by your devices do not contain the procotol, change the regular expression accordingly.
- The lookup script that comes with Kaspersky CyberTrace App (or Search Head App in the case of the distributed integration scheme) sends events to Feed Service in a format that matches the regular expressions used by Feed Service.
Step 1. Installing Forwarder and Search Head apps
In the distributed deployment scheme, you must install Forwarder App and Search Head App on the basis of the organization of your distributed Splunk environment. For more information about how to choose the computers where the apps must be installed, see the section about the distributed integration scheme.
Forwarder App is installed from the %service_dir%/integration/splunk/Kaspersky-CyberTrace-App-for-Splunk_Forwarder.tar.gz file. Search Head App is installed from the %service_dir%/integration/splunk/Kaspersky-CyberTrace-App-for-Splunk_Search-Head.tar.gz file.
Installing the apps
Forwarder App and Search Head App are installed from Splunk Web. The only difference in the installation process is the application file name.
To install Forwarder App or Search Head App:
- Open Splunk Web for the Splunk instance where you want to install the app.
- In Splunk Web, go to the home page.
- On the home page, click the Manage Apps button.
Manage Apps button
- On the Apps page, click the Install app from file button.
Install app from file button
- In the Upload an app window, click Choose File and select the application file mentioned above in this section.
Choose File button
- In the Upload an app window, click the Upload button.
Upload button
- In the Restart required window, click the Restart Splunk button.
This step can be skipped, depending on the Splunk version. If Splunk does not display the Restart required window, skip this step.
Restart Splunk button
- When Splunk starts again, the Forwarder App will be displayed in the list of installed apps. When Kaspersky Search Head App is installed, the Apps page will open with information about the successful installation of Kaspersky Search Head App. Kaspersky Search Head App will appear in the list of apps on the Splunk home page.
Kaspersky Search Head App for Splunk in the list of apps
Step 2. Configuring Forwarder and Search Head apps (distributed deployment)
In the distributed deployment scheme, you must configure Forwarder App on the basis of the organization of your distributed Splunk environment. For example, the configuration changes may include changing the Feed Service address used by the apps, or adding new event sources for Forwarder App. For Search Head App, you may have to configure the email addresses for alerts.
Configuration actions for Forwarder App and Search Head App
For Forwarder App, you may have to do the following:
- Change the address and port for forwarding events to Feed Service. See subsection "Changing the address and port for forwarding data to Feed Service" below.
- Configure Forwarder App to send events to the Indexer (or multiple Indexers). By default, events that are sent from Forwarder App to Feed Service are not registered in the indexes. See subsection "Configuring Forwarder App to send events to indexes" below.
- If several Forwarder Apps are used, only one Forwarder App must receive events from Kaspersky CyberTrace at port
9998. For all other Forwarder Apps, disable this rule by specifyingtruein thedisabledparameter for this rule in the Forwarder App configuration file. The IP address and port of the Forwarder App that will receive events from Kaspersky CyberTrace must be specified on the Settings > Service tab in Kaspersky CyberTrace Web. - Add new event sources. See subsection "Adding new event sources" below.
For Search Head App, you may have to do the following:
- Add email addresses to alert templates. See "Adding email addresses to alert templates" below.
Restart Splunk after you make changes to the configuration files.
Edit only those Forwarder App and Search Head App configuration files that are described in this section. Editing other configuration files may result in unpredictable behavior.
Configuration files (distributed deployment)
The following table summarizes configuration files used by Forwarder App and Search Head App in the following distributed deployment scheme variants:
- One indexer, multiple forwarders
- Multiple indexers, multiple forwarders
Configuration files of Forwarder App and Search Head App
Application
Configuration file
Default rules
Forwarder App
\default\inputs.confReceives data from sources at port
3000and forwards it as configured inoutputs.conf.Receives events from Kaspersky CyberTrace at
:9998port.Forwarder App
\default\outputs.confForwards data to
127.0.0.1:9999(Feed Service address).Forwarder App
\default\props.confParse data received at
:3000. For a description of default data parsing rules, see "Default data parsing rules" below.Search Head App
\default\savedsearches.confRules for alert templates.
Default data parsing rules
The way in which Forwarder App parses incoming data is defined in the props.conf file. By default, Forwarder App does the following:
- Defines how time stamps are extracted from incoming data.
- Defines a delimiter (line breaker) between events for incoming data.
For example, if the incoming data has the sequence
"%data_1%\n\n%data_2%"and the line breaker is one or more\nsymbols, Splunk splits this sequence into two events (%data_1%and%data_2%).
The following are the default rules used by Forwarder App to parse incoming data.
TIME_PREFIX = ^ MAX_TIMESTAMP_LOOKAHEAD = 17 TIME_FORMAT = %b %d %H:%M:%S LINE_BREAKER = ([\n]+) SHOULD_LINEMERGE = false |
Changing the address and port for forwarding data to Feed Service
By default, Forwarder App is configured to forward data to Feed Service at 127.0.0.1:9999.
To change the address and port for forwarding data to Feed Service,
In the outputs.conf configuration file, in the [tcpout:service9999] section, specify the new address and port for the server parameter that will be used by Feed Service.
In the following example, 192.0.2.100:9999 is specified as the Feed Service address.
[tcpout:service9999] disabled=false server = 192.0.2.100:9999 sendCookedData = false |
Adding new event sources
To add new event sources, edit the inputs.conf and props.conf configuration files of the app.
To add a new event source:
- In inputs.conf, specify a new event source that uses the
service9999TCP routing rule.All data from this input will be forwarded to Feed Service.
- In props.conf, specify how data from this source must be processed.
- Restart Splunk.
Make sure that data from the new event source matches the regular expressions used by Kaspersky CyberTrace.
Below is an example of adding the address :3001 as the event source; it specifies that data from the address :3001 must be processed as other input data in the default integration scheme (in this scheme, the forwarder, indexer, and search head are installed on a single computer).
# to inputs.conf [tcp://:3001] _TCP_ROUTING = service9999
# to props.conf [source::tcp:3001] TIME_PREFIX = ^ MAX_TIMESTAMP_LOOKAHEAD = 17 TIME_FORMAT = %b %d %H:%M:%S LINE_BREAKER = ([\n]+) SHOULD_LINEMERGE = false |
If Splunk Forwarder is already configured for receiving events from different event sources and you want to send events to Feed Service, perform the following procedure. This can be done if the server field of the outputs.conf configuration file of Forwarder App contains the IP address and port that are specified in the InputSettings > ConnectionString element of the Feed Service configuration file.
To forward events to Feed Service:
- In the outputs.conf file that is used for forwarding events from Splunk (it can be either the outputs.conf file of a custom Splunk application or the
%SPLUNK_DIR%/etc/system/local/inputs.conffile), in thedefaultGroupfield, add a comma and a stringservice9999.In this case, check the event forwarding logic and make sure that events that arrived from Feed Service are not sent again to Feed Service by Splunk.
If the inputs.conf configuratioin file contains the
_TCP_ROUTINGparameter for those event sources, the events from which are sent to Feed Service, add a comma and theservice9999string to the_TCP_ROUTINGparameter. - Restart Splunk.
Configuring Forwarder App to send events to indexes
By default, events that are sent from Forwarder App to Feed Service are not registered in the indexes. You can change this behavior by configuring Forwarder App.
To configure Forwarder App to send events to the main index:
- Locate the Forwarder that you want to configure. This Forwarder is typically a machine with Forwarder App installed. You must configure all Forwarders that are used in your distributed integration scheme.
- On the Forwarder, in the
%SPLUNK_HOME%\etc\system\local\outputs.conffile, locate the name of the target group that is used for sending events to the Indexer (or multiple Indexers). Here%SPLUNK_HOME%is the Splunk installation directory.By default, the name of this group is default-autogroup-lb:
[tcpout: default-autogroup-lb] - In the
inputs.conffile used by the Forwarder App, locate the section withservice9999TCP routing rule:_TCP_ROUTING = service9999 - Add the name of the target group to this rule.
For example, if the name of the target group is default-autogroup-lb, the rule must be changed in the following way:
_TCP_ROUTING=service9999, default-autogroup-lb - Restart Splunk on the Forwarder.
Configuring alert templates
For more information about configuring alert templates, see "Configuring alert templates" in Step 2 (optional). Configuring Kaspersky CyberTrace App.
Page topStep 3 (optional). Configuring the lookup script (distributed deployment)
The lookup script is used to match individual URLs, IP addresses, and hashes to Kaspersky Threat Data Feeds. It can be invoked from the Indicators lookup tab in Kaspersky CyberTrace App for Search Head.
To configure the lookup script:
- In Kaspersky CyberTrace App, go to the Indicators lookup tab.
- Specify Kaspersky CyberTrace connection strings:
- In the Kaspersky CyberTrace address field, specify the IP address of Kaspersky CyberTrace
- In the Kaspersky CyberTrace port field, specify the port that Kaspersky CyberTrace uses
The script is ready for use.
Page topStep 4. Performing the verification test (Splunk, distributed integration)
The verification test for the distributed integration of Kaspersky CyberTrace with Splunk is performed in the same way as the verification test for the single-instance integration.
Page top