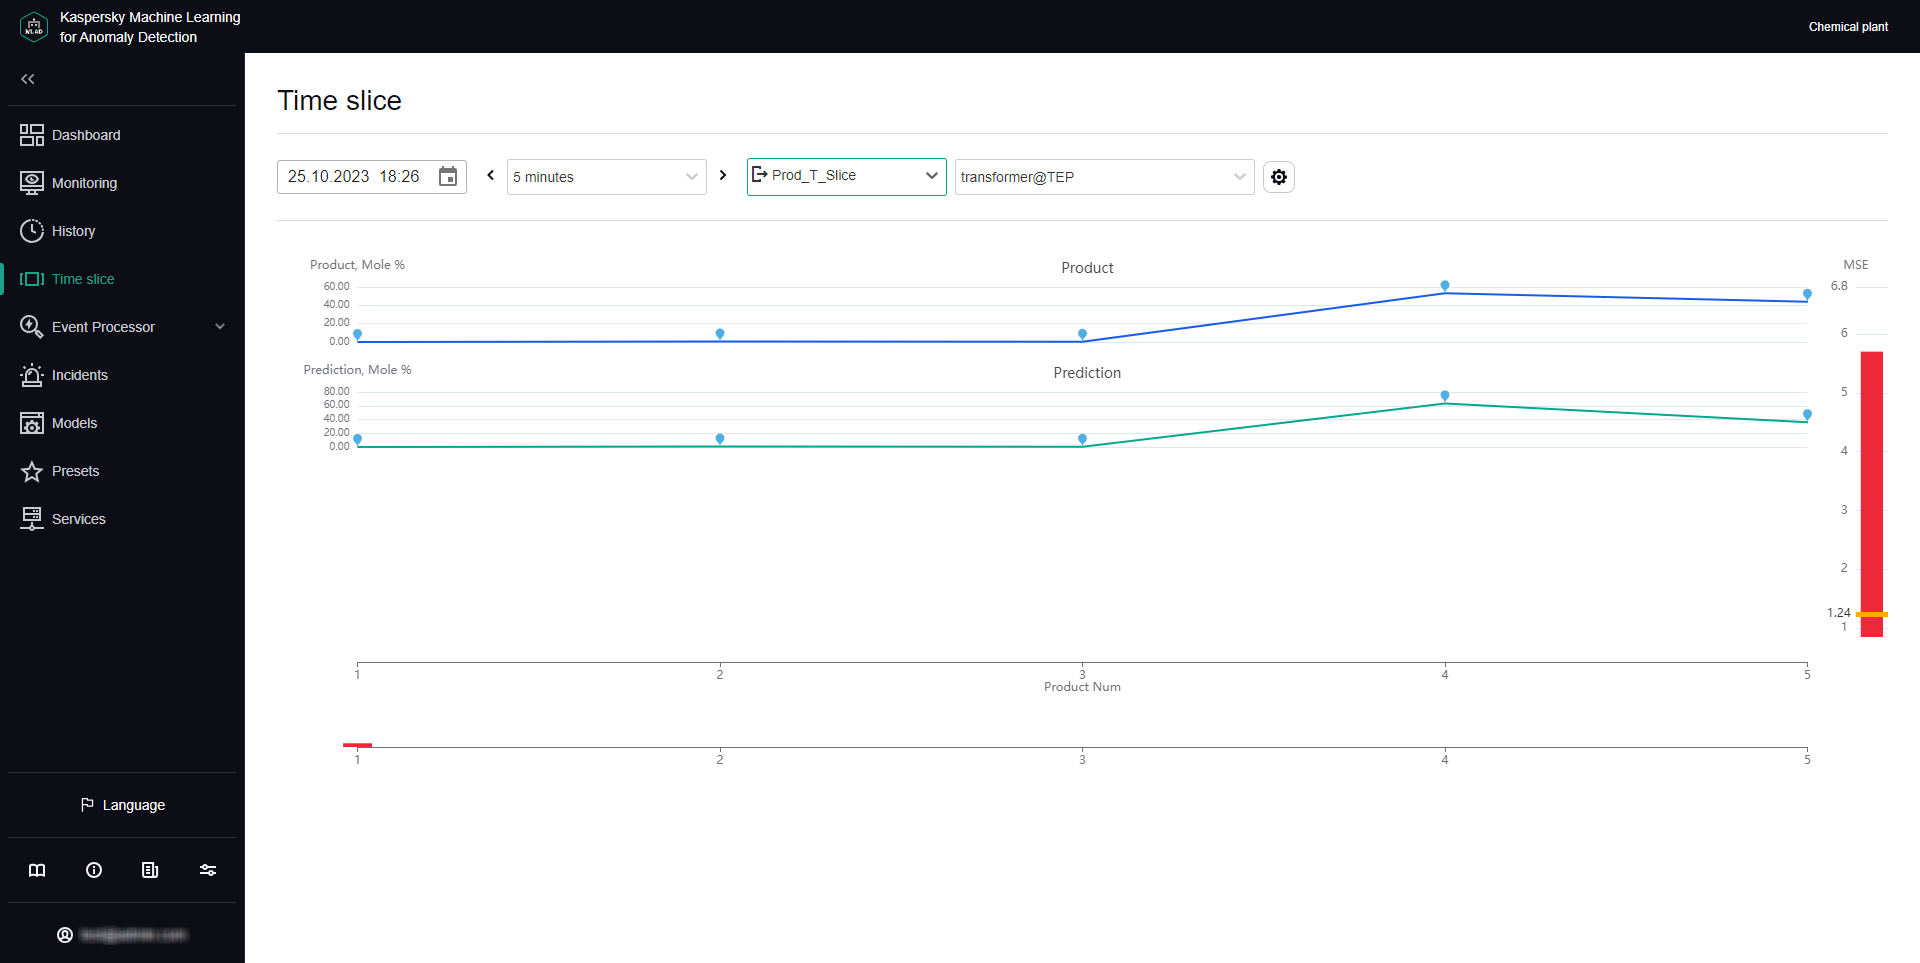
Viewing data in the Time slice section
In the Time slice section, you can view the values of process parameters received from sensors of the monitored asset at the same point in time. The sensors must be of the same type (have the same dimension) and must be positioned linearly, like pressure sensors in an oil pipeline, for example.
Data is presented in the form of graphs that allow you to see whether an incident was detected at the selected time and where the likely source of the incident is located.
The lower part of the page contains a section displaying the individual errors of tags. The data is presented as a bar graph. The error value for each tag is displayed when the mouse cursor hovers over the relevant column. The MSE graph is located on the right of the preset tag graphs.
In the Time slice section, you can use the drop-down list to select a preset and the date and time when data was received. This list includes special presets that can be created in the Presets section. A special preset should contain only tags of the same type that have defined x-axis coordinates. You can additionally specify expressions dynamically calculated for each tag based on actual and predicted tag values, individual prediction errors, and tag coordinate values and constants defined in expressions.
You can also customize the display of graphs, select a time interval for viewing data, and select a specific element of the ML model to view the personal errors of preset tags obtained as a result of data processing by the selected element of the ML model.

Time slice section