Contents
- Integration with QRadar
- Integration steps (QRadar)
- Standard integration (QRadar)
- About the standard integration scheme (QRadar)
- Step 1. Configuring QRadar to receive latest updates
- Step 2. Sending a set of events to QRadar
- Step 3. Forwarding events from QRadar to Feed Service
- Step 4. Performing the verification test (QRadar)
- Step 5. Retrieving custom event properties
- Step 6. Creating a search filter for CyberTrace events
- Step 7 (optional). Displaying events in a dashboard
- Step 8 (optional). Creating notifications about incoming service events
- Step 9 (optional). Installing Kaspersky Threat Feed App
- Step 10 (optional). Enabling the indexes of the added custom event properties
- Step 11 (optional). Configuring Kaspersky Threat Feed App
Integration with QRadar
This chapter describes how to integrate Kaspersky CyberTrace with QRadar.
Integration steps (QRadar)
This chapter describes how to integrate Kaspersky CyberTrace with QRadar.
About the integration schemes
Kaspersky CyberTrace can be integrated with QRadar in two integration schemes:
- Standard integration
Use this scenario if it is possible to get QRadar updates. For more information about the standard integration scheme, see About the standard integration scheme (QRadar).
- Integration when QRadar cannot get updates
This is an additional scenario for a case when it is not possible to get QRadar updates. The procedure is outlined in Integration with QRadar when QRadar cannot get updates.
How to integrate Kaspersky CyberTrace with QRadar
Make sure that you have installed Kaspersky CyberTrace (see Part 1: Installing Kaspersky CyberTrace).
To integrate Kaspersky CyberTrace with QRadar in the standard integration scenario:
- Step 1. Configure QRadar to receive latest updates.
- Step 2. Send a set of events to QRadar so that QRadar will automatically add new log sources.
- Step 3. Forward events from QRadar to Feed Service.
- Step 4. Perform the verification test.
Please make sure you perform the verification test before editing any matching process settings.
- Step 5. Configure QRadar to retrieve custom event properties.
- Step 6. Configure QRadar to create a search filter for CyberTrace events.
- Step 7 (optional). Configure QRadar to display events in a dashboard.
After you have successfully integrated Kaspersky CyberTrace with QRadar, install Kaspersky Threat Feed App:
- Step 8 (optional). Configure QRadar to notify about incoming service events.
- Step 9 (optional). Install Kaspersky Threat Feed App.
- Step 10 (optional). Enable the indexes of the added custom event properties.
- Step 11 (optional). Configure Kaspersky Threat Feed App.
Standard integration (QRadar)
This section contains instructions for integrating Kaspersky CyberTrace with QRadar in the standard integration scheme.
About the standard integration scheme (QRadar)
This section describes the standard integration scheme for QRadar and Kaspersky CyberTrace.
For the standard integration scheme to work properly, you must install the update DSM-KasperskyCyberTrace-%version%-20180802144954.noarch.rpm, where %version% is the version of QRadar. Usually, you receive these updates as part of the auto-update process, but you can also visit IBM Fix Central and download them manually.
About the components of the standard integration scheme
The following components are used in the standard integration scheme for QRadar:
- Feed Service
This service matches QRadar events against Kaspersky Threat Data Feeds.
- QRadar
The SIEM solution used in this integration.
- Security controls
These are sources of events for QRadar such as firewalls, proxies, intrusion detection systems, and other networking devices.
Security controls can send events to QRadar by any method supported by QRadar.
Standard integration scheme
In the standard integration scheme, Feed Service by default is configured to listen for incoming events from QRadar on 0.0.0.0:9999 (аll interfaces).
Feed Service sends detection events to port 514 of the interface defined in QRadar configuration. The address of this interface is specified when you install Kaspersky CyberTrace.
Security controls can send events to QRadar in any format that is supported by QRadar, for example, Syslog, JDBC, OPSEC, File, or SNMP.
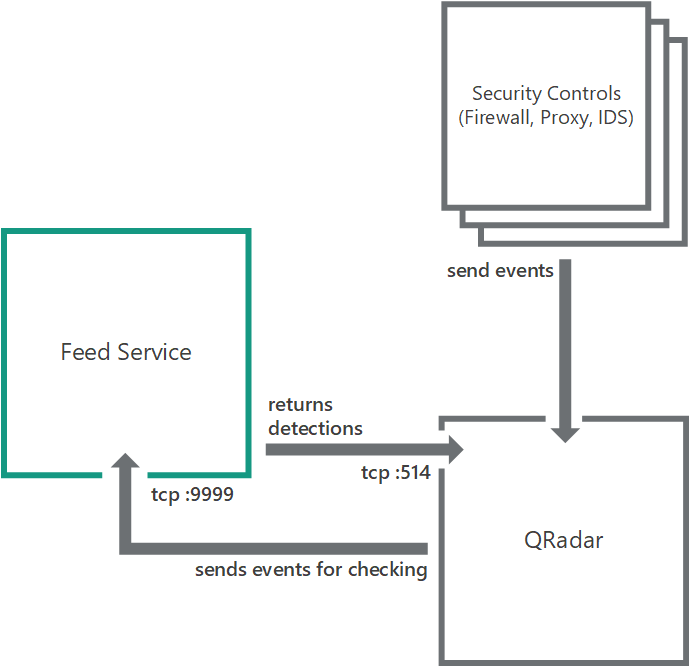
Standard integration scheme for QRadar
Page topStep 1. Configuring QRadar to receive latest updates
This section describes how you can receive the latest updates of QRadar.
To configure QRadar for getting latest updates:
- In QRadar Console, select Admin > Auto-Update.
The Update Configuration form opens.
- On the Basic tab, in the Configuration Updates section, select Auto Integrate in the Update Type drop-down list.
- In the DSM, Scanner, Protocol Updates section, select the Auto Install update type.
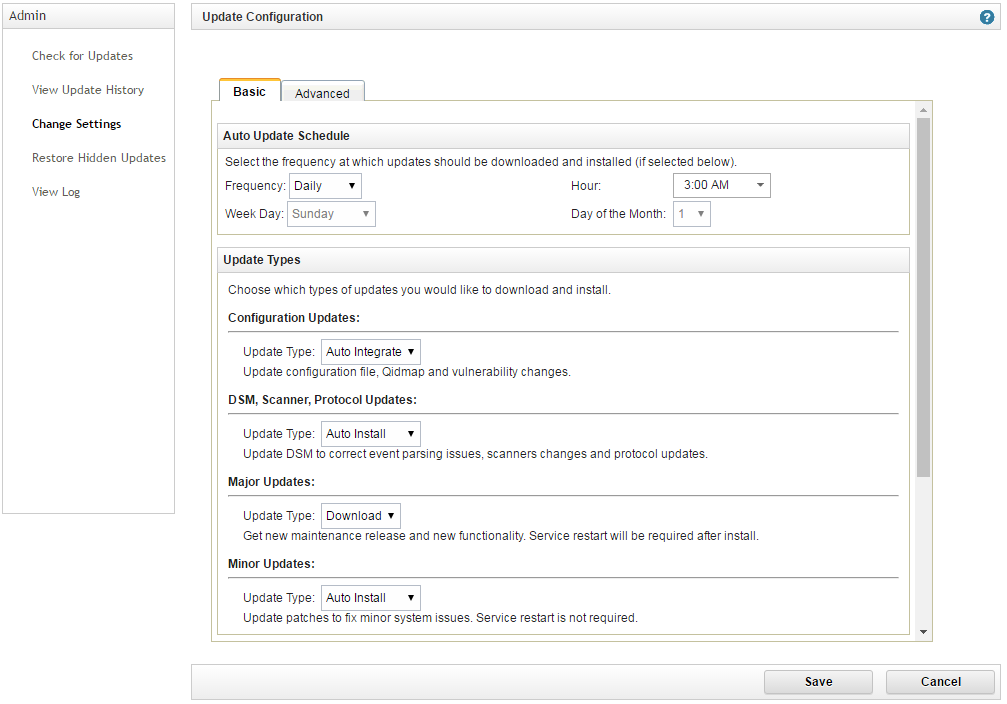
Update configuration
- Click Save.
- Wait for installation of the updates.
- In QRadar Console, select Admin > Log Sources > Add.
The Add a log source form opens.
- Make sure that Kaspersky CyberTrace appears in the Log Source Type drop-down list.
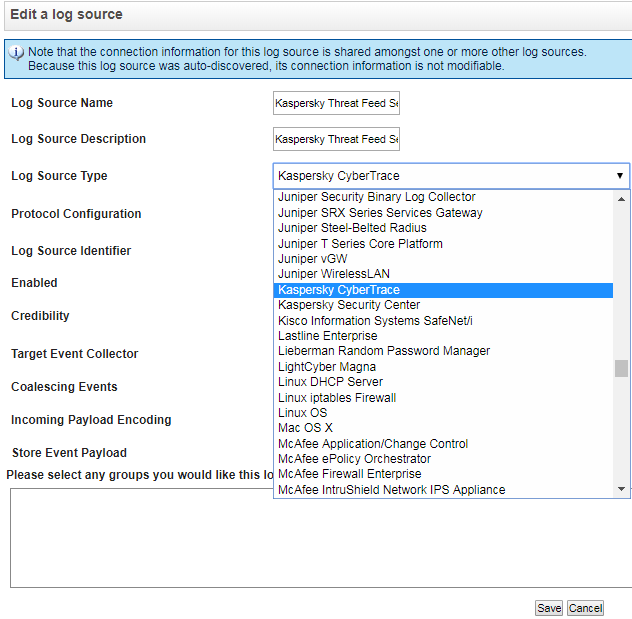
Kaspersky CyberTrace log source type
As an alternative to auto-updating QRadar, you can visit IBM Fix Central to manually download and install the DSM package that is specified in section "About the standard integration scheme (QRadar)", and then configure QRadar, as described in section "Integration with QRadar when QRadar cannot get updates".
Page topStep 2. Sending a set of events to QRadar
On this step, you must send two sets of events to QRadar so that QRadar will automatically add two new log sources—one for verification and the other for events from Feed Service.
To add new log sources:
- Send the verification test log file.
Send the
verification/kl_verification_test_leef.txtfile to QRadar, as described in the procedure in subsection "Sending a set of events" below.After you send the verification test file, QRadar will contain the
KL_Verification_Toollog source. - Send the sample log file.
For testing and final adjustments of integration with QRadar, send the
integration/qradar/sample_initiallog.txtsample log file to QRadar, as described in the procedure in subsection "Sending a set of events" below.After you send the sample log file, QRadar will contain the
KL_Feed_Service_v2log source.Up to 25 events can be missed after a new log source is added, according to the QRadar documentation. So you may have to send sample_initiallog.txt several times. This ensures that some events will be displayed by QRadar and handled by Feed Service.
Sending a set of events
To send events to QRadar:
- In the
Connectionelement of the Log Scanner configuration file, specify the IPv4 address and port of your QRadar server (usually it is514). - Invoke the following command from the Log Scanner directory.
In Linux:
./log_scanner -p <log_file> [-p <log_file2> ...]In Windows:
log_scanner.exe -p <log_file> [-p <log_file2> ...]<log_file>,<log_file2>are log files to send. Alternatively, you can specify a directory containing log files to send. - In QRadar Console (which is the web interface for QRadar), select Admin > Log Sources.
A new log source of the
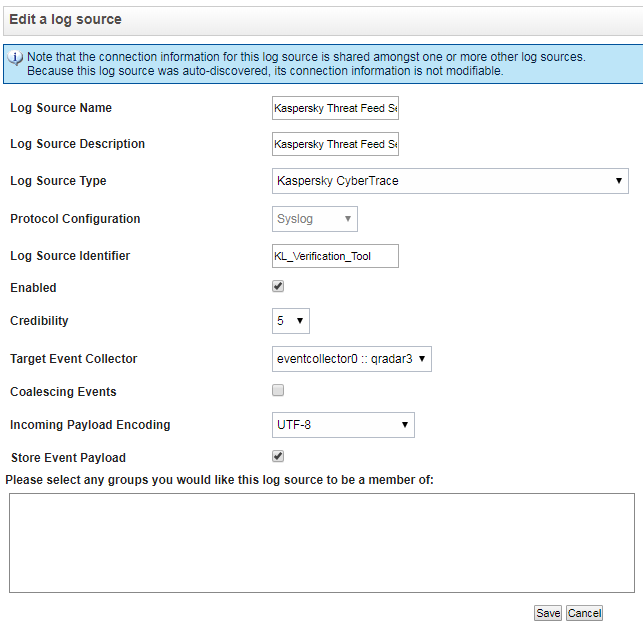
Kaspersky CyberTracetype appears in the log sources list. - In the settings form of the new log source, clear the Coalescing Events check box and click Save.
Editing a log source
- If necessary, deploy the changes by selecting the Admin > Deploy Changes menu item in QRadar Console.
Step 3. Forwarding events from QRadar to Feed Service
To check events that arrive in QRadar by way of Feed Service, you must configure QRadar to forward the events to Feed Service.
To forward events from QRadar to Feed Service:
- Select Admin > System Configuration > Forwarding Destinations > Add.
- In the Forwarding Destination Properties window, type the identifier of the destination (for example,
"KL_Threat_Feed_Service_v2"). - Type the destination address (the host where Feed Service runs).
- Select
Payloadas the events format andTCPas the protocol.The
Payloadformat can contain less information, in comparison with theJSONformat. For example, if event source names are used, QRadar may remove them from the event. You can specify theJSONformat instead, but make sure to configure it properly. For the instructions on how to configure events in theJSONformat to forward to Kaspersky CyberTrace, see subection "Recommendations on configuring events in JSON format" below. - Set the port according to the parameters for inbound events of Kaspersky CyberTrace. You can see this information on the Settings >Service tab of Kaspersky CyberTrace Web.
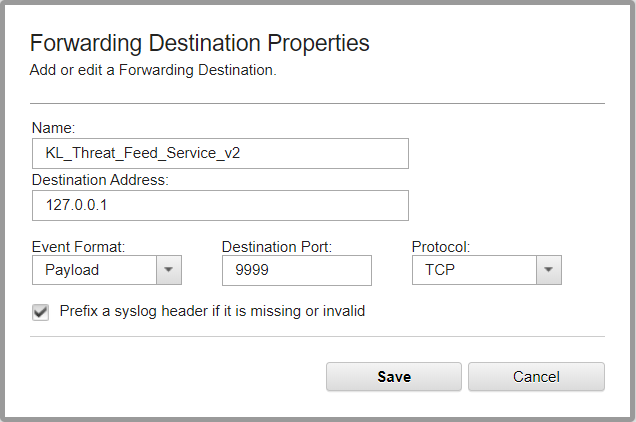
Adding a forwarding destination
- Click Save.
- Select Admin > Routing rules > Add.
- In the Routing Rule window, type the rule name (for example,
KL_Threat_Feed_Service_v2_Rule). - Select
Onlineas the mode. - Leave the default value in the Forwarding Event Collector drop-down list.
- Select
Eventsas the data source. - In the Event Filters group, set the event filter.
Choose the log sources together with
KL_Verification_Tool, and use theEquals any ofoperator in the filter. Also, to achieve maximum performance of the service, you are advised to select only those events that contain indicators to look up in the feeds (such as URLs, hashes (MD5, SHA1, SHA256), and IP addresses).Clear the Match all incoming events check box or leave it cleared so that the detection events received from Feed Service will not be sent back to Feed Service.
- Select the Forward check box. In the table, next to the Name column, select the check box next to the item added in step 1 (in this case, it is
KL_Threat_Feed_Service_v2).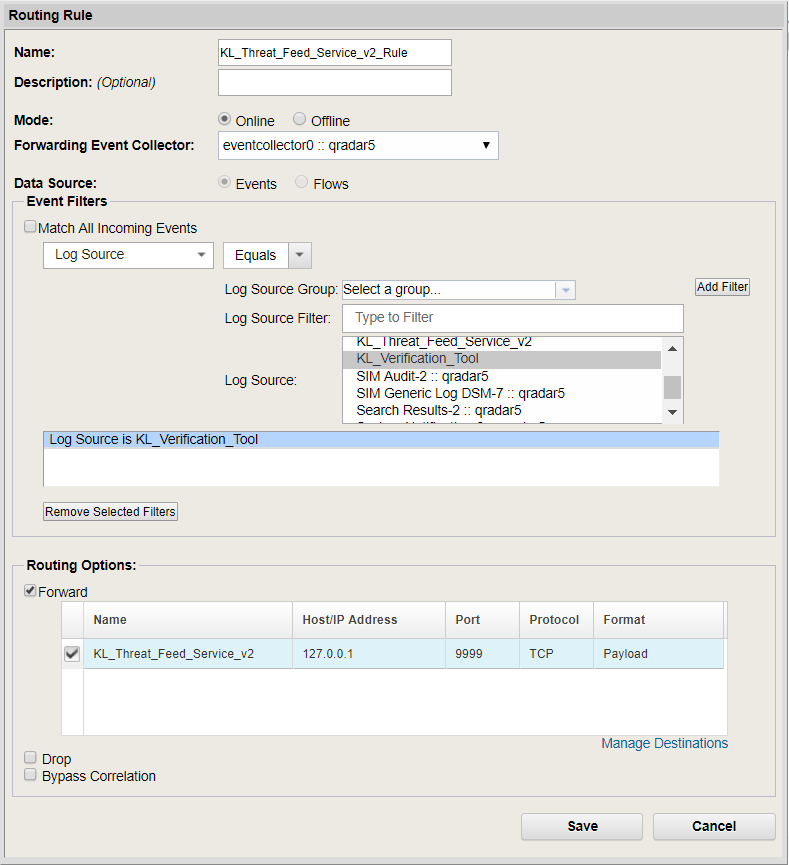
Adding a routing rule
- Click Save.
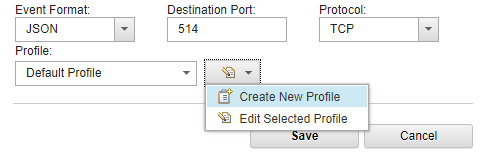
Recommendations for configuring events in the JSON format
A number of QRadar versions (such as, 7.3.2 Patch 6 and 7.4.0) can drop some forwarded events in the JSON format, which may lead to incorrect results. To prevent this, we recommend that you exclude some fields from the event in JSON (for an exact list of such fields, contact IBM's QRadar Support team or try to determine this list manually). You must specify additional normalizing rules in Kaspersky CyberTrace Web (see below).
Therefore, use the JSON format instead of the Payload format if the event in the Payload format does not contain the necessary fields. In this case, make sure that the following conditions are met:
- In the Forwarding Destination Properties window, only fields that you need are selected. QRadar does not drop forwarded events. To enable or disable fields that will be forwarded within an event, open the Forwarding Profile Properties window by clicking the button near the Profile field.
Configuring events in JSON format
- On the Settings > Matching tab of Kaspersky CyberTrace Web, the following normalizing rules are specified:
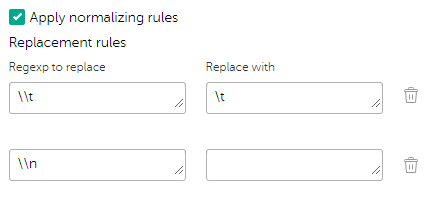
Configuring additional normalizing rules
Step 4. Performing the verification test (QRadar)
This section explains how to check the capabilities of Kaspersky CyberTrace by performing the verification test.
Please make sure you perform the verification test before editing any matching process settings.
What is the verification test
The verification test is a procedure that is used to check the capabilities of Kaspersky CyberTrace and to confirm the accuracy of the integration.
During this test you will check whether events from QRadar are received by Feed Service, whether events from Feed Service are received by QRadar, and whether events are correctly parsed by Feed Service using the regular expressions.
About the verification test file
The verification test file is a file that contains a collection of events with URLs, IP addresses, and hashes. This file is located in the ./verification directory in the distribution kit. The name of this file is kl_verification_test_leef.txt.
Verification procedure
To verify the installation:
- Make sure that the
"KL_Verification_Tool"log source is added to QRadar and routing rules are set in such a way that events from"KL_Verification_Tool"are sent to Feed Service. - Open QRadar Console and select the Log Activity tab.
- Add a filter:
- Click the Add Filter button.
- In the Parameter drop-down list, select
Log Source. - In the Operator drop-down list, select
Equals. - In the Value group, in the Log Source drop-down list select the required service name.
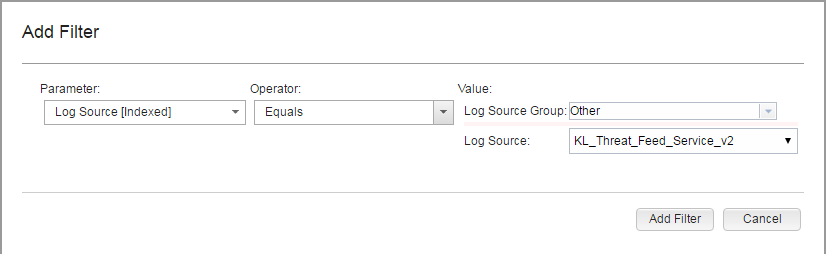
Adding a filter for browsing events
- Click the Add Filter button.
The
Log Source is KL_Threat_Feed_Service_v2string will be displayed under Current Filters. - In the View drop-down list, select
Real Timeto clear the event area.You now can browse information about the service events.
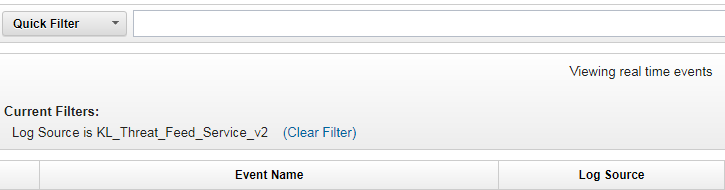
Browsing filtered information
- Send the
kl_verification_test_leef.txtfile to QRadar by using Log Scanner, by running the following command:For Linux:
./log_scanner -p ../verification/kl_verification_test_leef.txtFor Windows:
log_scanner.exe -p ..\verification\kl_verification_test_leef.txtIf you specify the
-rflag in this command, the test results are written to the Log Scanner report file. If you do not specify the-rflag, the test results are sent to the SIEM solution by using the settings for outbound events specified for Feed Service.The expected results to be displayed by QRadar depend on the feeds you use. The verification test results are listed in the following table.
Verification test results
Feed used
Detected objects
Malicious URL Data Feed
http://fakess123.nu
http://badb86360457963b90faac9ae17578ed.com
Phishing URL Data Feed
http://fakess123ap.nu
http://e77716a952f640b42e4371759a661663.com
Botnet CnC URL Data Feed
http://fakess123bn.nu
http://a7396d61caffe18a4cffbb3b428c9b60.com
IP Reputation Data Feed
192.0.2.0
192.0.2.3
Malicious Hash Data Feed
FEAF2058298C1E174C2B79AFFC7CF4DF
44D88612FEA8A8F36DE82E1278ABB02F (stands for EICAR Standard Anti-Virus Test File)
C912705B4BBB14EC7E78FA8B370532C9
Mobile Malicious Hash Data Feed
60300A92E1D0A55C7FDD360EE40A9DC1
Mobile Botnet CnC URL Data Feed
001F6251169E6916C455495050A3FB8D (MD5 hash)
http://sdfed7233dsfg93acvbhl.su/steallallsms.php (URL mask)
Ransomware URL Data Feed
http://fakess123r.nu
http://fa7830b4811fbef1b187913665e6733c.com
Vulnerability Data Feed
D8C1F5B4AD32296649FF46027177C594
APT URL Data Feed
http://b046f5b25458638f6705d53539c79f62.com
APT Hash Data Feed
7A2E65A0F70EE0615EC0CA34240CF082
APT IP Data Feed
192.0.2.4
IoT URL Data Feed
http://e593461621ee0f9134c632d00bf108fd.com/.i
Demo Botnet CnC URL Data Feed
http://5a015004f9fc05290d87e86d69c4b237.com
http://fakess123bn.nu
Demo IP Reputation Data Feed
192.0.2.1
192.0.2.3
Demo Malicious Hash Data Feed
776735A8CA96DB15B422879DA599F474
FEAF2058298C1E174C2B79AFFC7CF4DF
44D88612FEA8A8F36DE82E1278ABB02F
ICS Hash Data Feed
7A8F30B40C6564EFF95E678F7C43346C
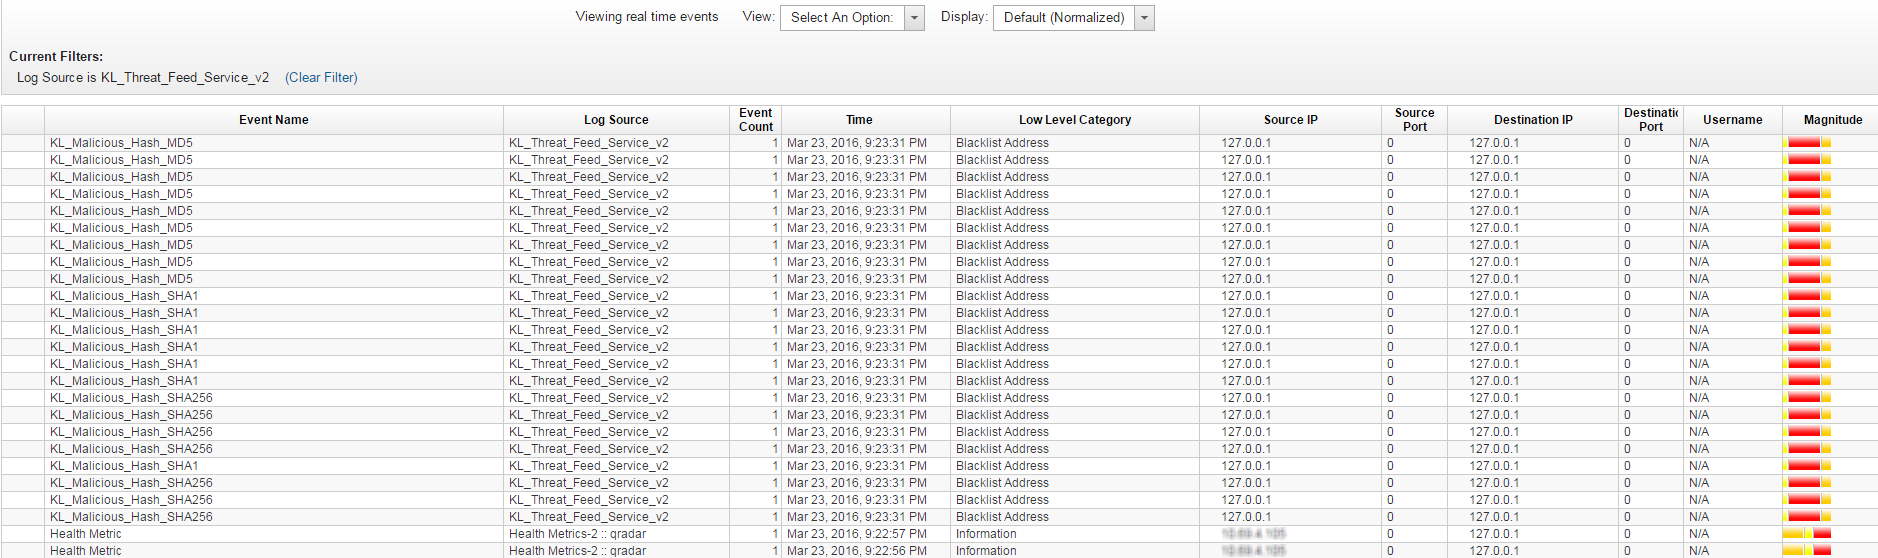
Browsing events from Feed Service
If the actual results of the test are the same as those expected, the integration of Feed Service with QRadar is correct.
Page topStep 5. Retrieving custom event properties
This section describes how to configure retrieval of custom event properties from Kaspersky CyberTrace outgoing events, in addition to standard fields. As a result of this setting, the MD5, SHA1, and SHA256 hashes will be extracted and the extraction rule of the Source IP field will be redefined.
To configure retrieval of custom event properties:
- Select the Log Activity tab, and then click Add Filter.
The Add Filter form opens.
- Fill in the form:
- In the Parameter drop-down list, select
Log Source [Indexed]. - In the Operator drop-down list, select
Equals. - In the Log Source list, select
KL_Threat_Feed_Service_v2.The selection
KL_Threat_Feed_Service_v2is the log source name that is set in theOutputSettings > EventFormatelement and theOutputSettings > AlertFormatelement of the Feed Service configuration file (you can also set them by using Kaspersky CyberTrace Web).
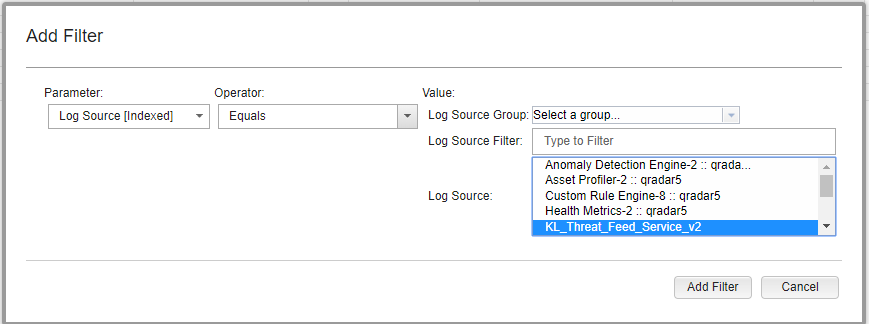
Adding a filter
- In the Parameter drop-down list, select
- Click Add Filter.
- Run the verification test, and then stop the events flow by clicking Pause (
 ) in the upper-right area of the window.
 - Press Ctrl (or Shift) to select several records, and then select Actions > DSM editor.
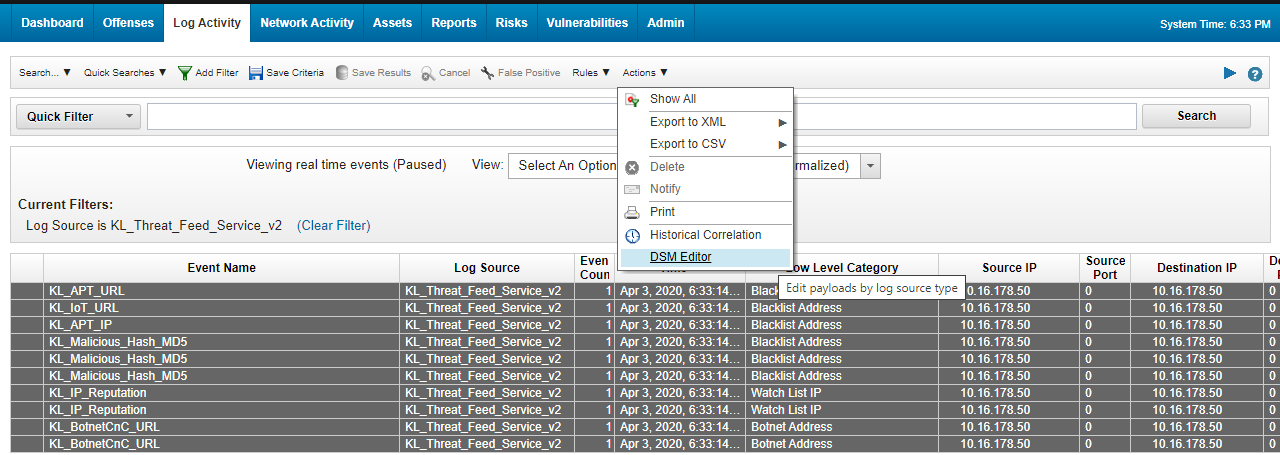
The Log Activity window
The DSM Editor window opens.
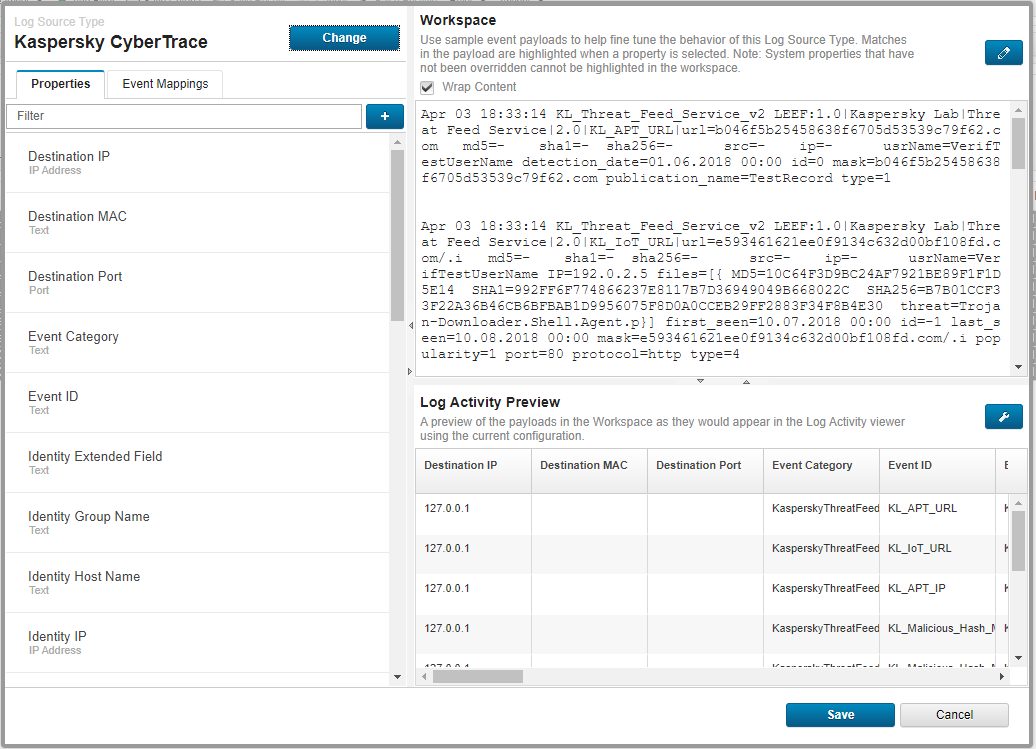
The DSM Editor window
- In the DSM Editor window, click the + button near the Filters text box.
The Choose a Custom Property Definition to Express form opens.
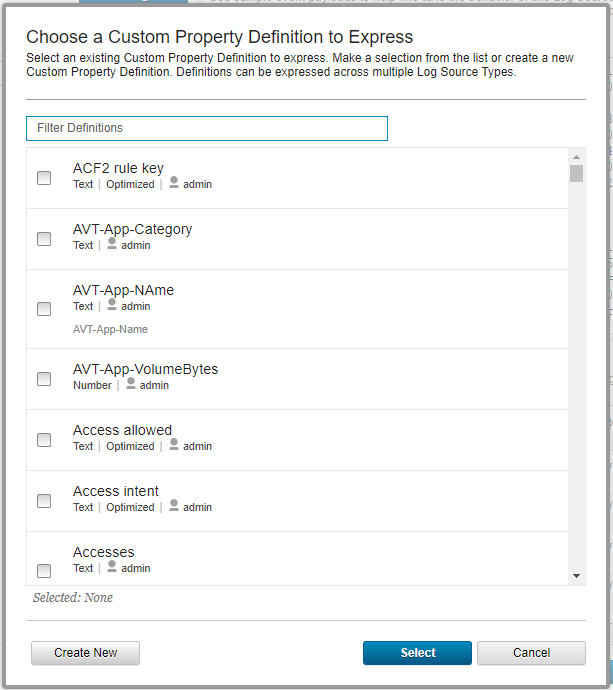
Choosing a custom property
- Click Create new.
The Create a new Custom Property Definition form opens.
- Fill in the form:
- In the Name field, enter
MD5. - In the Field Type drop-down list, select
Text. - In the Description field, enter a description of the property.
- Select the Enable this Property for Use in Rules and Search Indexing checkbox.
- Click Save.
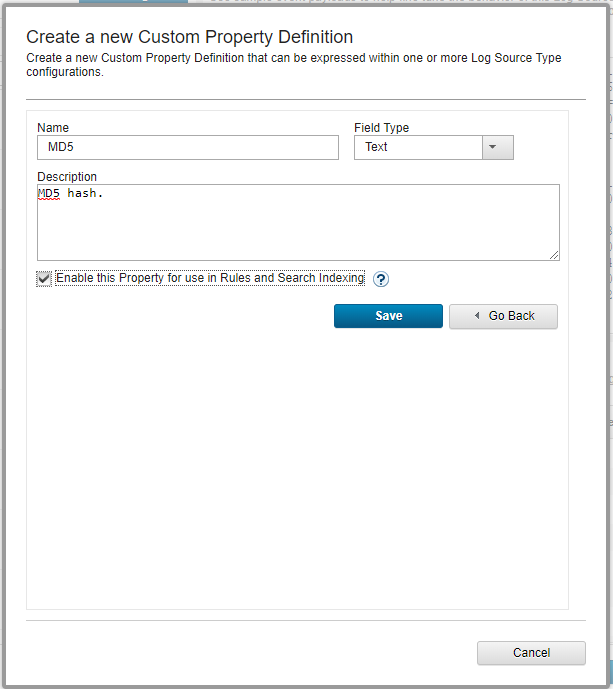
Creating a new custom property definition
- In the Name field, enter
- Add the
SHA1andSHA256properties similarly. - In the Choose a Custom Property Definition to Express window, select the created properties, add URL and Source IP, and then click Select.
- In the Log Activity Preview section, click Configure and then select the following properties:
Event NameIP (custom)MD5 (custom)SHA1 (custom)SHA256 (custom)Source IPURL (custom)Username
Click Update.
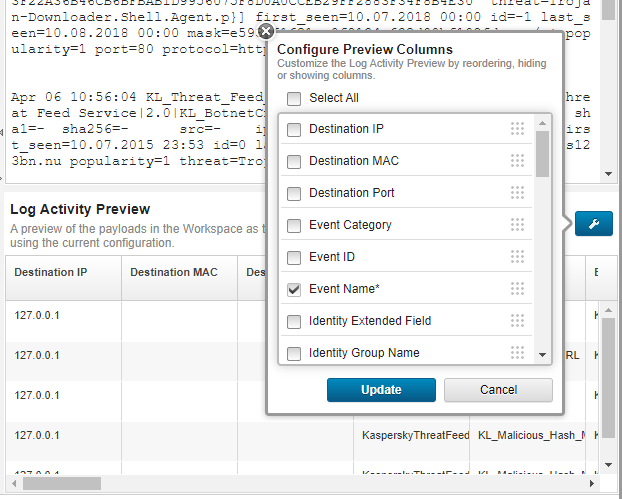
Configuring preview columns
- On the Properties tab, configure regular expressions as described in the table below:
Custom property
Regular expression
MD5
md5=([\da-fA-F]{32})SHA1
sha1=([\da-fA-F]{40})SHA256
sha256=([\da-fA-F]{64})URL
url=([-a-zA-Z0-9()@:%_\+.~#?&\/\/=]{2,})Source IP
src=(\d{1,3}\.\d{1,3}\.\d{1,3}\.\d{1,3})If necessary, type
1in the Capture Group field. - For the Source IP property, select the Override system behavior checkbox.
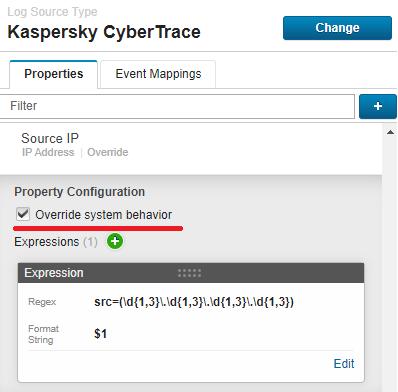
Source IP configuration
When changing the format for outgoing detection events in Kaspersky CyberTrace, the regular expressions that are specified above may require corresponding changes.
If all of the settings above are specified correctly, you will find the configured Custom properties in the Log Activity Preview section.
- Click Save and close the window.
- On the Log Activity tab, perform the new verification test.
After that, if you open the event received from
KL_Threat_Feed_Service_v2, the configured custom properties will be displayed.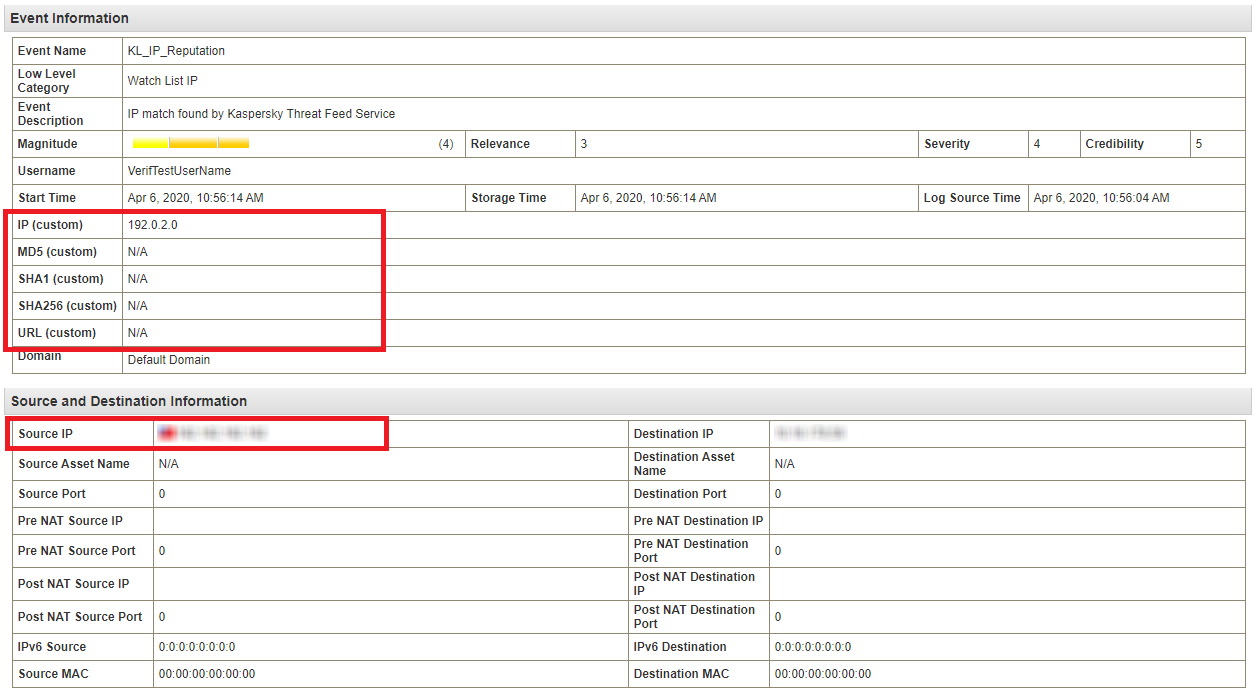
Event information
Step 6. Creating a search filter for CyberTrace events
This section describes how to create an event search.
To create an event search:
- Stop the events flow by clicking Pause () in the upper-right area of the window.
- In QRadar Console, select the Log Activity tab.
- Select Search > New Search.
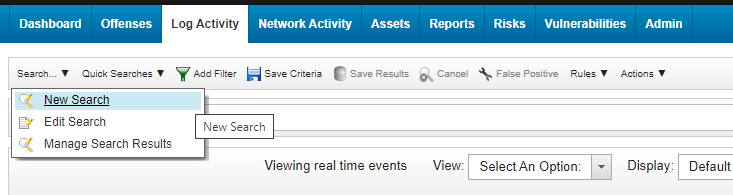
New search
- In the Column Definition form, add
MD5 (custom),SHA1 (custom),SHA256 (custom),URL (custom),IP (custom)from the Available Columns to the Columns list.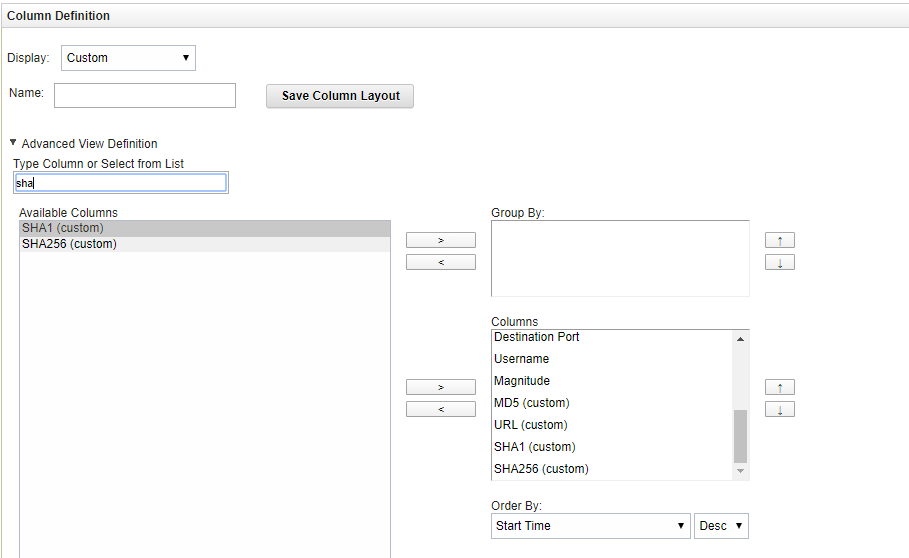
Defining columns
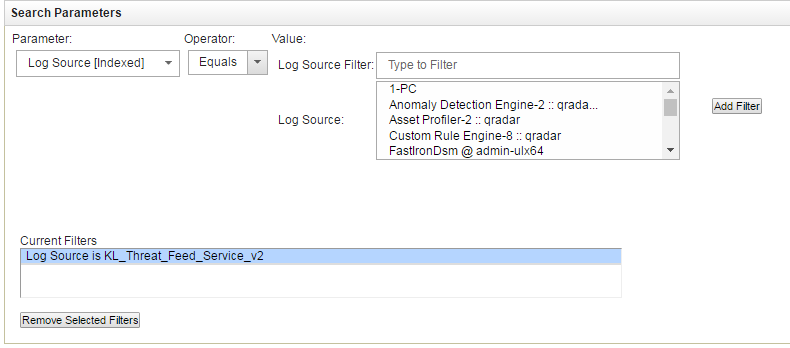
- Scroll down the page and in the Search Parameters form, set
KL_Threat_Feed_Service_v2as the log source:- In the Parameter drop-down list, select
Log Source [Indexed]. - In the Operator drop-down list, select
Equals. - In the Log Source list, select
KL_Threat_Feed_Service_v2.The selection
KL_Threat_Feed_Service_v2is the log source name that is set in theOutputSettings > EventFormatelement and theOutputSettings > AlertFormatelement of the Feed Service configuration file (you can also set them by using Kaspersky CyberTrace Web). - Click the Add Filter button.
The
Log Source is KL_Threat_Feed_Service_v2string will be added to the Current Filters list.
Setting the log source
- In the Parameter drop-down list, select
- Click either the Search button to display the search result.
- Click the Save Criteria button.

Save Criteria button
- In the Save Criteria form, type the name of the search in the Search Name text box, select the Include in my Quick Searches checkbox and then specify the analyzed interval for created search (for example, Real Time).
- Click OK.
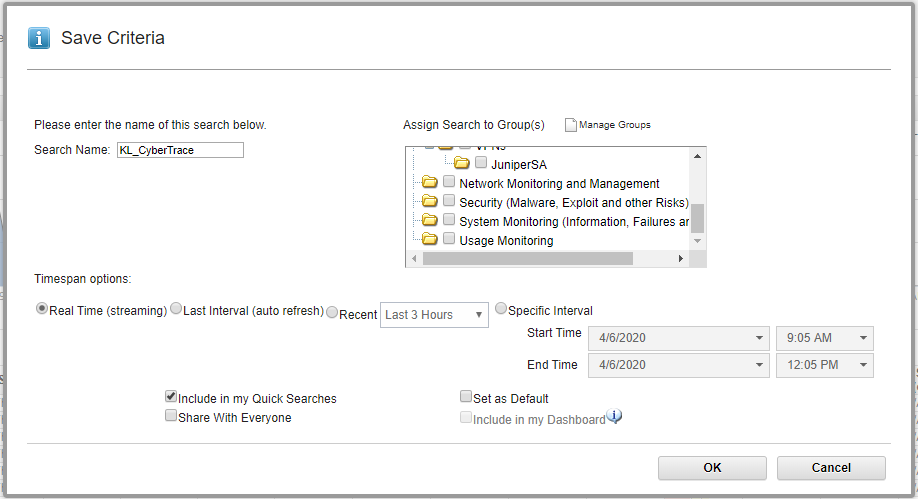
Saving criteria
Step 7 (optional). Displaying events in a dashboard
A QRadar dashboard presents detection results in visual format. For example, a chart displays the ratio of the number of events of different types.
QRadar 7.2.6 Patch 3 or later is required. Using an earlier version can lead to incorrect results.
Adding a chart that displays the detection results of Feed Service in visual format involves three procedures:
- Create an event search.
- Add a chart to a dashboard.
- Adjust the added chart.
Creating an event search
The following procedure describes how to create an event search.
To create an event search:
- In QRadar Console, select the Log Activity tab.
- Select Search > New Search.
- In the Column Definition form, delete
Event Namefrom the Available Columns list and addEvent Nameto the Group By list.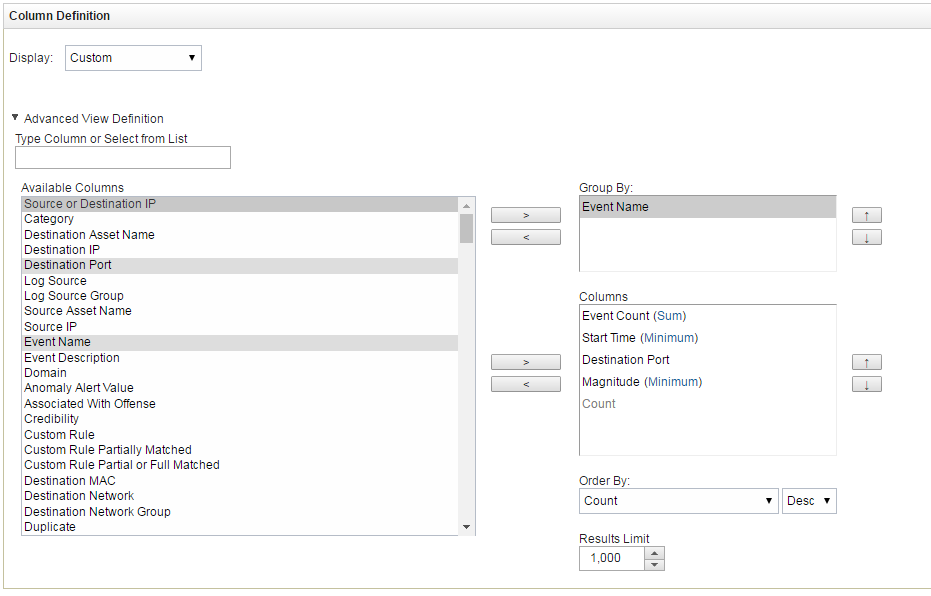
Defining columns
- Scroll down the page and in the Search Parameters form, set
KL_Threat_Feed_Service_v2as the log source:- In the Parameter drop-down list, select
Log Source [Indexed]. - In the Operator drop-down list, select
Equals. - In the Log Source list, select
KL_Threat_Feed_Service_v2.The selection
KL_Threat_Feed_Service_v2is the log source name that is set in the detection events format and alert events format parameters on the Events format tab of Kaspersky CyberTrace Web. - Click the Add Filter button.
The
Log Source is KL_Threat_Feed_Service_v2string will be added to the Current Filters list.
Setting the log source
- In the Parameter drop-down list, select
- Click either the Filter button or the Save button to display the search result.
- Click the Save Criteria button.
Save Criteria button
- In the Save Criteria form, select the Include in my Dashboard check box, type the name of the search in the Search Name text box, and then click OK.
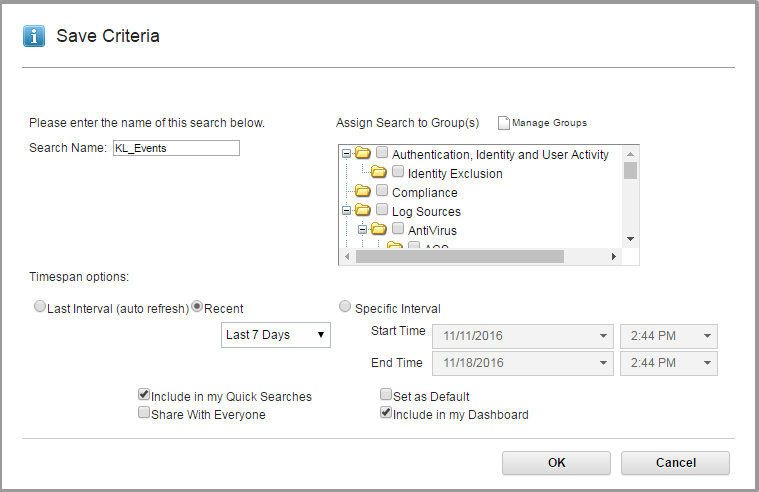
Saving criteria
Adding a diagram to a dashboard
The following procedure describes how to add a diagram to a dashboard.
To add a diagram to a dashboard:
- In QRadar Console, select the Dashboard tab.
- Select Add Item > Log Activity > Event Searches > KL_Events.
Here,
KL_Eventsis the name of the search that you set.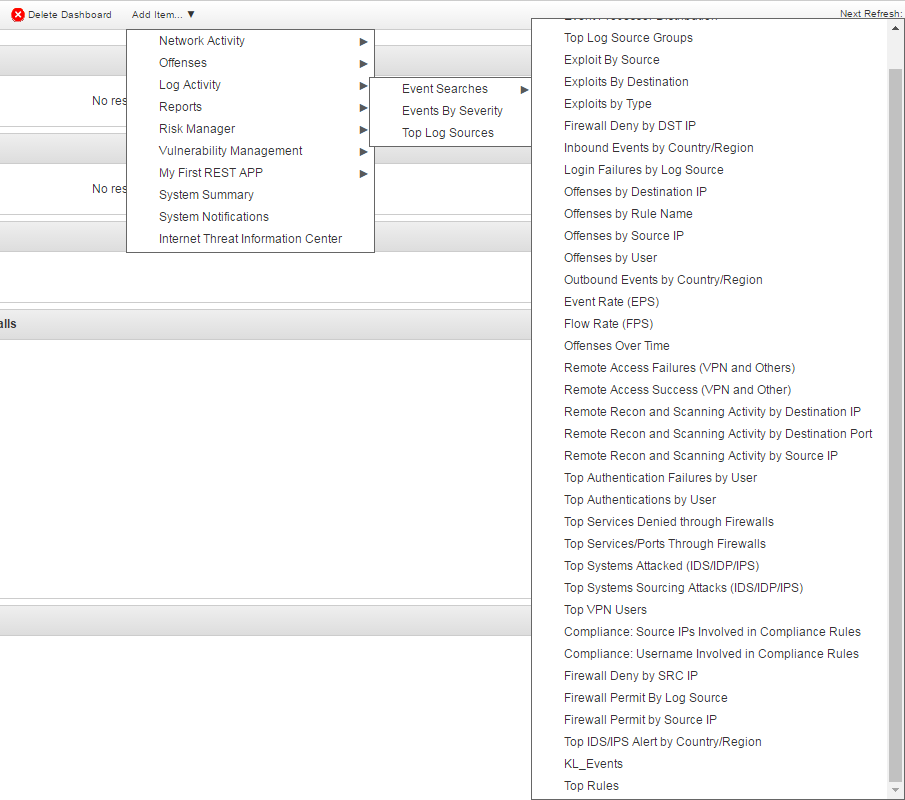
Adding an item to the dashboard
A chart will appear on the dashboard.
New chart
Adjusting the added chart
The following procedure describes how to adjust the chart that has been added to the dashboard.
To adjust the added chart:
- Click the Settings button (
 ) in the upper-right corner of the chart box.
 - Specify the settings of the chart.
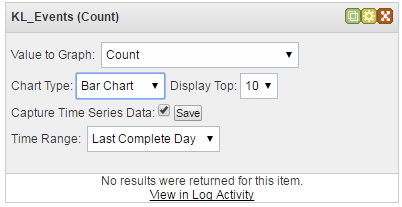
Chart settings
If you select the Capture Time Series Data check box, the chart will display all incoming data received after this check box is selected; the item selected in the Time Range drop-down list will be ignored. If you clear the Capture Time Series Data check box, only the information received during the time range selected in the Time Range drop-down box will be displayed.
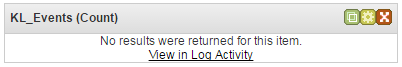
After events arrive, the chart displays them.
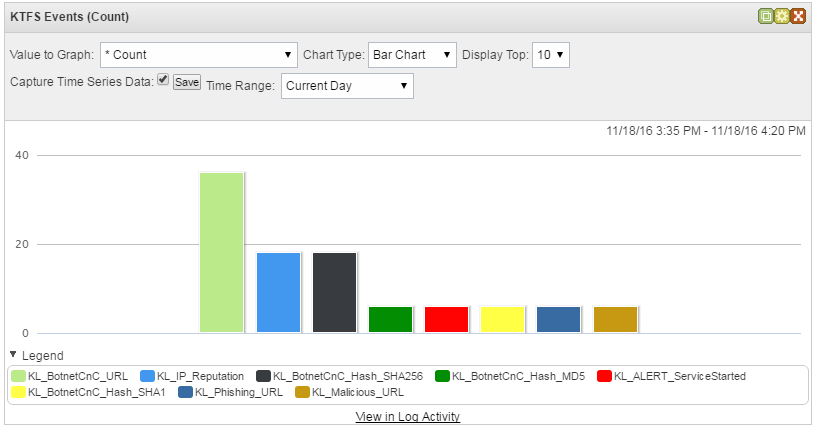
Bar chart
In the Chart Type drop-down list you can select the type of chart in which the data will be displayed.
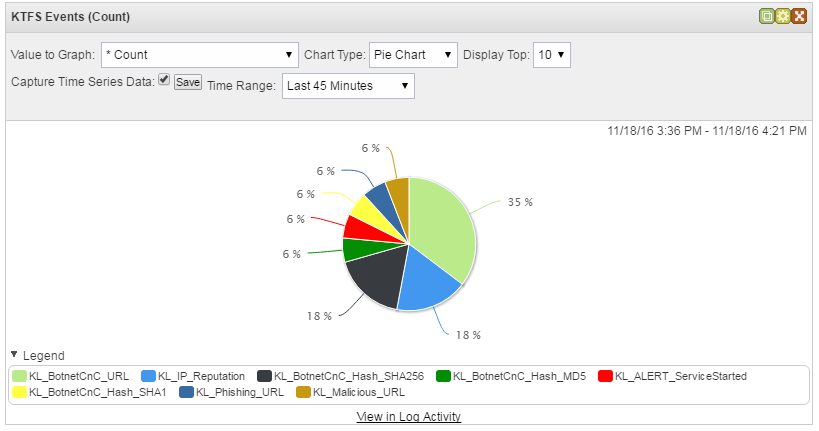
Pie chart
You can also get information about charts, which are based on the search results, from QRadar Help (section "Dashboard management" > "Adding search-based dashboard items to the Add Items list").
Page topStep 8 (optional). Creating notifications about incoming service events
You can create notifications about issues with Kaspersky CyberTrace by configuring alert rules.
To create notifications about service events from Kaspersky CyberTrace in QRadar:
- Run QRadar Console.
- Select any of the Offenses, Log Activity or Network Activity tabs, and then select Rules.
- In the Actions drop-down list, select New Event Rule.
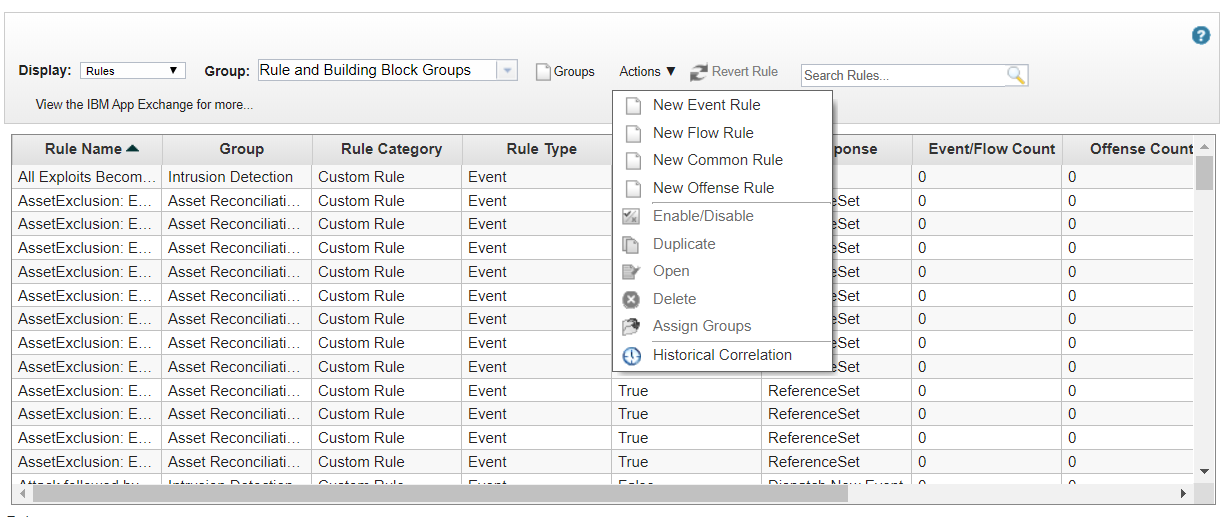
The Rules page
The Rule Wizard page opens.
- On the Rule Wizard page, click Next to select the source from which you want the rule to be generated.
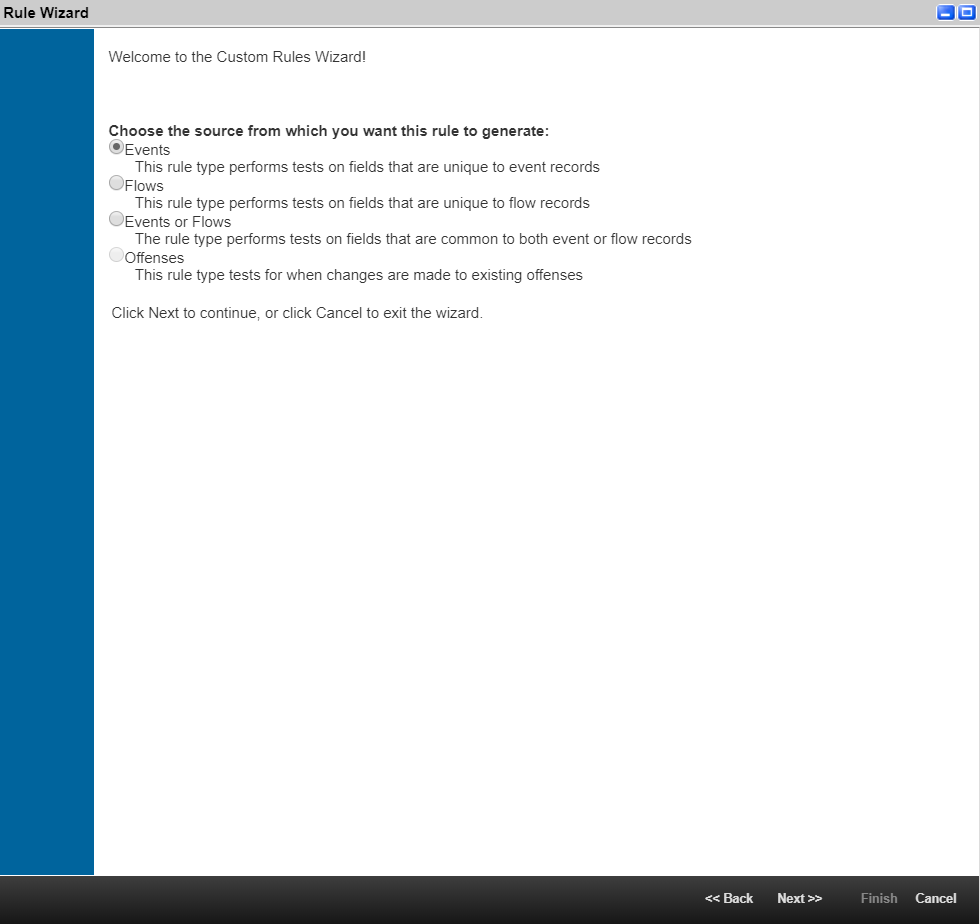
The Rules Wizard window
- Select Events, and then click Next.
- On the Rule Test Stack Editor page, perform the following actions:
- Add the following test conditions for a new rule:
when the event(s) were detected by one or more of these log sourceswhen the event matches this search filter
- For each specified condition, set a logical
andoperator. - For the
when the event(s) were detected by one or more of these log sourcescondition, specify Log Source that is equal toKL_Threat_Feed_Service_v2. If this event source is absent, add Feed Service as a log source. - For the
when the event matches this search filtercondition, specify a filter for comparing Event Name with the value of the event source name by performing the following actions:- In the list of the event fields, select Event Name.
- In the list of conditions, select Equals.
- Click Browse to choose the name of the service event for which the rule is created.
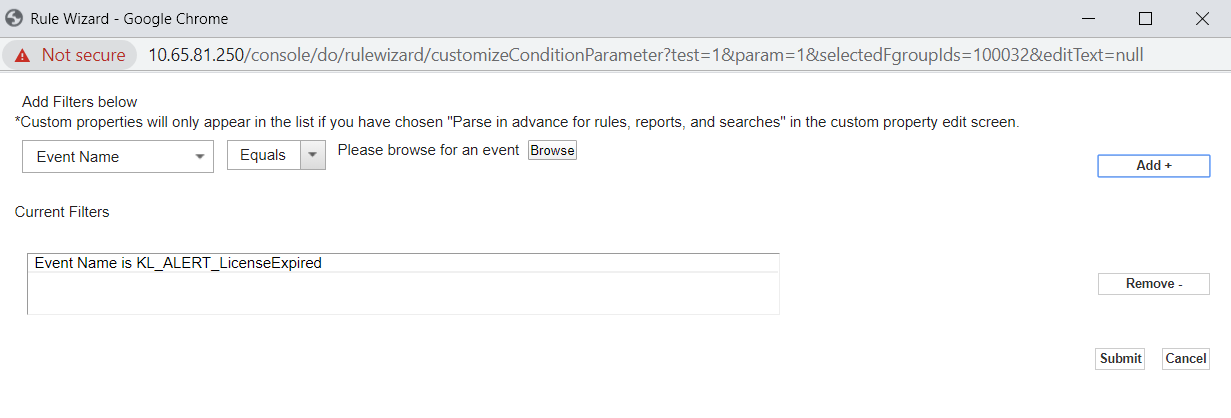
- Click Add+, and then Submit.
If the necessary event is absent, add it to the QRadar Identifiers (QID) list.
- Enter the name of the rule and select the way in which this rule will be applied to the incoming events (Local or Global). For more information about the Local and Global rules, see IBM documentation.
- Select the group that you need for the rule.
- Add a description for the rule.
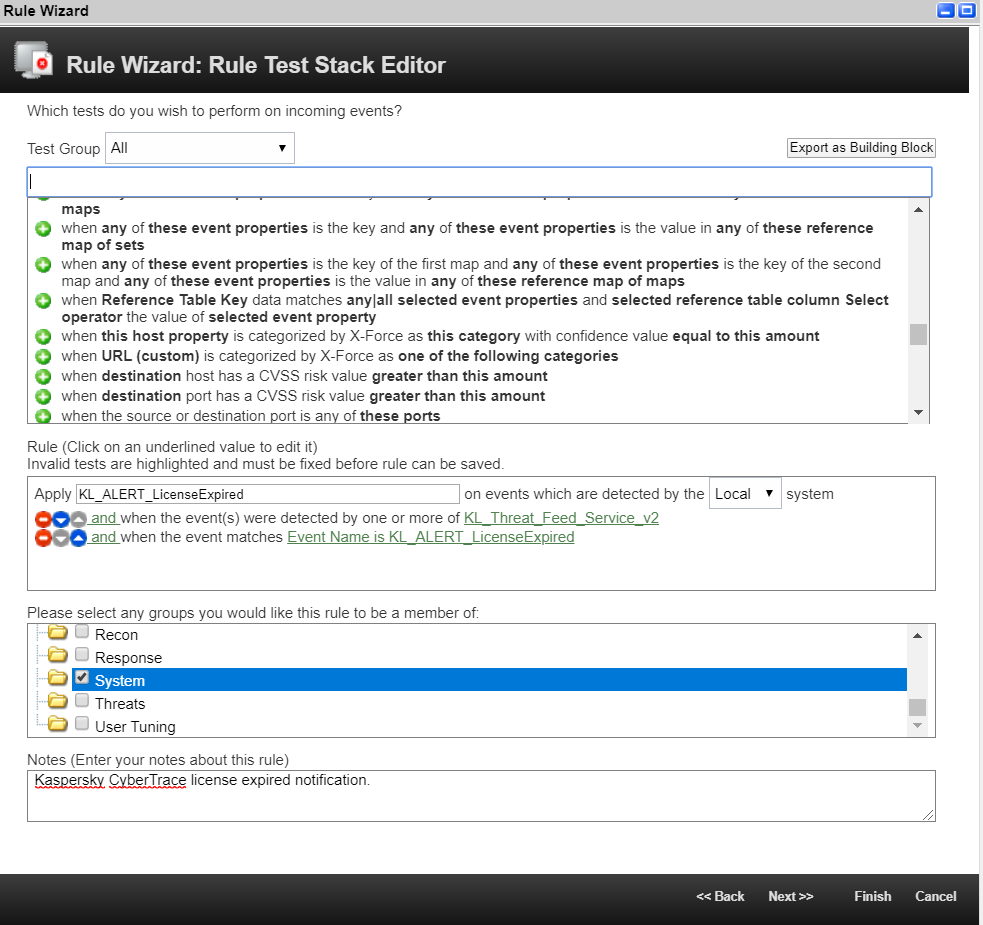
The Rule Editor window
- Click Next.
- Add the following test conditions for a new rule:
- On the Rule Response page, perform the following actions:
- Select Notify.
- If necessary, specify a limit on a rule triggering in the Response Limiter section.
- Check the Enable Rule section.
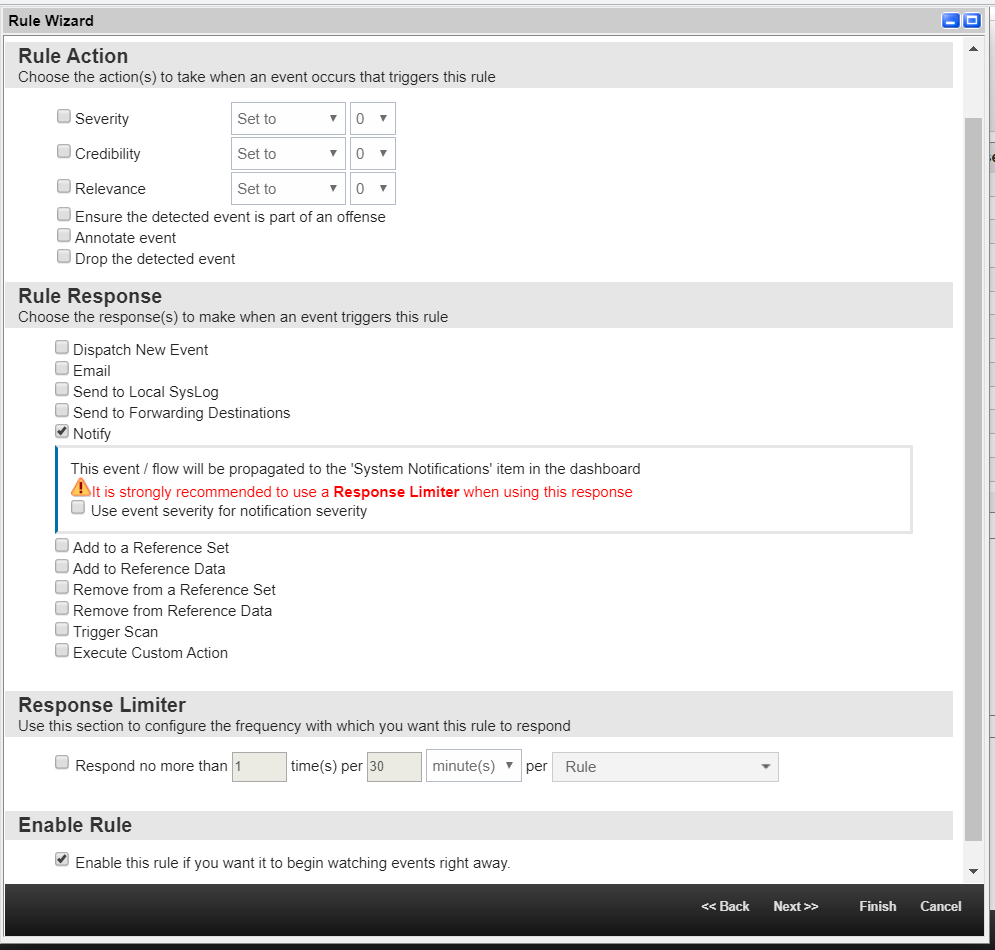
The Rule Editor page
- Click Next
- On the Rule Summary page, make sure that all settings are specified correctly, and click Finish.
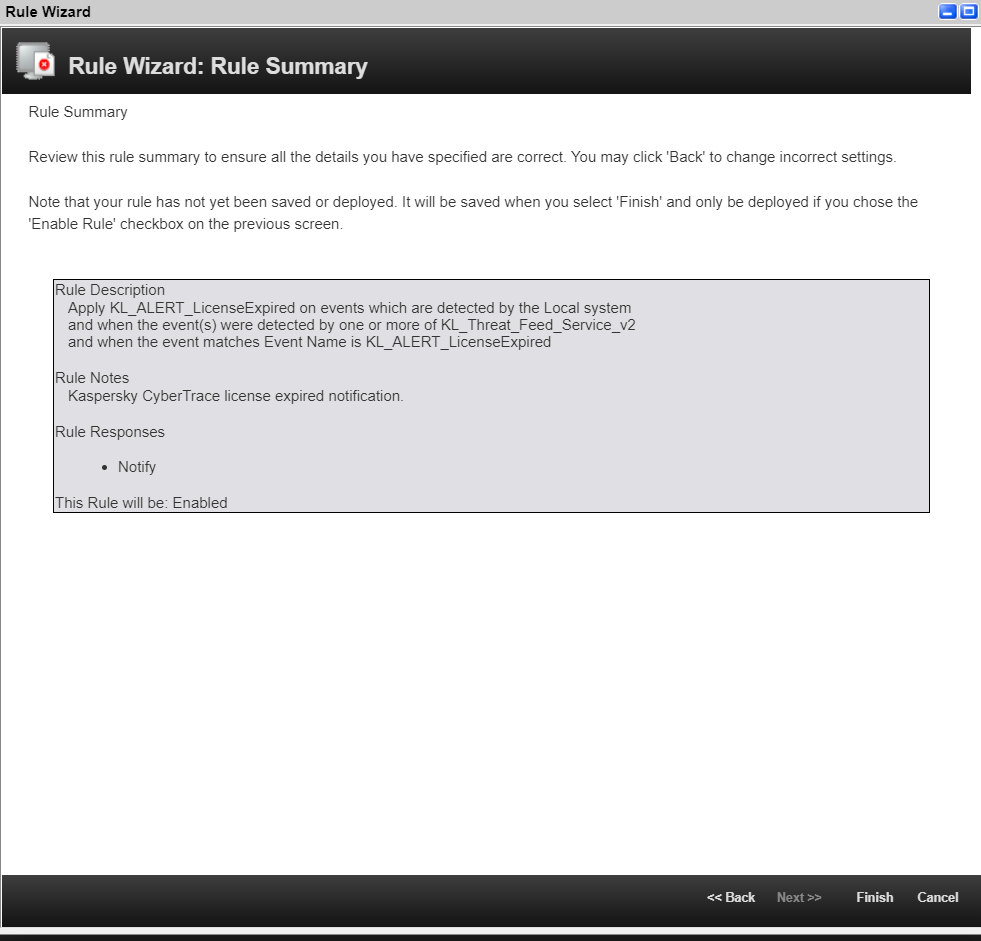
The Rule Summary page
The rule will now be added to the Rules list.
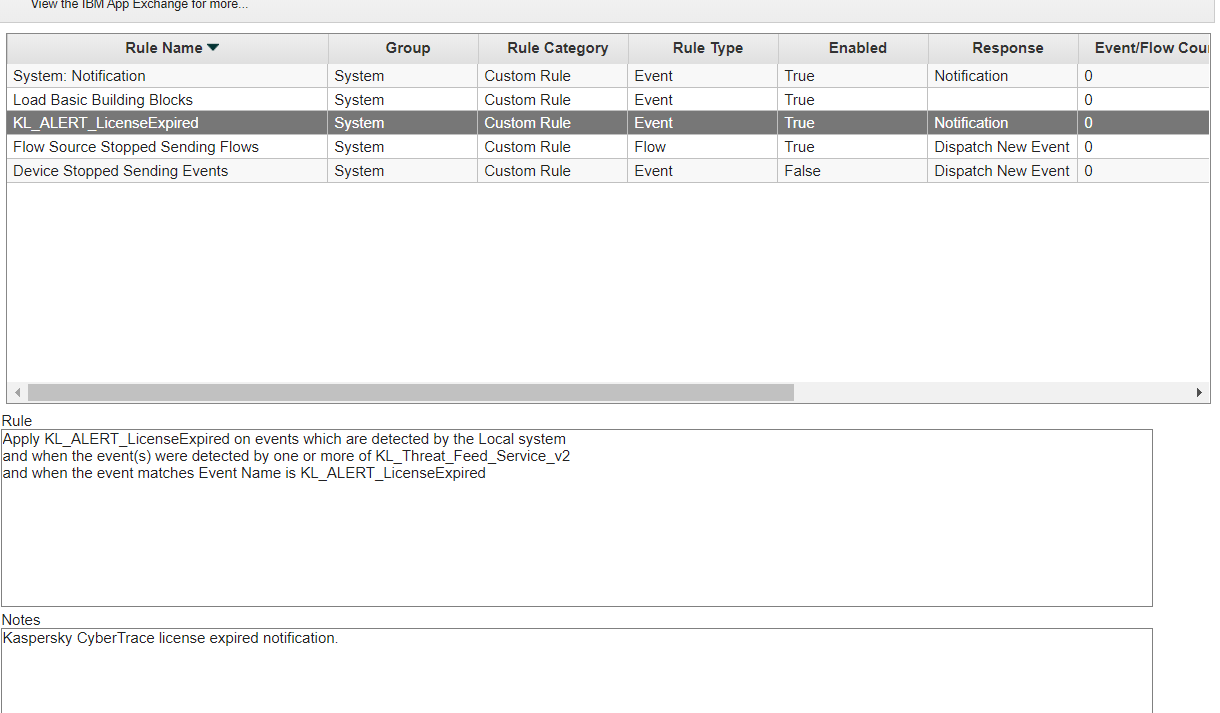
The Rules list
The added rule generates a notification about an incoming service event. You can browse these notifications by clicking the Messages drop-down list. Also, notifications are displayed in QRadar Console as a pop-up message.
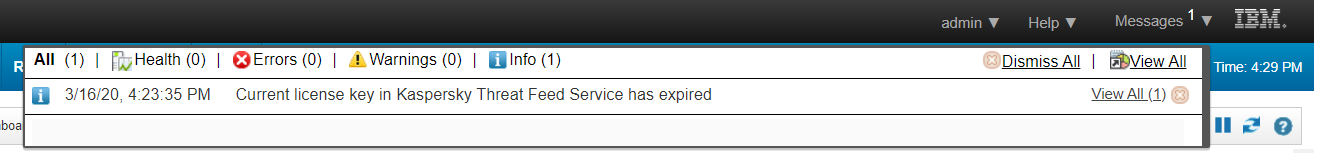
The Messages drop-down list
You can configure displaying of notifications on the Dashboard tab.
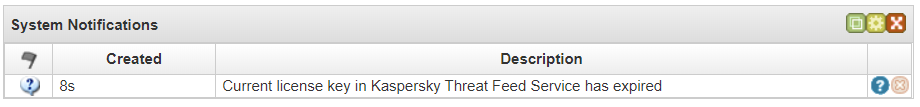
System notifications on the Dashboard tab
To configure displaying of notifications on the Dashboard tab:
- Select the Dashboard tab.
- In the Add Item drop-down list, select System Notifications.
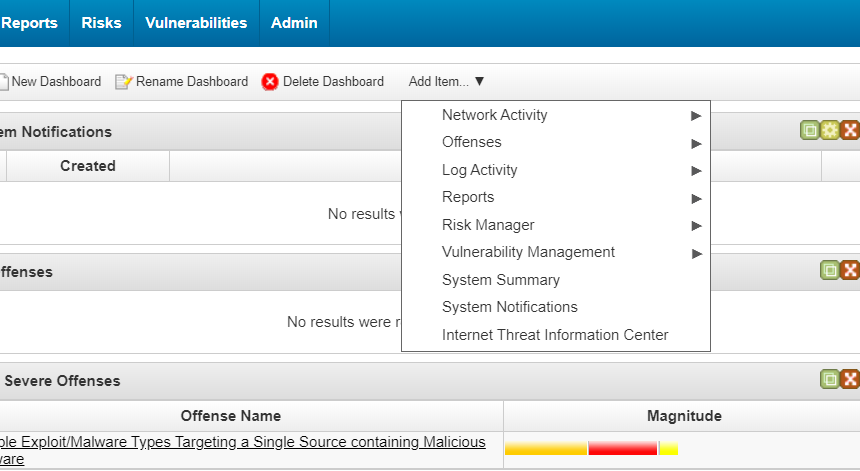
Adding system notifications on the Dashboard tab
Step 9 (optional). Installing Kaspersky Threat Feed App
This section describes how to install Kaspersky Threat Feed App.
Only a user account that has the System Administrator role can manage Kaspersky Threat Feed App.
Getting Kaspersky Threat Feed App
You can get the Kaspersky Threat Feed App installation package from IBM Security App Exchange.
Installing Kaspersky Threat Feed App
To install Kaspersky Threat Feed App:
- In QRadar, select Admin and then Extensions Management.
- In the Extensions Management form, click the Add button.

Extensions Management form
- Select the application file archive.
- Select the Install immediately check box.
- Click Add.
- Click Install.
A list of changes to be made is displayed. In particular, the custom event properties that will be added are displayed.
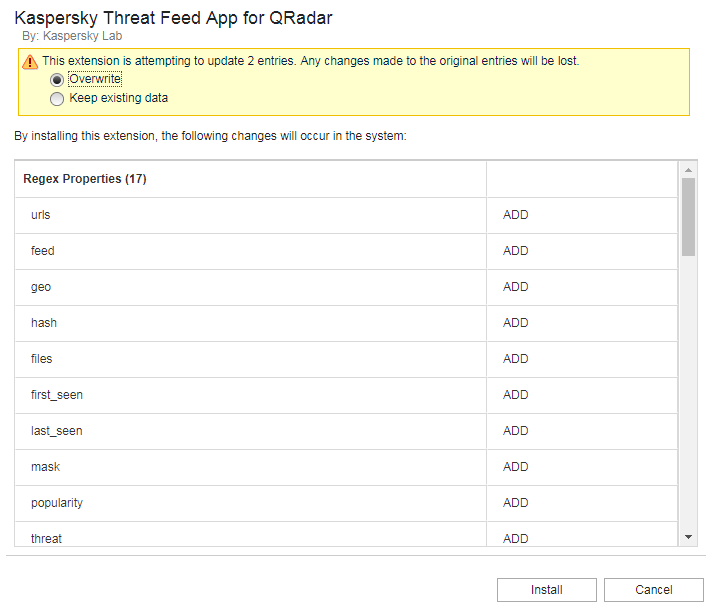
Custom event properties to be added
The following custom event properties are added when the app is installed:
urlsfeedgeohashfilesfirst_seenlast_seenmaskpopularitythreatwhoisURLSHA1 HashSHA256 HashMD5 Hashiprecords_count
You will use these properties to enable the indexes of the added custom event properties and to specify the log source type.
- Click Install again.
Kaspersky Threat Feed App appears in the Extensions Management form after it is installed.
- Refresh the browser window before you use the app.
After Kaspersky Threat Feed Service App is installed, its name will appear as a tab—Kaspersky Data Feeds—in QRadar Console.

Kaspersky Data Feeds tab
- In QRadar Console, select Kaspersky Data Feeds tab.
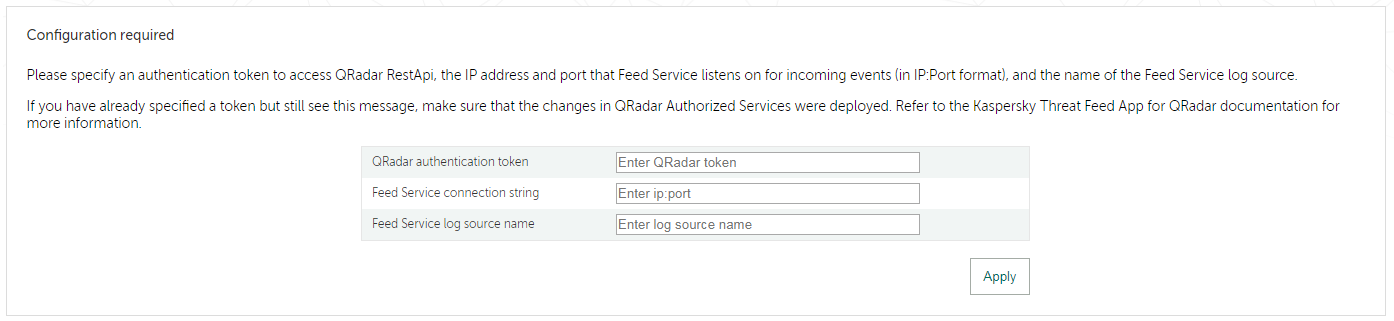
The Configuration required form will appear.
Configuration required form
- In the Configuration required form:
- In the QRadar authentication token field, specify an authentication token to access QRadar REST API.
You can specify an existing token or create a new token.
If the specified token expires, the Configuration required form will appear again the next time you select Kaspersky Data Feeds. In this case, you must specify a new token.
- In the Feed Service connection string field, specify the IP address and port that Feed Service listens on for incoming events.
You cannot specify the
127.0.0.1IP address, even if Kaspersky Threat Feed App is installed on the QRadar computer. Instead, specify the external IP address of the QRadar computer. - In the Feed Service log source name field, specify the log source name of Feed Service as it is registered in QRadar.
This name is displayed in the Name column of the window that opens after Admin > Log Sources is selected in QRadar Console. For example,
KL_Threat_Feed_Service_v2.For more information about specifying log sources, see the section about configuring Kaspersky Threat Feed App.
- In the QRadar authentication token field, specify an authentication token to access QRadar REST API.
Step 10 (optional). Enabling the indexes of the added custom event properties
We recommend that you enable the indexes of the added custom event properties. This will increase the performance of Kaspersky Threat Feed App.
To enable the indexes of the added custom event properties:
- In QRadar, select Admin and under System Configuration select Index Management.
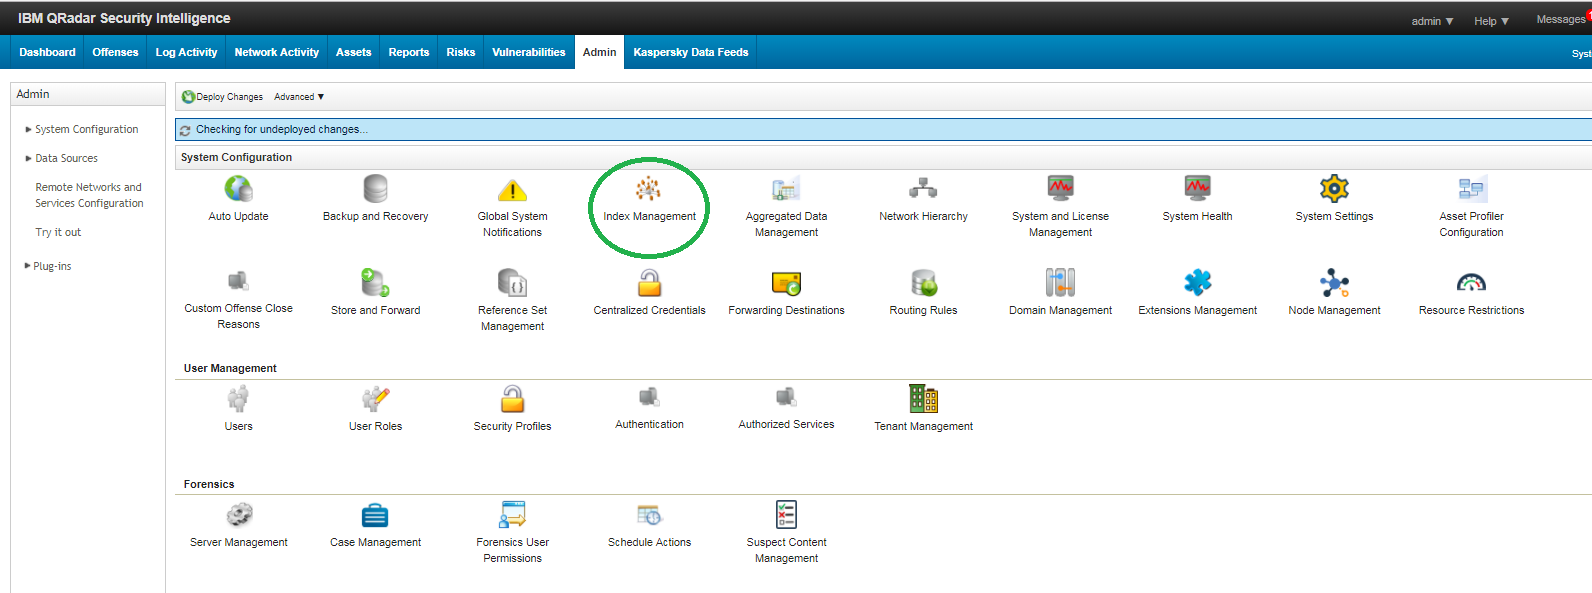
Admin tab of QRadar Console (system configuration tools)
The Index Management window opens.
- Optionally, specify the filter to find the added properties.
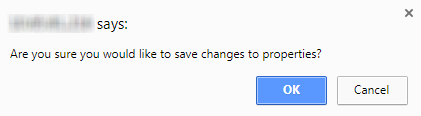
- Select one or several table rows, and click Enable Index.
- Click Save.
A message box appears that asks you whether you want to save the changes you made.
Saving changes to the indexes
- Click OK to save changes to the properties.
Step 11 (optional). Configuring Kaspersky Threat Feed App
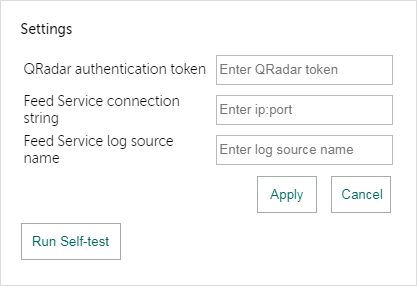
You can configure Kaspersky Threat Feed App by selecting the Settings link in QRadar Console.

Settings link
You specify the settings in a form that appears after you select the Settings link.
Settings form
The following settings fields are available:
- QRadar authentication token
The authentication token to access QRadar RestApi.
You can specify an existing token or create a new token.
- Feed Service connection string
The IP address and port that Feed Service listens on for incoming events.
If you have installed Kaspersky CyberTrace on the same computer on which QRadar is installed, Kaspersky Threat Feed App will not be able to connect to QRadar because the iptables rules forbid the communication of a Docker container, in which Kaspersky Threat Feed App is running, and the QRadar computer.
To make Kaspersky Threat Feed App work on the QRadar computer, connect to the QRadar computer using the SSH protocol and run the following command:
iptables -I INPUT -i <D_interface> -p tcp --destination-port <FS_port> -j ACCEPTThis command includes:
-
<D_interface>—Interface of the Docker container that contains Kaspersky Threat Feed App for QRadar.To find the
<D_interface>name, perform the following:- Find the identifier of Kaspersky Threat Feed App by running the following command:
psql -U qradar -c "select id, name from installed_application;"A table appears. Find the value for the identifier of Kaspersky Threat Feed App (hereinafter
<app_id>) from theidcolumn. - Find the identifier of the Docker container in which Kaspersky Threat Feed App is contained by running the following command:
docker psIn the output result, find the image with the
.../qapp/<app_id>:x.x.xname, wherex.x.xis the installed version of Kaspersky Threat Feed App, and find itsCONTAINER IDvalue (hereinafter<container_id>). - Find the interface name for the Docker image that contains Kaspersky Threat Feed App, by running the following command:
docker inspect <container_id> | grep NetworkModeThe output result appears, in the format
"NetworkMode": "<D_interface>". Substitute this result for<D_interface>in the command above.
- Find the identifier of Kaspersky Threat Feed App by running the following command:
<FS_port>—Port that Feed Service listens on for incoming events.
If you run the above command, the added rule will be present in iptables only until iptables is restarted, or the QRadar computer is restarted. To add this rule permanently, add it to the
/etc/sysconfig/iptablesfile (the path to the iptables file depends on the environment configuration).Also note that you cannot specify the
127.0.0.1IP address even if Kaspersky Threat Feed App is installed on the QRadar computer. Specify the external IP address of the QRadar computer instead. -
- Feed Service log source name
The log source name of Feed Service as it is registered in QRadar. This name is displayed in the Name column of the window that opens after Admin > Log Sources is selected in QRadar Console.
If the Feed Service log source was added automatically when you sent the initial set of Feed Service events to QRadar, the log source name is
Kaspersky Threat Feed Service @ [id], where[id]is the identifier of Feed Service events. (By default,[id]isKL_Threat_Feed_Service_v2). If you had to add Feed Service to QRadar as a log source manually because you did not have the latest QRadar updates, the log source name is[id];that is,KL_Threat_Feed_Service_v2by default.It takes some time to visualize the requested data after you have changed the log source name or the installed Kaspersky Threat Feed App. While the data is being loaded, a progress bar is displayed. The time required for getting all the data depends on the selected period over which the data is visualized.
After you configure Kaspersky Threat Feed App, you can run the verification test by clicking the Run self-test button.
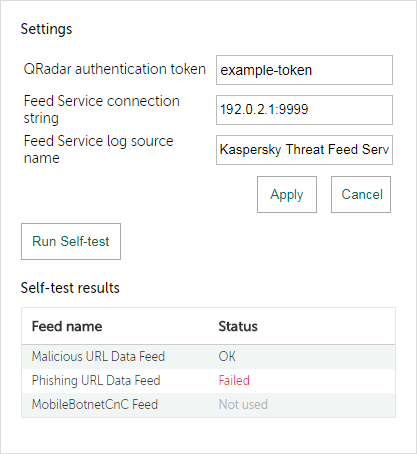
Self-test results
A test result of Failed for any feed means that a tested object is assigned to an incorrect category. The error can originate, for example, in an incorrect configuration file.