Contents
Application for Splunk
This chapter explains how to use Kaspersky CyberTrace App for Splunk.
About Kaspersky CyberTrace App for Splunk
Kaspersky CyberTrace App for Splunk is a Splunk app. It does the following:
- Displays information about URLs, IP addresses, and hashes from events that match Kaspersky Threat Data Feeds in the Kaspersky CyberTrace Matches dashboard.
- Displays information about Kaspersky CyberTrace status in the Kaspersky CyberTrace Status dashboard.
- Matches individual URLs, IP addresses, and hashes to Kaspersky Threat Data Feeds by performing a lookup on the Indicators lookup tab.
- Performs Self-test and displays the feeds in use.
Additionally, Kaspersky CyberTrace App for Splunk comes with alert templates that demonstrate the basic trigger conditions that can be used with Kaspersky CyberTrace.
About Kaspersky CyberTrace App dashboards
Kaspersky CyberTrace App uses the following dashboards:
- Kaspersky CyberTrace Matches
This dashboard provides information about URLs, IP addresses, and hashes from events that matched Kaspersky Threat Data Feeds, together with statistical information and a log of matches.
- Kaspersky CyberTrace Status
This dashboard provides match statistics for Feed Service and a log of alerts received from it. The dashboard can also be used to run the Self-test of Kaspersky CyberTrace App for Splunk.
- Indicators lookup
This tab allows you to configure and perform a lookup by indicator.
- Alerts
This is a standard Alerts dashboard. Kaspersky CyberTrace App for Splunk comes with several alert templates that you can use and customize from this dashboard.
- Kaspersky CyberTrace online documentation
Link to the online documentation for Kaspersky CyberTrace.
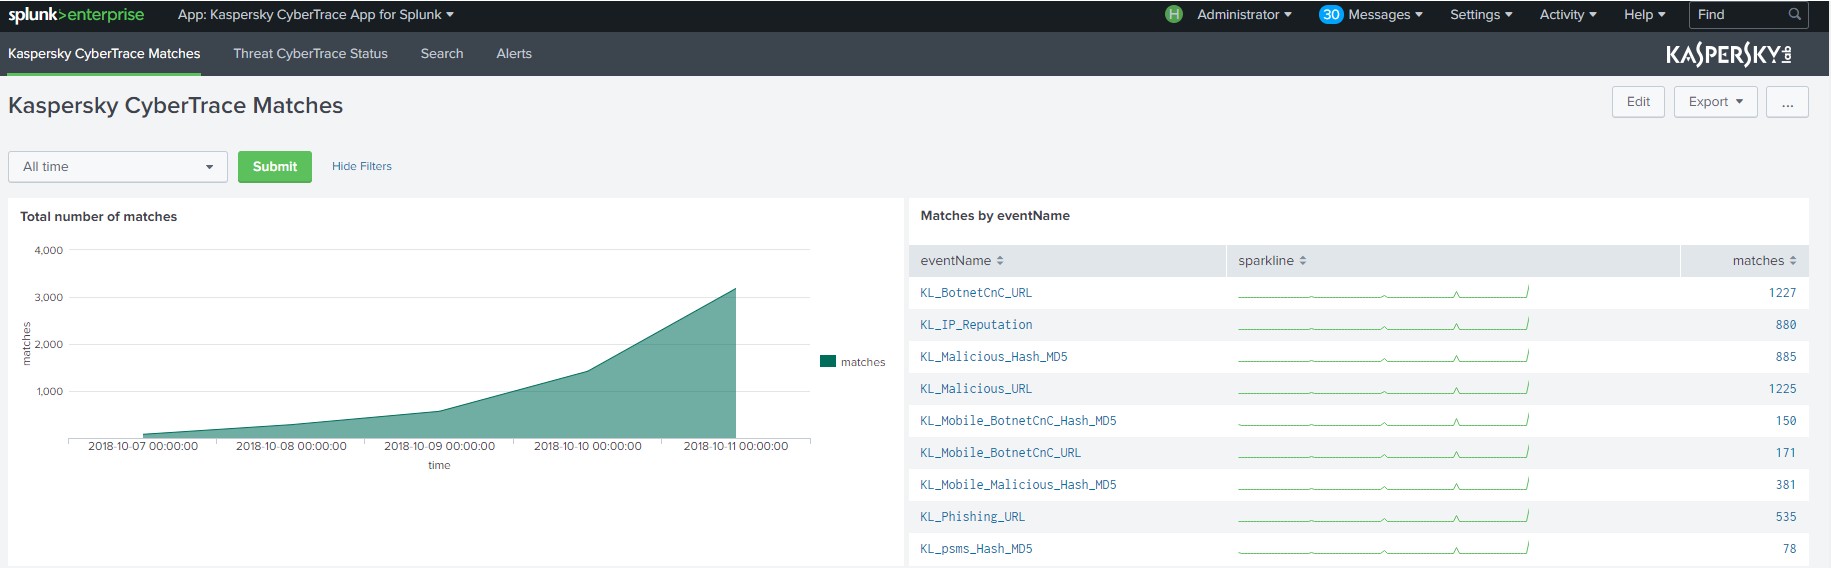
Kaspersky CyberTrace Matches dashboard
The Kaspersky CyberTrace Matches dashboard provides information about URLs, IP addresses, and hashes from events that match Kaspersky Threat Data Feeds, together with statistical information and a log of matches.
Kaspersky CyberTrace Matches dashboard
Top 10 panels
Match log panel
There is a time range picker and several panels on this dashboard:
- Time range picker
You can use it to select a time range for the displayed information.
- Total number of matches
This panel displays a chart of the total number of matches with all feeds used by Feed Service.
- Matches by the
eventNamefieldThis panel displays a table with the number of matches for each category.
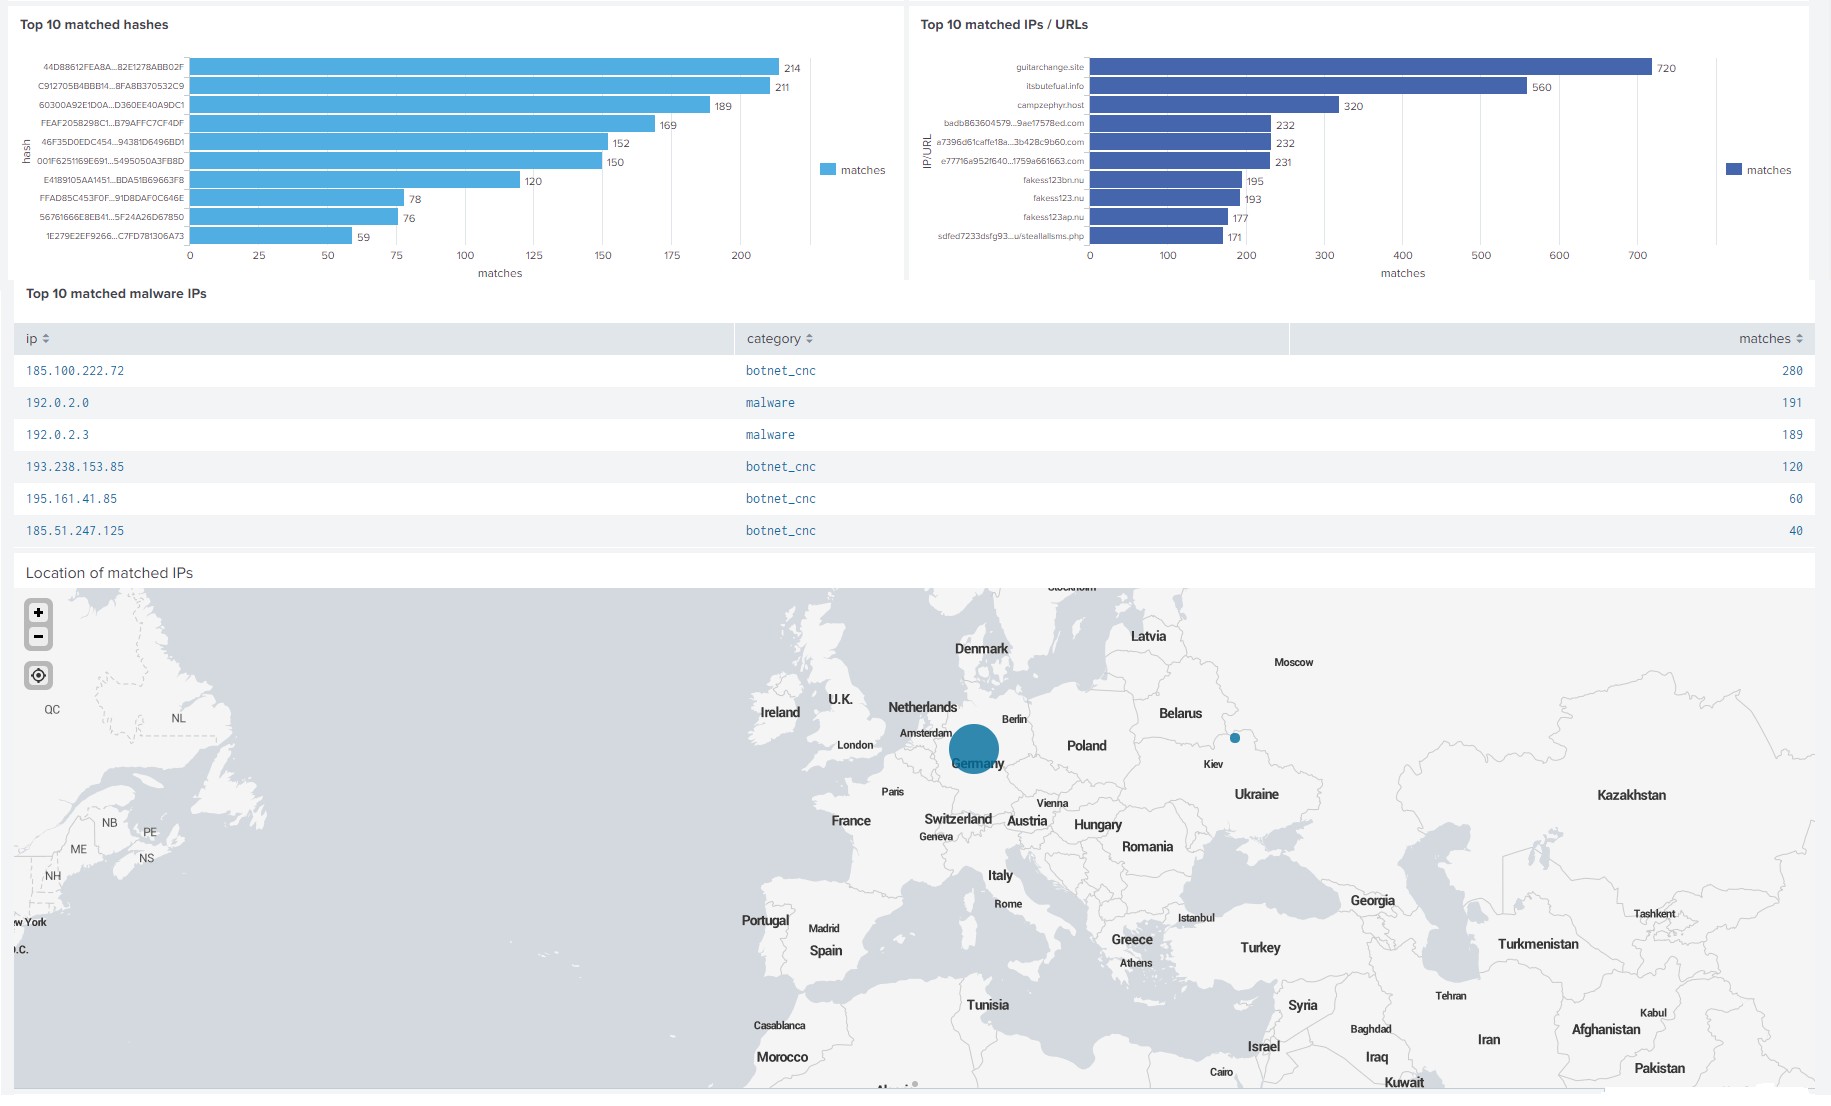
- Top 10 matched hashes
This panel displays a bar chart of matches for the top 10 hashes.
- Top 10 matched IPs / URLs
This panel displays bar charts of matches for the top 10 IP addresses and URLs.
- Top 10 matched TOR / malware / spam IPs
This panel displays bar charts of matches for the top 10 IP addresses of Tor exit nodes, malicious IP addresses, and spam IP addresses.
- Location of matched IPs
This panel displays a map with the locations of matched IP addresses.
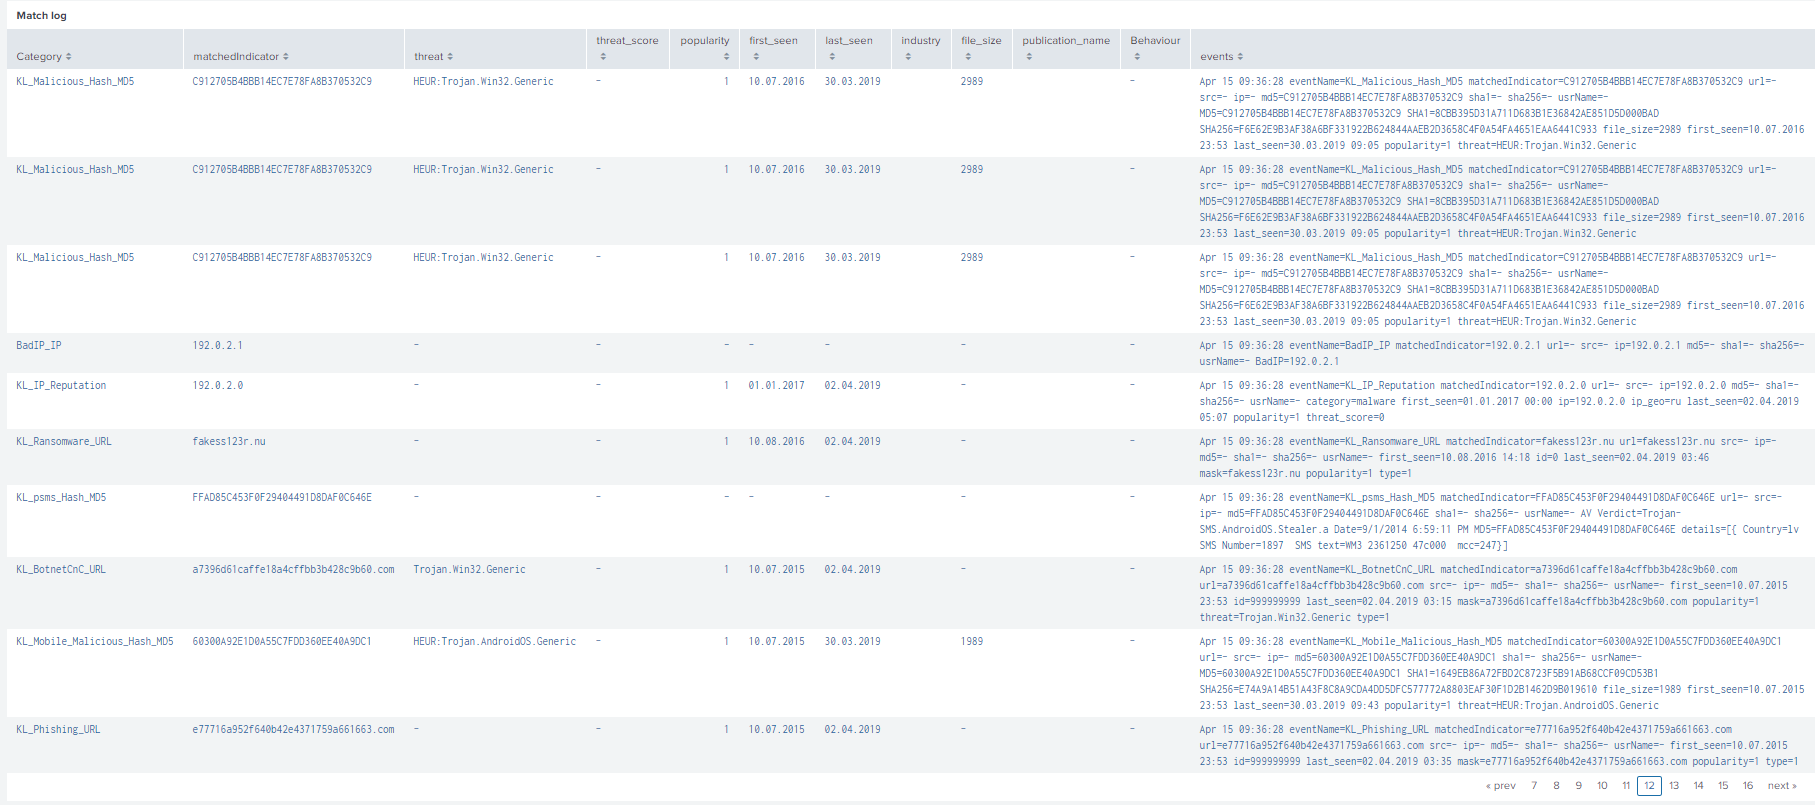
- Match log
This panel displays a table with a log of all matches, including actionable context for each match. The actionable context fields below will be displayed. These are fields that you can insert into outgoing events separately from the context of feed records.
- First_seen
- Last_seen
- Popularity
- Threat
- Publication name
- Industry
- Threat_score
- File_size
- Behavior
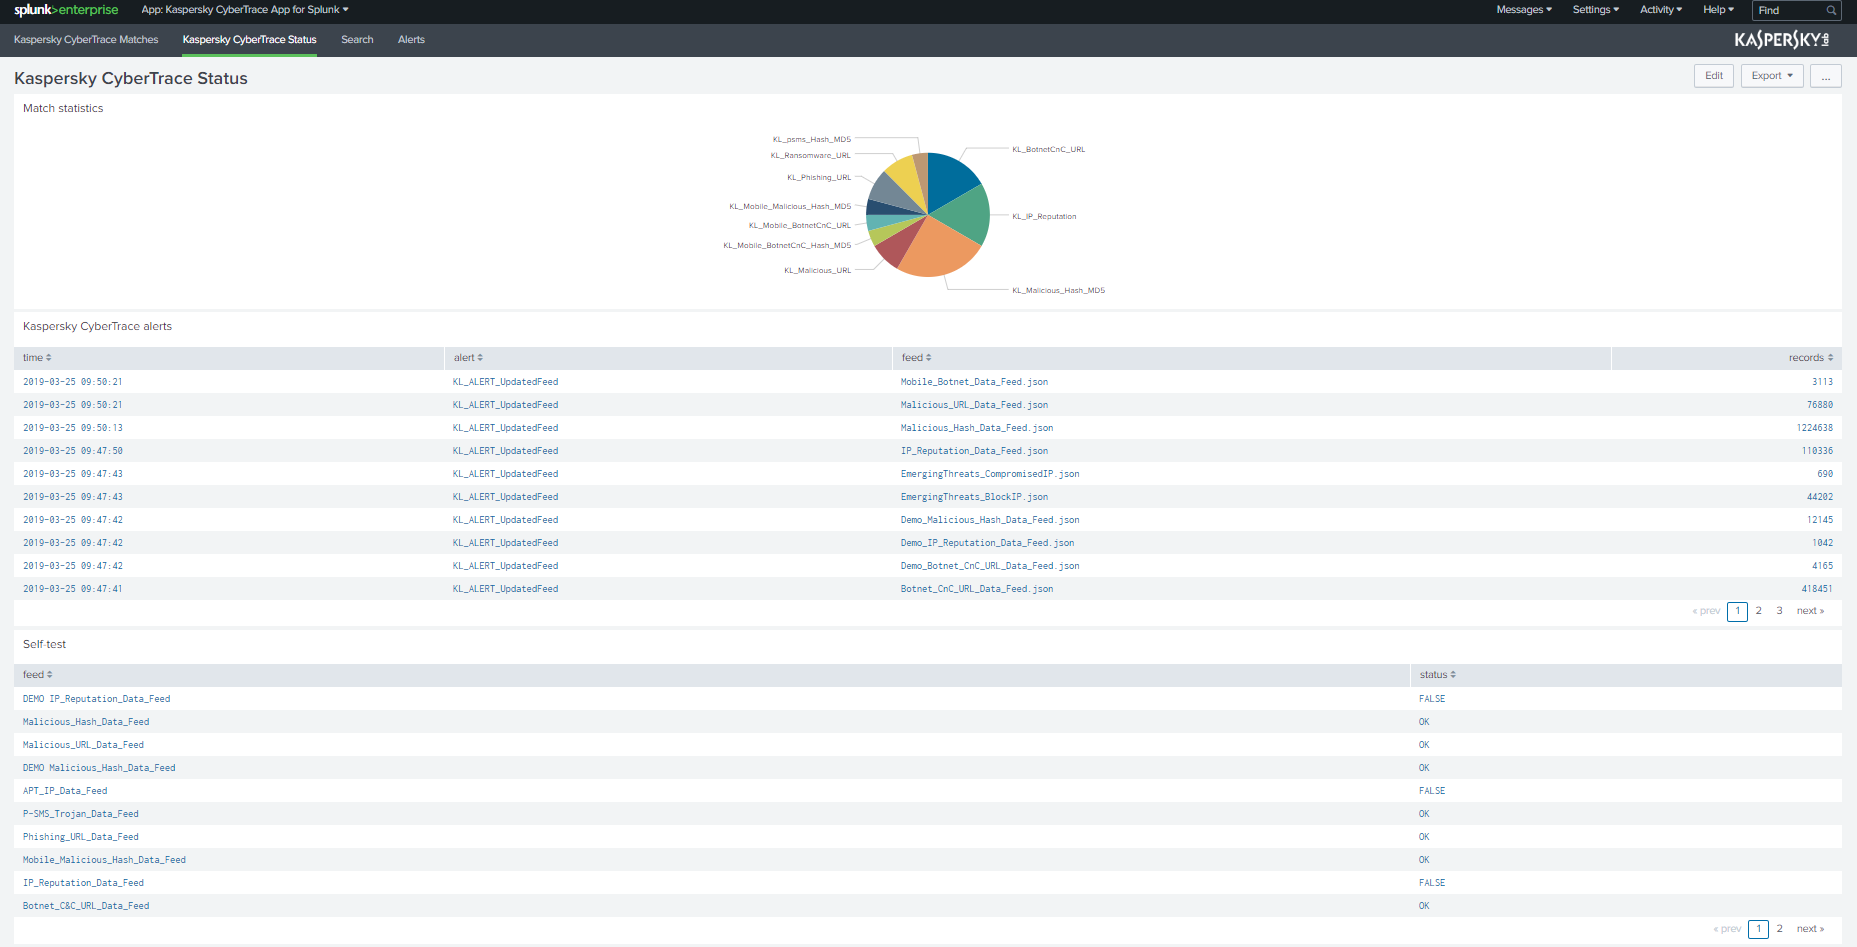
Kaspersky CyberTrace Status dashboard
The Kaspersky CyberTrace Status dashboard provides match statistics for Feed Service, and displays a log of alerts generated by Feed Service.
Kaspersky CyberTrace Status dashboard
The Kaspersky CyberTrace Status dashboard has three panels:
- The Match statistics panel
- The Kaspersky CyberTrace alerts panel
- The Self test panel
Match statistics panel
This panel displays a pie chart of matches for each category returned by Feed Service.
Kaspersky CyberTrace alerts panel
This panel displays a table with a log of alerts generated by Feed Service.
Self test panel
This panel displays a table with Self-test results.
These settings are used for performing the self-test on the Kaspersky CyberTrace Status tab.
The Self-test is performed automatically when you open the Kaspersky CyberTrace Status dashboard. The following status values are possible:
- OK
The feed is turned on and the matching for this feed was successful.
- FALSE
The feed is turned off or is processed incorrectly by Feed Utility or Feed Service.
To perform a lookup, Kaspersky CyberTrace connection settings are used. These settings are specified on the Indicators lookup tab.
Page topIndicators lookup
The Indicators lookup tab allows you to do the following actions:
- To perform a lookup by a single indicator.The following formats can be used:
%INDICATOR%, if Kaspersky CyberTrace uses general regular expressions (regular expressions that are not associated with binding to a specific field).%FIELDNAME%=%INDICATOR%, if Kaspersky CyberTrace uses regular expressions that expect the%INDICATOR%value to be specified in the%FIELDNAME%field.
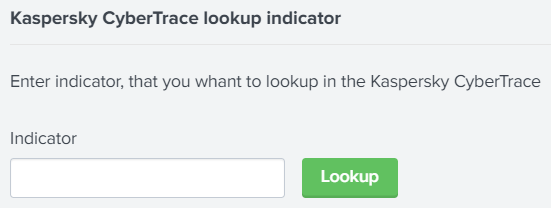
Lookup by a single indicator
- To configure a lookup by indicator. These settings will be applied to any indicator that is involved in the lookup process only if you perform a lookup by some indicator. These settings are also used for performing the Self-test in the Kaspersky CyberTrace Status tab. The settings will be placed in the Splunk storage.
In this section, you can specify the IP address and port of Kaspersky CyberTrace.
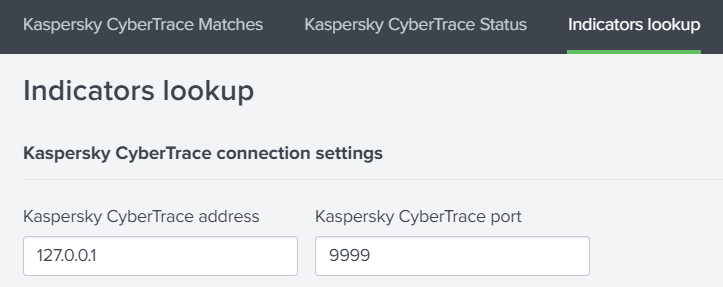
Kaspersky CyberTrace connection settings
- To browse detailed information about the indicator.
You can learn more about the indicator that you need by clicking the lookup result. The link redirects you to the Kaspersky Threat Intelligence Portal page that contains information about the object.
Alert templates
Kaspersky CyberTrace App for Splunk comes with several alert templates that you can use and customize from the Alerts dashboard.
Alert templates and triggers
Following alert templates are available:
- Matches alert
This alert is triggered if there were matches with Kaspersky Threat Data Feeds in the past 24 hours.
- No Matches alert
This alert is triggered if there were no matches with Kaspersky Threat Data Feeds in the past 24 hours.
- Emergency alert
This alert is triggered if there were 5000 matches with Kaspersky Threat Data Feeds in the course of 1 minute.
- Service Unavailable alert
This alert is triggered if Feed Service is unavailable.
This alert contains the date when the alert was generated followed by a timestamp in the UNIX time format.
- Service Started alert
This alert is triggered when Feed Service is started.
This alert contains the date when the alert was generated followed by a timestamp in the UNIX time format.
Alert actions
By default, the Add to Triggered Alerts action is defined for all alerts. As an option, you can add a Send email action so that Splunk will send an email message to the email address specified for the action.
Creating notifications about incoming service events
You can create notifications about incoming Kaspersky CyberTrace service events by configuring alert rules.
To create notifications about service events from Kaspersky CyberTrace in Splunk:
- On the Search and Reporting app for Splunk menu, select the Search tab.
- In the search box, specify a condition for creating alerts. For example:
sourcetype="kl_cybertrace_events" alert="KL_ALERT_ServiceStopped"This condition defines the request for searching alert events that are generated when Feed Service is stopped.
- Click the Search button (
 ) to make sure that the specified request is performed correctly.
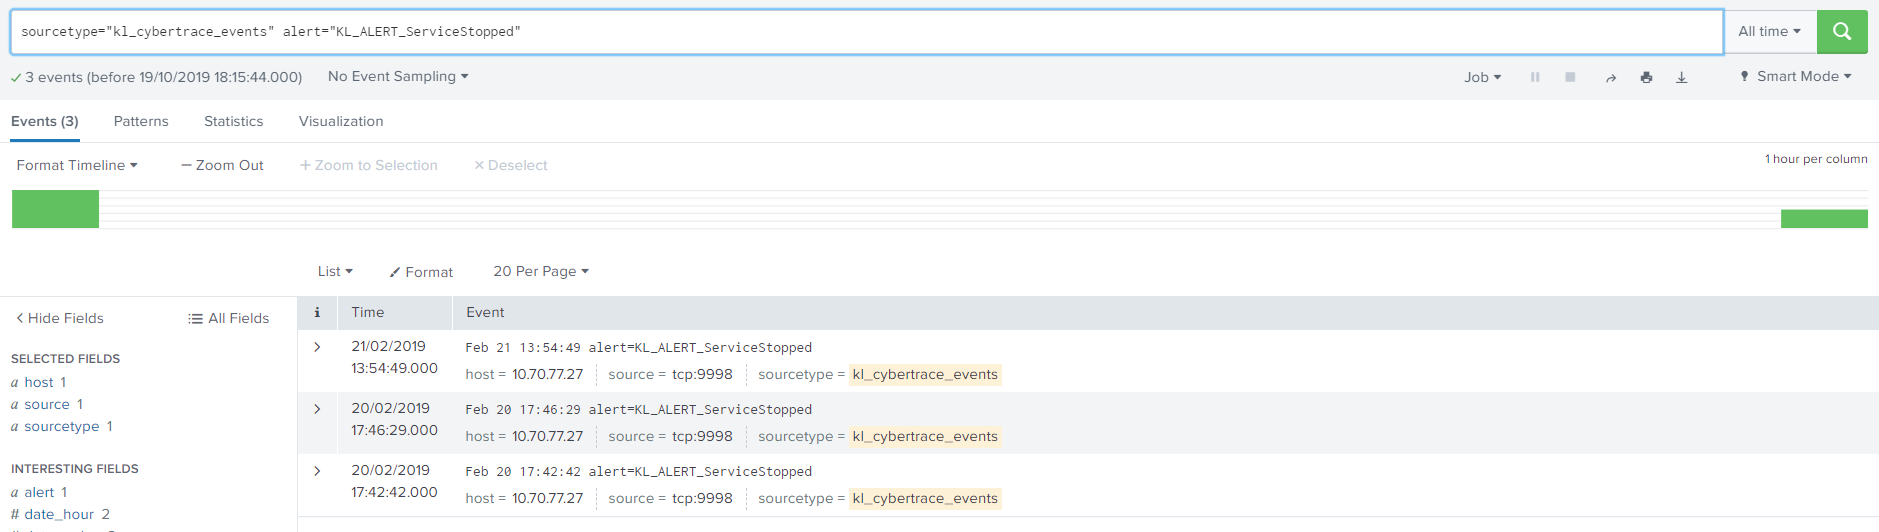
KL_ALERT_ServiceStopped events
- Click Save as and select Alert.
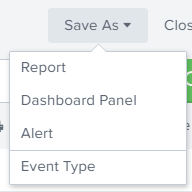
Saving alert
The Save As Alert window opens.
- In the Save As Alert window, specify the following settings:
- In the Title field, specify the name of the alert.
You can specify any title.
- In the Description field, specify the alert description.
You can specify any description.
- In the Alert type field select the one of the following:
- Scheduled—If you want to check events for matching the specified conditions regularly.
- Real-time—If you want to check events for matching the specified conditions in real time.
- In the Trigger field, specify For each results.
- Select the Throttle check box and then, if necessary, specify the amount of time during which Splunk will not send new alerts if the rule is triggered.
- In the Trigger Actions field, specify the way in which Splunk notifies when an alert is triggered.
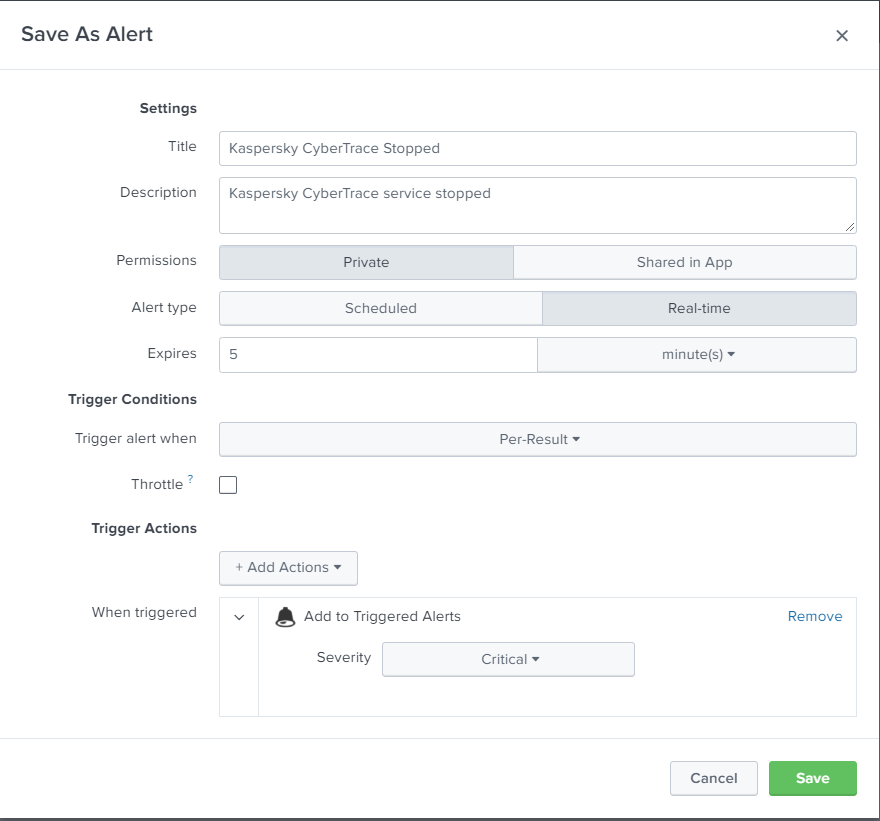
The Save As Alert window
- In the Title field, specify the name of the alert.
- Click Save.
The rule will now appear in Splunk.