Dashboard section
Dashboard section
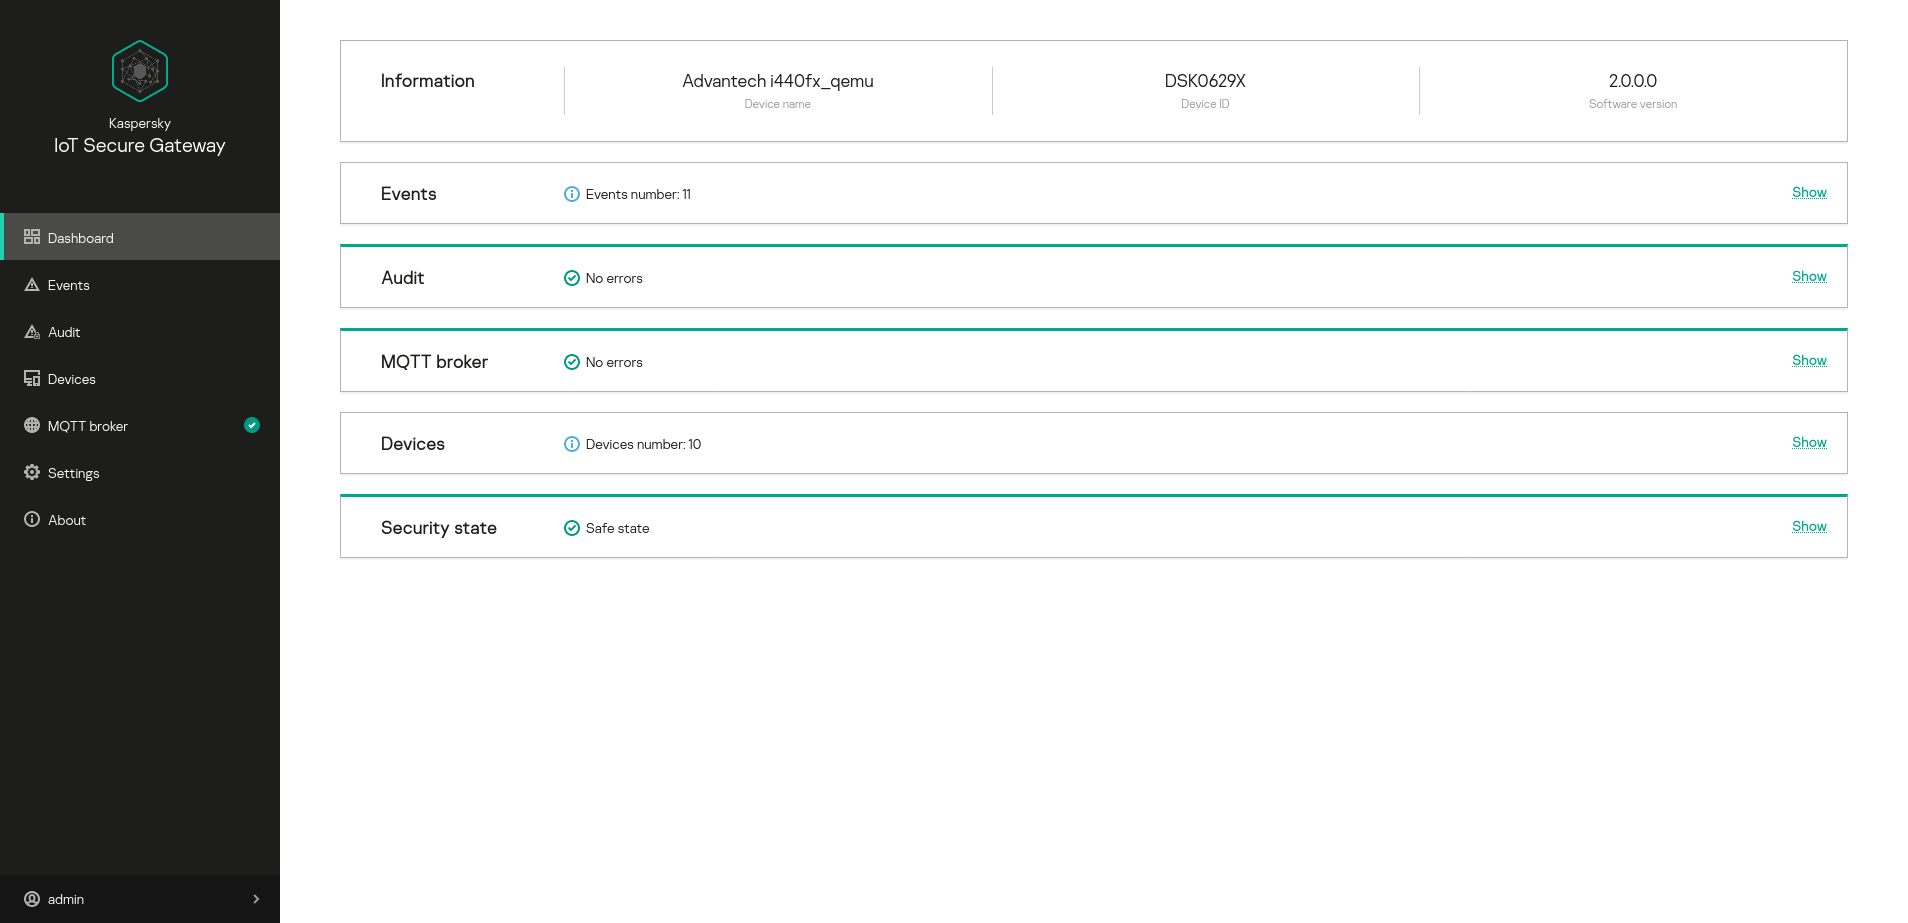
In the Dashboard section (see the figure below), you can view consolidated information about the system.
Dashboard section
The Dashboard section displays the following information blocks:
- Information – the name and serial number of the hardware platform, and the Kaspersky IoT Secure Gateway system version.
- Events – the number of network security events. If you expand the Events block by clicking the Show link, you will see the number of network security events for each component that registered events.
Network security events are not stored in the system and are available only while the current session of the web interface connection is active.
- Audit – information about the presence of system security events that are written to the audit log. If the system has registered events with the Warning or Critical severity level, the block shows Issues. If there are no events with the Warning or Critical severity level, the block shows No errors. Click the Show link to expand the Audit block to view the number of system security events for each severity level.
- MQTT broker – statistics of system operation over the MQTT protocol. If the system has detected problems with data transfer over the MQTT protocol, the block shows Issues. If there are no problems with data transfer over the MQTT protocol, the block shows No errors.
- Devices – the number of devices detected in the network.
- Security state – status of the security of system components.
Did you find this article helpful?
What can we do better?
Thank you for your feedback! You're helping us improve.
Thank you for your feedback! You're helping us improve.
