Contents
- Installation and integration guides
- Installation and integration overview
- Hardware and software requirements
- Distribution kit contents
- Part 1: Installing Kaspersky CyberTrace
- Part 2: Integrating Kaspersky CyberTrace with an event source
- Integration with Splunk
- Integration steps (Splunk)
- Single-instance integration (Splunk)
- About the single-instance integration scheme
- Step 1. Installing Kaspersky CyberTrace App (single-instance deployment)
- Step 2 (optional). Configuring Kaspersky CyberTrace App (single-instance deployment)
- Step 3 (optional). Configuring the lookup script (single-instance deployment)
- Step 4. Performing the verification test (Splunk, single-instance integration)
- Distributed integration scheme (Splunk)
- About the distributed integration scheme
- Step 1. Installing Forwarder and Search Head apps
- Step 2. Configuring Forwarder and Search Head apps (distributed deployment)
- Step 3 (optional). Configuring the lookup script (distributed deployment)
- Step 4. Performing the verification test (Splunk, distributed integration)
- Integration with ArcSight
- Integration steps (ArcSight)
- Before you begin (ArcSight)
- Standard integration (ArcSight)
- Integration schemes (ArcSight)
- Step 1. Importing the ARB package
- Step 2. Installing ArcSight Forwarding Connector
- Step 2 (alternative). Installing ArcSight Forwarding Connector by using the console
- Step 3. Configuring CyberTrace for interaction with ArcSight
- Step 4. Performing the verification test (ArcSight)
- Integration with QRadar
- Integration steps (QRadar)
- Standard integration (QRadar)
- About the standard integration scheme (QRadar)
- Step 1. Configuring QRadar to receive latest updates
- Step 2. Sending a set of events to QRadar
- Step 3. Forwarding events from QRadar to Feed Service
- Step 4. Performing the verification test (QRadar)
- Step 5. Retrieving custom event properties
- Step 6. Creating a search filter for CyberTrace events
- Step 7 (optional). Displaying events in a dashboard
- Step 8 (optional). Creating notifications about incoming service events
- Step 9 (optional). Installing Kaspersky Threat Feed App
- Step 10 (optional). Enabling the indexes of the added custom event properties
- Step 11 (optional). Configuring Kaspersky Threat Feed App
- Integration with RSA NetWitness
- Integration steps (RSA NetWitness)
- Before you begin (RSA NetWitness)
- Standard integration (RSA NetWitness)
- About the standard integration scheme (RSA NetWitness)
- Step 1. Forwarding events from RSA NetWitness
- Step 2. Sending events from Feed Service to RSA NetWitness
- Step 3 (optional). Importing a meta group for browsing fields filled by Feed Service
- Step 4 (optional). Importing Feed Service rules to RSA NetWitness
- Step 5 (optional). Importing a preconfigured report to RSA NetWitness
- Step 6 (optional). Importing preconfigured charts and a dashboard to RSA NetWitness
- Step 7. Performing the verification test (RSA NetWitness)
- Integration with LogRhythm
- Step 1. Adding a Custom Log Source type
- Step 2. Importing Kaspersky CyberTrace rules and events
- Step 3 (optional). Adding Kaspersky CyberTrace events
- Step 4 (optional). Adding Kaspersky CyberTrace rules
- Step 5. Adding Kaspersky CyberTrace policy
- Step 6. Adding a log source to System Monitor Agent
- Step 7. Configuring log forwarding to Kaspersky CyberTrace
- Step 8 (optional). Performing the verification test
- Step 9 (optional). Creating alerts about incoming Kaspersky CyberTrace service events
- Step 10 (optional). Displaying alert events in LogRhythm
- Integration with KUMA
- Integrating with other SIEM and non-SIEM solutions
- Extra integration scenarios
- Integration with Splunk
Installation and integration guides
This chapter describes how to install Kaspersky CyberTrace, configure it, and integrate it with different SIEM solutions.
Installation and integration overview
This section explains the installation and integration process for Kaspersky CyberTrace.
Introduction
Kaspersky CyberTrace can integrate with many different event sources. Because of this, the procedure for installation and integration is split into two parts:
- Installing Kaspersky CyberTrace
We recommend installing Kaspersky CyberTrace by using one of the installer packages for your operating system. On Linux, you can install DEB and RPM packages. On Windows, you can use an executable installer.
Another way to install Kaspersky CyberTrace is to extract the TAR archive, and then perform several additional configuration steps manually.
After Kaspersky CyberTrace is installed, you can perform the post-installation configuration by using a wizard in the web interface of Kaspersky CyberTrace. During this process, you select an event source, such as a SIEM solution, provide connection parameters for it, and configure feed updates.
After the post-installation configuration is completed, Kaspersky CyberTrace uses the default parameters for a chosen event source. For example, Kaspersky CyberTrace parses the incoming events by using the default regular expressions, and uses the default format for alert and detection events.
- Integrating Kaspersky CyberTrace with an event source
In this part, you configure the event source so that it can send its events to Kaspersky CyberTrace and receive detection events from Kaspersky CyberTrace. Depending on the chosen event source, you can also install specific applications and tools that work with Kaspersky CyberTrace events. For example, Kaspersky CyberTrace provides applications for Splunk and QRadar, and a preconfigured dashboard for RSA NetWitness. In addition to applications for specific event sources, you can use the LogScanner application to send log files, URLs, and hashes for checking to Kaspersky CyberTrace.
Before you begin
Make sure that the computer you plan to use for running Kaspersky CyberTrace meets the hardware and software requirements.
For ArcSight products, ArcSight SmartConnector must be installed before the installation of Kaspersky CyberTrace. For more information, see Before you begin (ArcSight) and Integration guide (ArcSight).
Part 1. Installing Kaspersky CyberTrace
When you install Kaspersky CyberTrace, all of the components required for working with feeds, such as Feed Service and Feed Utility, are installed and configured.
Kaspersky CyberTrace can be installed on any computer that can receive events from your chosen event source, such as a SIEM solution, a firewall, or a proxy server. By configuring Kaspersky CyberTrace during its installation, you specify how it will receive and send events.
Make sure to install Kaspersky CyberTrace according to your chosen integration scheme. For example, if you must install Kaspersky CyberTrace and a SIEM solution on separate computers, check the available integration schemes for your SIEM solution and decide where to install Kaspersky CyberTrace.
Depending on your operating system, install Kaspersky CyberTrace as described in the following sections:
After you install Kaspersky CyberTrace, configure it from Kaspersky CyberTrace Web by using the Initial Setup Wizard.
Part 2. Integrating Kaspersky CyberTrace with an event source
Kaspersky CyberTrace must be integrated with an event source. This event source can either be a standalone event source (for example, a firewall or a proxy server) or a SIEM solution. The event source then sends events to Kaspersky CyberTrace, and Kaspersky CyberTrace sends its own events to a SIEM or other application, as configured.
Kaspersky CyberTrace supports integration with the following SIEM solutions:
Page topHardware and software requirements
This section lists the system requirements of Kaspersky CyberTrace.
Supported operating systems
Kaspersky CyberTrace can run on the following operating systems:
- Linux x64
- Microsoft Windows Server 2019
- Microsoft Windows Server 2012 x64
- Microsoft Windows Server 2012 R2 x64
Dependencies for Linux
In Linux, Kaspersky CyberTrace has the following dependencies:
- The
moreutility must be installed.
Software requirements for integrations with SIEM solutions
When integrating with SIEM solutions, Kaspersky CyberTrace has the following software requirements.
Software requirements for integrations with SIEM solutions
SIEM solution |
Software requirements |
Splunk |
Splunk Enterprise 8.0.0 and later The older versions are supported in Kaspersky CyberTrace 3.1. |
ArcSight ESM |
ArcSight ESM 6.8 to 7.0 ArcSight SmartConnector ArcSight Forwarding Connector |
QRadar |
IBM QRadar v7.2.5 or later |
RSA NetWitness |
RSA NetWitness 10.5, 10.6, or 11.2 |
LogRhythm |
LogRhythm 7.1.7 or later |
AlienVault OSSIM |
AlienVault OSSIM 5.7.5 For more information, see https://support.kaspersky.com/15161. |
USM Anywhere |
USM Anywhere 5.7.5 For more information, see https://support.kaspersky.com/15161. |
FortiSIEM |
FortiSIEM 5.2 or later For more information, see https://support.kaspersky.com/15474. |
Apache Kafka |
Apache Kafka 2.4.0 or later Python 2.7 or 3 This integration requires a special plugin. For more information, contact your technical account manager (TAM). |
ArcSight Event Broker |
ArcSight Event Broker 2.2 Python 2.7 or 3 This integration requires a special plugin. For more information, contact your technical account manager (TAM). |
Elastic Stack (Elasticsearch, Logstash, and Kibana) |
Logstash 7.2 or later Java 8 or 11 This integration requires Kaspersky CyberTrace Plugin for Logstash, which you can download for free. For more information, see https://support.kaspersky.com/15474. |
McAfee ESM |
McAfee ESM 9.6 to 11 For more information, contact your technical account manager (TAM). |
Integrations with other SIEM solutions are available. For more information, see https://support.kaspersky.com/datafeeds.
Supported browsers
Kaspersky CyberTrace Web can be used by using the following web browsers:
- Microsoft Edge 42 or later
- Microsoft Internet Explorer 11 or later
- Mozilla Firefox 61 or later
- Safari 11 or later
- Google Chrome 68 or later
CPU requirements
Kaspersky CyberTrace has the following CPU requirements:
- Support of x86-64 instruction set.
It is recommended to use Kaspersky CyberTrace on high-end servers.
RAM and hard disk space requirements
System requirements depend on your use case and the feeds that you use. For more detail about the system requirements, contact your technical account manager (TAM).
The actual amount of hard disk space for each feed depends on the size of the original feed file. This size changes when feeds are updated. Over time, the size of the feed files may change significantly, which can change the required amount of hard disk and memory space.
The RAM and hard disk space requirements listed in the two tables below apply only to Kaspersky Threat Data Feeds. Using third-party feeds requires additional disk and memory resources.
The table below lists the RAM and hard-disk space requirements for using only demo feeds and for using all commercial feeds on Linux-based systems.
Hardware requirements for using different feeds on Linux
Feeds used |
HDD |
RAM |
All demo feeds |
600 MB |
2.5 GB |
All commercial feeds |
4 GB |
6.5 GB |
The table below lists the RAM and hard disk space requirements for using only demo feeds and for using all commercial feeds on Windows-based systems.
Hardware requirements for using different feeds on Windows
Feeds used |
HDD |
RAM |
All demo feeds |
500 MB |
1.5 GB |
All commercial feeds |
6 GB |
5 GB |
Network requirements
The computer on which Feed Utility runs must have access to the website https://wlinfo.kaspersky.com/.
The computer on which Kaspersky CyberTrace runs must have access to the computer with the SIEM solution.
The computers of users who want to gain access to Kaspersky CyberTrace Web must have access to the address and port that Kaspersky CyberTrace uses for the web UI.
Page topDistribution kit contents
This section describes the contents of the Kaspersky CyberTrace distribution kit.
Distribution kit types
Kaspersky CyberTrace is distributed in the following types of distribution kits:
- As an RPM package and a set of additional files
This type of distribution kit is intended for installation on Linux systems.
- As a DEB package and a set of additional files
This type of distribution kit is intended for installation on Linux systems.
- As an executable installer and a set of additional files
This type of distribution kit is intended for installation on Windows systems.
- As a .tgz archive
This type of distribution kit can be used on Linux systems instead of the RPM or DEB package.
About the integration files
All distribution kits of Kaspersky CyberTrace are customized for integration with a particular SIEM solution or for standalone integration. Each distribution kit contains a number of files that can be used for integration with this SIEM solution. In addition, the configuration files of Feed Service and other utilities contained in the distribution kit are also customized for easy integration with the SIEM solution.
For example, a distribution kit for Splunk contains all the Kaspersky CyberTrace components, and, in addition, has customized configuration files for Feed Service and Feed Utility that work with Splunk. The integration directory inside the distribution kit contains applications for all variants of Splunk integration schemes. These applications can be deployed and used in the Splunk infrastructure.
RPM and DEB distribution kits
This type of distribution kit contains the following files and directories.
Distribution kit contents (RPM and DEB package)
Item |
Description |
Doc_data/* |
Documentation files. |
Kaspersky_CyberTrace.html |
Offline version of documentation. |
Kaspersky_CyberTrace-Linux-%architecture%-%version%.rpm (RPM package) Kaspersky_CyberTrace-Linux-%architecture%-%version%.deb (DEB package) |
Kaspersky CyberTrace installation package. For a list of files inside this package, see subsection "Files contained in archives and packages (Linux)" below. |
legal_notices.txt |
Legal notices for the product. |
run.sh |
Installation script. |
ReleaseNotes.pdf |
Release notes. |
version_history.txt |
Changes made to the documentation. |
Executable installer distribution kit
This type of distribution kit contains the following files and directories.
Distribution kit contents (executable installer)
Item |
Description |
db/* |
Elasticsearch indicator database files. |
Doc_data/* |
Documentation files. |
index.html |
Offline version of documentation. |
Kaspersky_CyberTrace-Windows-%architecture-version%-Release_for_%SIEM%.exe |
Executable installer. For a list of files inside this package, see subsection "Files contained in archives and packages (Windows)" below. |
ReleaseNotes.pdf |
Release notes. |
legal_notices.txt |
Legal notices for the product. |
license.rtf |
End User License Agreement (EULA). |
version_history.txt |
Changes made to the documentation. |
Files contained in archives and packages (Linux)
RPM and DEB packages and TGZ archives contain the following set of files.
Files contained in archives and packages (Linux)
Item |
Description |
bin/.need_run_wizard |
Initial Setup Wizard. This file is deleted after the initial setup is done. |
bin/configure |
Configurator utility binary file. |
bin/en_US |
English localization files. |
bin/kl_feed_service |
Feed Service binary file. |
bin/kl_feed_service_log.conf |
Feed Service logging configuration file. |
bin/libssp.so.0 |
Auxiliary library. |
db/package/config/elasticsearch.yml |
Elasticsearch database configuration file. |
dmz/cron_dmz.sh |
Script for updating feeds from a separate computer. |
dmz/demofeeds.pem |
Certificate needed for getting access to demo feeds. |
dmz/feeds.pem |
Certificate needed for getting access to demo feeds. It is replaced with the certificate specified during the installation of Kaspersky CyberTrace. |
dmz/kl_feed_compiler |
Binary file used by Feed Utility to compile feeds. |
dmz/kl_feed_util |
Feed Utility binary file. |
dmz/kl_feed_util.conf |
Feed Utility configuration file. |
dmz/libssp.so.0 |
Auxiliary library. |
doc/Kaspersky_CyberTrace_Online_Documentation.html |
HTML page that redirects to the online documentation for Kaspersky CyberTrace. |
doc/legal_notices.txt |
Legal notices for the product. |
doc/license.txt |
End User License Agreement (EULA). |
etc/systemd/system/cybertrace.service |
Systemd unit file for Feed Service. |
etc/systemd/system/cybertrace_db.service |
Systemd unit file for Elasticsearch database service. |
etc/kl_feed_service.conf |
Feed Service configuration file. |
etc/kl_feed_service_templates.conf |
Configuration file template. |
etc/kl_feed_util.conf |
Feed Utility configuration file. |
feeds/APT_URL_Data_Feed.json.url.bin/* feeds/Botnet_CnC_URL_Data_Feed.json.url.bin/* feeds/Demo_Botnet_CnC_URL_Data_Feed.json.url.bin/* feeds/IoT_URL_Data_Feed.json.url.bin/* feeds/Malicious_URL_Data_Feed.json.url.bin/* feeds/Mobile_Botnet_CnC_URL_Data_Feed.json.url.bin/* feeds/Phishing_URL_Data_Feed.json.url.bin/* feeds/Ransomware_URL_Data_Feed.json.url.bin/* |
Compiled URL masks for feeds. |
feeds/Demo_Botnet_CnC_URL_Data_Feed.json feeds/Demo_IP_Reputation_Data_Feed.json feeds/Demo_Malicious_Hash_Data_Feed.json |
Demo feeds. |
feeds/APT_Hash_Data_Feed.json feeds/APT_IP_Data_Feed.json feeds/APT_URL_Data_Feed.json feeds/Botnet_CnC_URL_Data_Feed.json feeds/IoT_URL_Data_Feed.json feeds/IP_Reputation_Data_Feed.json feeds/Malicious_Hash_Data_Feed.json feeds/Malicious_URL_Data_Feed.json feeds/Mobile_Botnet_CnC_URL_Data_Feed.json feeds/Mobile_Malicious_Hash_Data_Feed.json feeds/Phishing_URL_Data_Feed.json feeds/Ransomware_URL_Data_Feed.json feeds/Vulnerability_Data_Feed.json feeds/ICS_Hash_Data_Feed.json |
Files for performing verification test for commercial feeds. These files are replaced by actual commercial feeds when updated. |
httpsrv/etc/kl_feed_info.conf |
File that contains information about Kaspersky Threat Data Feeds. |
httpsrv/etc/ktfsaccess |
File that contains information about CyberTrace accounts. |
httpsrv/etc/ktfsstatistics.kvdb |
Auxiliary file for Kaspersky CyberTrace Web. This file is not contained in the distribution kit, but is created during the work of Kaspersky CyberTrace. |
httpsrv/etc/ktfsstorage.kvdb |
File that contains information about open sessions and tasks in progress. This file is not contained in the distribution kit, but is created later during the work of Kaspersky CyberTrace. |
httpsrv/etc/osint_feed_list.conf |
File that contains the list of the supported OSINT feeds. |
httpsrv/templates/* |
Directory that contains templates for Kaspersky CyberTrace Web. |
httpsrv/templates_kuma |
Directory that contains Kaspersky CyberTrace Web templates for the KUMA integration. |
integration/* |
Files for integration with a particular SIEM solution. For a list of these files, see "Integration files" subsections below. |
log_scanner/libssp.so.0 |
Auxiliary library. |
log_scanner/log_scanner |
Log Scanner binary file. |
log_scanner/log_scanner.conf |
Log Scanner configuration file. |
scripts/cron_cybertrace.sh |
Script for updating feeds when Feed Service and Feed Utility are installed on different computers. |
tools/kl_access_util |
Password Utility. |
tools/kl_feed_compiler |
Binary file used by Feed Utility to compile feeds. |
tools/kl_feed_util |
Feed Utility binary file. |
tools/libssp.so.0 |
Auxiliary library. |
tools/openssl |
OpenSSL binary file. |
tools/openssl.cnf |
OpenSSL configuration file. |
tools/output/feeds.info |
Auxiliary file. |
verification/kl_verification_test_leef.txt |
Events for the verification test, in LEEF format. |
verification/kl_verification_test_cef.txt |
Events for the verification test in, CEF format. |
gcc-version |
Version of GCC. |
platform |
Version of the GLIBC library. |
ReleaseNotes.pdf |
Release notes. |
version |
Product version. |
Files contained in archives and packages (Windows)
Executable installers contain the following set of files.
Files contained in archives and packages (Windows)
Item |
Description |
bin\.need_run_wizard |
Initial Setup Wizard. This file is deleted after the initial setup is done. |
bin\en_US |
English localization files. |
bin\kl_control.bat |
Script for managing Feed Service. |
bin\kl_feed_service.conf |
Feed Service configuration file. |
bin\kl_feed_service.exe |
Feed Service binary file. |
bin\kl_feed_service_log.conf |
Logging configuration file. |
bin\kl_feed_service_templates.conf |
Configuration file template. |
bin\kl_feed_util.conf |
Feed Utility configuration file. |
bin\kl_watchdog_service.exe |
Binary file of the Windows service that monitors the Feed Service process. |
db\package\config\elasticsearch.yml |
Elasticsearch database configuration file. |
dmz\cron_dmz.cmd |
Script for updating feeds from a separate computer. |
dmz\demofeeds.pem |
Certificate required for access to demo feeds. |
dmz\feeds.pem |
Certificate required for access to demo feeds. It is replaced with the certificate specified during installation of Kaspersky CyberTrace. |
dmz\kl_feed_compiler.exe |
Binary file used by Feed Utility to compile feeds. |
dmz\kl_feed_util.conf |
Feed Utility configuration file. |
dmz\kl_feed_util.exe |
Feed Utility binary file. |
doc\Kaspersky_CyberTrace_Online_Documentation.html |
HTML page that redirects to the online documentation for Kaspersky CyberTrace. |
doc\legal_notices.txt |
Legal notices for the product. |
doc\license.rtf |
End User License Agreement (EULA). |
feeds\APT_URL_Data_Feed.json.url.bin\* feeds\Botnet_CnC_URL_Data_Feed.json.url.bin\* feeds\Demo_Botnet_CnC_URL_Data_Feed.json.url.bin\* feeds\IoT_URL_Data_Feed.json.url.bin\* feeds\Malicious_URL_Data_Feed.json.url.bin\* feeds\Mobile_Botnet_CnC_URL_Data_Feed.json.url.bin\* feeds\Phishing_URL_Data_Feed.json.url.bin\* feeds\Ransomware_URL_Data_Feed.json.url.bin\* |
Compiled URL masks for feeds. |
feeds\Demo_Botnet_CnC_URL_Data_Feed.json feeds\Demo_IP_Reputation_Data_Feed.json feeds\Demo_Malicious_Hash_Data_Feed.json |
Demo feeds. |
feeds\APT_Hash_Data_Feed.json feeds\APT_IP_Data_Feed.json feeds\APT_URL_Data_Feed.json feeds\Botnet_CnC_URL_Data_Feed.json feeds\IoT_URL_Data_Feed.json feeds\IP_Reputation_Data_Feed.json feeds\Malicious_Hash_Data_Feed.json feeds\Malicious_URL_Data_Feed.json feeds\Mobile_Botnet_CnC_URL_Data_Feed.json feeds\Mobile_Malicious_Hash_Data_Feed.json feeds\Phishing_URL_Data_Feed.json feeds\Ransomware_URL_Data_Feed.json feeds\Vulnerability_Data_Feed.json feeds\ICS_Hash_Data_Feed.json |
Files for performing verification test for commercial feeds. These files are replaced by actual commercial feeds when updated. |
httpsrv\etc\kl_feed_info.conf |
File that contains information about Kaspersky Threat Data Feeds. |
httpsrv\etc\ktfsaccess |
File that contains information about CyberTrace accounts. |
httpsrv\etc\ktfsstatistics.kvdb |
Auxiliary file for Kaspersky CyberTrace Web. This file is not contained in the distribution kit, but is created during the work of Kaspersky CyberTrace. |
httpsrv\etc\ktfsstorage.kvdb |
File that contains information about open sessions and tasks in progress. This file is not contained in the distribution kit, but is created during the work of Kaspersky CyberTrace. |
httpsrv\etc\osint_feed_list.conf |
File that contains the list of the supported OSINT feeds. |
httpsrv\templates\* |
Folder that contains templates for Kaspersky CyberTrace Web. |
httpsrv\templates_kuma |
Folder that contains Kaspersky CyberTrace Web templates for the KUMA integration. |
integration\* |
Files for integration with a particular SIEM solution. For a list of these files, see "Integration files" subsections below. |
log_scanner\log_scanner.conf |
Log Scanner configuration file. |
log_scanner\log_scanner.exe |
Log Scanner binary file. |
scripts\cron_cybertrace.cmd |
Script for updating feeds when Feed Service and Feed Utility are installed on different computers. |
tools\kl_access_util.exe |
Password Utility. |
tools\kl_feed_compiler.exe |
Binary file used by Feed Utility to compile feeds. |
tools\kl_feed_util.exe |
Feed Utility binary file. |
tools\openssl.cnf |
OpenSSL configuration file for generating a self-signed certificate. |
tools\openssl.exe |
OpenSSL binary file. |
verification\kl_verification_test_leef.txt |
Events for the verification test in LEEF format. |
verification\kl_verification_test_cef.txt |
Events for the verification test in CEF format. |
install.bat |
Batch script that installs Windows services for Kaspersky CyberTrace. |
ReleaseNotes.pdf |
Release notes. |
uninstall.bat |
Batch script that uninstalls Windows services for Kaspersky CyberTrace. |
version |
A text file containing the product version. |
Integration files (Splunk)
Integration files for Splunk are described in the following table.
Integration files (Splunk)
Item |
Description |
/integration/splunk/Kaspersky-CyberTrace-App-for-Splunk.tar.gz |
Kaspersky CyberTrace App for Splunk application file for the single-instance integration scheme. |
/integration/splunk/Kaspersky-CyberTrace-App-for-Splunk_Forwarder.tar.gz |
Kaspersky CyberTrace App for Splunk Forwarder application file for the distributed integration scheme. |
/integration/splunk/Kaspersky-CyberTrace-App-for-Splunk_Search-Head.tar.gz |
Kaspersky CyberTrace App for Splunk Search Head application file for the distributed integration scheme. |
Integration files (ArcSight)
Integration files for ArcSight are described in the following table.
Integration files (ArcSight)
Item |
Description |
integration/arcsight/Kaspersky_CyberTrace_Connector.arb |
Kaspersky CyberTrace Connector ARB file for ArcSight. |
Integration files (QRadar)
Integration files for QRadar are described in the following table.
Integration files (QRadar)
Item |
Description |
integration/qradar/sample_initiallog.txt |
A log example for the first transmission of events to QRadar. |
integration/qradar/sample_qid.txt |
An example list of QIDs for importing to QRadar. |
Integration files (RSA NetWitness)
Integration files for RSA NetWitness are described in the following table.
Integration files (RSA NetWitness)
Item |
Description |
integration/rsa/additional_elements/CyberTrace_Charts.zip |
File that contains preconfigured charts. |
integration/rsa/additional_elements/CyberTrace_Reports.zip |
File that contains a preconfigured report. |
integration/rsa/additional_elements/CyberTrace_Rules.zip |
File that contains rules to operate the events from Feed Service. |
integration/rsa/additional_elements/index-concentrator-custom.xml |
Example of data that can be added to the index-concentrator-custom.xml file. This data example contains only a description of the kl actionable fields. |
integration/rsa/additional_elements/Kaspersky CyberTrace.zip |
File for creating the Kaspersky CyberTrace dashboard in RSA NetWitness 11.0. |
integration/rsa/additional_elements/Kaspersky+CyberTrace.cfg |
File for creating the Kaspersky CyberTrace dashboard in RSA NetWitness 10.6. |
integration/rsa/additional_elements/MetaGroups.jsn |
File that contains a meta group that is used for browsing fields in RSA NetWitness that are filled by Feed Service. |
integration/rsa/additional_elements/MetaGroups_without_kl_fields.jsn |
Metagroup for the Navigate tab. This metagroup does not contain the |
integration/rsa/additional_elements/table-map-custom.xml |
Example of data that can be added to the table-map-custom.xml file. This data example contains only a description of the |
integration/rsa/cybertrace/cybertrace.ini |
File used for integrating Kaspersky CyberTrace with RSA NetWitness. |
integration/rsa/cybertrace/v20_cybertracemsg.xml |
File used for integrating Kaspersky CyberTrace with RSA NetWitness |
Integration files (LogRhythm)
Integration files for LogRhythm are described in the following table.
Integration files (LogRhythm)
Item |
Description |
integration/logrhythm/events/* |
Files that contain KasperskyCyberTrace rules for importing to LogRhythm:
|
Part 1: Installing Kaspersky CyberTrace
These sections describe how to install Kaspersky CyberTrace on Linux or Windows systems.
Installation on Linux systems
This section describes the process of installing Kaspersky CyberTrace on Linux systems.
After installation, make sure that only users with administrator rights have access to the folder where Kaspersky CyberTrace is installed.
We also recommend that you install and run anti-virus software before installing Kaspersky CyberTrace.
Installation methods
On Linux systems, you can install Kaspersky CyberTrace by three methods:
- RPM installation
In this type of installation, you run the installation script,
run.sh. The installation script installs the RPM package and runs the configurator. The configurator generates certificates for Kaspersky CyberTrace Web and configures the Elasticsearch indicator database. - DEB installation
The same as RPM installation.
- TGZ installation
In this type of installation, you manually unpack the TGZ archive to the
/opt/kaspersky/ktfsdirectory and create symbolic links for configuration files and startup scripts. You must then manually run the configurator binary file and accept the End User License Agreement.If you do not run the configurator after performing the TGZ installation, Kaspersky CyberTrace will not work. You must accept the End User License Agreement.
RPM installation
Kaspersky CyberTrace is installed in the /opt/kaspersky/ktfs directory. This directory is called %service_dir% in this document.
The user account that performs the RPM installation must have root privileges.
To perform the RPM installation of Kaspersky CyberTrace:
- Unpack the distribution kit contents to any directory on your system. In the following command, substitute
%temp_dir%with this directory and%VERSION%with the version of the installation package.tar -C %temp_dir% -xvzf Kaspersky_CyberTrace-Linux-x86_64-%VERSION%-Release-RPM.tar.gz --no-same-ownerThe RPM package, installation script, and documentation will be unpacked to this directory.
The archive can have a different name, for example,
%SIEM%-rpm.tar.gz. You can either use the existing name or rename the archive by using themvcommand. - Run the installation script:
./run.sh installThe installation script will install the RPM package and add Feed Service to the list of services by using
chkconfig. Feed Service will start automatically on system boot.After the RPM package is installed, the installation script automatically runs the configurator.
- In the configurator, accept the End User License Agreement.
For more information about using the configurator, see the section "Interactive setup with the configurator" below.
If you interrupt the configuration process, you can resume it by running the following command:
/opt/kaspersky/ktfs/bin/configure –i. - Perform the post-installation configuration by using the Initial Setup Wizard.
DEB installation
Kaspersky CyberTrace is installed in the /opt/kaspersky/ktfs directory. This directory is called %service_dir% in this document.
The user account that performs the DEB installation must have root privileges.
To perform the DEB installation of Kaspersky CyberTrace:
- Unpack the distribution kit contents to any directory on your system. In the following command, substitute
%temp_dir%with this directory and%VERSION%with the version of the installation package.tar -C %temp_dir% -xvzf Kaspersky_CyberTrace-Linux-x86_64-%VERSION%-Release-DEB.tar.gz --no-same-ownerThe DEB package, installation script, and documentation will be unpacked to this directory.
The archive can have a different name, for example,
%SIEM%-deb.tar.gz. You can either use the existing name or rename the archive by using themvcommand. - Run the installation script:
./run.sh installThe installation script will install the DEB package and add Feed Service to the list of services started on boot by
systemd. Feed Service will start automatically on system boot. - After the DEB package is installed, the installation script automatically runs the configurator.
- In the configurator, accept the End User License Agreement.
For more information about using the configurator, see the section "Interactive setup with the configurator" below.
If you interrupt the configuration process, you can resume it by running the following command:
/opt/kaspersky/ktfs/bin/configure –i. - Perform the post-installation configuration by using the Initial Setup Wizard.
TGZ installation
To perform the TGZ installation of Kaspersky CyberTrace:
- Unpack the archive. The directory to which you unpack the archive is called
%service_dir%in this document. To do this, run the following command:tar -C %service_dir% -xvzf Kaspersky_CyberTrace-Linux-x86_64-%VERSION%-Release.tar.gz --strip-components=1 - Create the cybertrace_db account for the database service and set its login shell to
/bin/nologin:id -u cybertrace_db > /dev/null 2>&1 || useradd -M cybertrace_db -d %service_dir%/db -s /sbin/nologin - Make cybertrace_db the owner of the database directory:
chown -R cybertrace_db %service_dir%/db - Increase the system limit on the maximum number of memory regions allocated to a process:
echo 'vm.max_map_count=262144' > /etc/sysctl.d/98-elasticsearch.conf && sysctl --system - Increase the limit on the maximum number of open files:
echo -e "cybertrace_db\t-\tnofile\t65535" > /etc/security/limits.d/10-cybertrace.conf - Create a symlink for the database service:
ln -s $%service_dir%/etc/systemd/system/cybertrace_db.service /etc/systemd/system/cybertrace_db.service - Create a symlink for the Kaspersky CyberTrace service:
ln -s $%service_dir%/etc/systemd/system/cybertrace.service /etc/systemd/system/cybertrace.service - Reload the systemd daemon to make it reread the list of services:
systemctl daemon-reload - Allow Kaspersky CyberTrace databases and services in systemd:
systemctl enable cybertrace_db.service && systemctl enable cybertrace.service - Run the configurator:
%service_dir%/bin/configure -i - Launch Kaspersky CyberTrace service:
systemctl start cybertrace - Perform the post-installation configuration by using the Initial Setup Wizard.
Interactive setup with the configurator
To perform the interactive setup with the configurator:
- In the configurator, accept the End User License Agreement:
Use the PAGE UP and PAGE DOWN keys to navigate. Type q to quit.
To accept the End User License Agreement, print
Yes. - If the configurator does not automatically determine ports for Kaspersky CyberTrace Web and the Elastic database, specify this information.
- After that, Kaspersky CyberTrace will be launched. Two links will be displayed:
- Link to the Kaspersky CyberTrace web user interface.
- Link to the Kaspersky CyberTrace documentation, where you can find the credentials for logging into Kaspersky CyberTrace Web.
Configurator command-line parameters
The configurator is a binary file that configures and runs Kaspersky CyberTrace.
The file has the following command-line syntax:
configure [options]
The following options are available:
-h [ --help ]Display a
helpmessage and exit.-i [ --install ]Perform the initial configuration of Kaspersky CyberTrace.
-c [ --change ]Update the certificate used for Kaspersky CyberTrace Web.
Installation on Windows systems
This section describes the process of installing Kaspersky CyberTrace on Windows systems.
After installation, make sure that only users with administrator rights have access to the folder where Kaspersky CyberTrace is installed.
We also recommend that you install and run anti-virus software before installing Kaspersky CyberTrace.
Installation methods
On Windows systems, you can install Kaspersky CyberTrace by running an executable installer. During the installation process, the installer generates certificates for Kaspersky CyberTrace Web and configures the Elasticsearch indicator database.
To install Kaspersky CyberTrace by using an executable installer:
- Make sure that the computer you plan to use for running Feed Service meets the hardware and software requirements.
- Make sure that the computer can send events to the computer on which a SIEM solution is installed and can receive events from the SIEM computer.
- Run the .exe file of the executable installer.
You must run the executable installer from the Administrator account.
As an option, you can specify the
/accepteulaparameter when you run the .exe file. In this case, the installer performs the installation without requiring any input. You can use this option only if you have read and accepted the End User License Agreement (EULA). A document with the End User License Agreement (EULA) is provided in the Distribution kit. We recommend installing Kaspersky CyberTrace without using this option. - Accept the End User License Agreement (EULA).
If you continue the installation, Kaspersky CyberTrace is installed to
C:\Program Files\Kaspersky Lab\Kaspersky CyberTrace. This folder is called%service_dir%in this document. - Kaspersky CyberTrace Web will be launched. The check box and the link to Kaspersky CyberTrace Web will be displayed:
- By default, you will be directed to the Kaspersky CyberTrace Web page after installation. Clear this check box if you do not want to go to the web user interface.
- Click the Kaspersky CyberTrace documentation link to find the credentials that are used to log on to Kaspersky CyberTrace Web.
To configure Kaspersky CyberTrace after it is installed:
- Perform the post-installation configuration by using the Initial Setup Wizard.
- Verify that everything is in working order. See subsection "Checking that the components of Kaspersky CyberTrace are running" below.
Perform the following procedure only if you cannot configure Kaspersky CyberTrace using Kaspersky CyberTrace Web.
To configure Kaspersky CyberTrace by editing its configuration files:
- Select the feeds that must be downloaded and processed by Feed Utility:
- In the
%service_dir%\bin\kl_feed_util.conffile, find the feeds that you want to download and process. - For each of the feeds, find the following attribute:
enabled="false" - For each of the feeds, change the value of the attribute to
true:enabled="true"
- In the
- Specify the feeds that must not be processed by Feed Service:
- In the
%service_dir%\bin\kl_feed_service.conffile, find the feeds that you will not use. - For each of the feeds, find the following attribute:
enabled="true" - For each of the feeds, change the value of the attribute to
false:enabled="false"
The lists of the enabled feeds in the Feed Utility configuration file and the Feed Service configuration file must be the same.
- In the
- Specify the IP address and port (or the Windows-named pipe) to which Feed Service will send outgoing events in the
OutputSettings>ConnectionStringelement of the Feed Service configuration file. - Specify the IP address and port (or the Windows-named pipe) that Feed Service will listen on for incoming events in the
InputSettings>ConnectionStringelement of the Feed Service configuration file. - If you want to use Log Scanner, specify the IP address and port (or the Windows-named pipe) that the utility will use to interact with Feed Service in the
Connectionelement of the Log Scanner configuration file.The Log Scanner configuration file is located at
%service_dir%\log_scanner\log_scanner.conf. - If you have a commercial certificate for downloading feeds, replace the
%service_dir%\dmz\feeds.pemdemo certificate with your commercial certificate. - If you want Feed Utility to access Kaspersky servers through a proxy server, specify the proxy setting by running the utility with the
--set-proxyoption:kl_feed_util --set-proxy 'user:pass@proxy.example.com:3128' -c ..\bin\kl_feed_util.conf - If you have a commercial license key, you can add it to Kaspersky CyberTrace by copying it to the
%service_dir%\httpsrv\licdirectory. - If you want to use normalizing rules to process the events sent by various sources or if you want to use custom regular expressions to parse the events, add the
<Source>elements with normalizing rules and custom regular expressions to the Feed Service configuration file. - Restart Feed Service by running the
%service_dir%\bin\kl_control.batfile as Administrator.
Checking that the components of Kaspersky CyberTrace are running
To check whether the components of Kaspersky CyberTrace are running:
Run the kl_control.bat script with the status option as Administrator. The result displayed in the console must be similar to that depicted in the figure below.
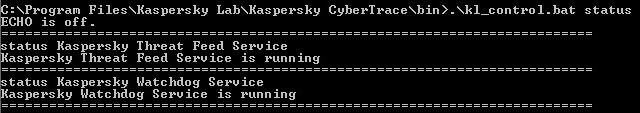
kl_control.bat output
If the result of these commands is not similar to the information displayed in the figures, contact your technical account manager (ТАМ) for assistance.
Page topPost-installation configuration (Initial Setup Wizard)
This section explains how to configure Kaspersky CyberTrace by using the Initial Setup Wizard.
The Initial Setup Wizard is a sequence of web interface pages where you configure Kaspersky CyberTrace after it is installed. Once the wizard is completed, other pages of the web interface become available.
The wizard has the following pages:
- SIEM selection
On this page, you must select your SIEM. The choice of a SIEM solution at this step affects the format of the Kaspersky CyberTrace configuration files, since these files are customized for integration with a particular SIEM solution.
For the full list of supported SIEMs, see the subsection "Supported SIEM solutions" of the "Tenants settings" section.
- Connection settings
On this page, you must specify connection parameters for your SIEM.
- Proxy server configuration
On this page, you can specify proxy settings. This step is optional.
- Licensing configuration
On this page, you can specify paths to the license key file and the certificate file. This step is optional.
- Feeds selection
On this page, you must specify the required feeds.
Navigating to the Initial Setup Wizard
To navigate to the Initial Setup Wizard:
- Open Kaspersky CyberTrace Web in your browser at
https://127.0.0.1. - Log in to Kaspersky CyberTrace Web by using the default credentials.
Selecting a SIEM
To select your SIEM:
- Choose a SIEM.
The default parameters for this SIEM will be displayed on the page.
- Click Next to proceed to the next page.
Configuring connection parameters
To specify connection parameters for your SIEM:
- Specify the connection parameters that Kaspersky CyberTrace will use for incoming events:
- Select what type of connection you want to use.
- In the IP address and Port fields, specify an IP address and port.
- In the UNIX socket field, specify a UNIX socket.
- Specify an IP address and port that Kaspersky CyberTrace will use for outgoing events.
- Specify an IP address or hostname to be used in Kaspersky CyberTrace events as the external address of the web interface.
- Click Next to proceed to the next page.
Configuring a proxy server
To specify proxy server parameters:
- Select Use proxy server.
- In the IP address or hostname field, specify a proxy server IP address or host.
- In the Proxy port field, specify a proxy server port.
- If needed, select Use proxy credentials.
- If you choose to use proxy credentials, specify the following:
- In the User name field, specify a user name to access the proxy server
- In the Password field, specify a password to access the proxy server
- Click Next to proceed to the next page.
Configuring licensing
To import the license key and the certificate:
- In the Kaspersky CyberTrace license key field, specify a path to the license key file.
This field is optional.
- In the Kaspersky Threat Data Feeds certificate field, specify a path to the certificate file.
This field is optional.
- Click Next to proceed to the next page.
Selecting feeds
To specify the required feeds:
- Select the feeds that you want to use.
- Click Next.
When the initial setup is complete, you will be asked to refer to the Kaspersky CyberTrace documentation. The displayed links are intended to be used for the following actions:
- Integrate Kaspersky CyberTrace with your SIEM solution
- Configure additional tenants
- Explore the Administrator guides section
To finish the initial setup wizard, click Close.
Page topPart 2: Integrating Kaspersky CyberTrace with an event source
At this step, you must integrate Kaspersky CyberTrace with an event source. An event source can be either one of the SIEM solutions or a standalone event source.
Kaspersky CyberTrace supports integration with the following SIEM solutions:
- Integration steps (Splunk)
- Integration steps (ArcSight)
- Integration steps (QRadar)
- Integration steps (RSA NetWitness)
- Integration steps (LogRhythm)
- KUMA
Integrations with other SIEM solutions are available. For more information, see https://support.kaspersky.com/datafeeds.
Integration with Splunk
This chapter describes how to integrate Kaspersky CyberTrace with Splunk.
Integration steps (Splunk)
This chapter describes how to integrate Kaspersky CyberTrace with Splunk.
About the integration schemes
Kaspersky CyberTrace can be integrated with Splunk in two integration schemes:
- Single-instance integration scheme
In the single-instance integration scheme, Feed Service and the Splunk instance are configured to work on the same computer or on different computers.
- Distributed integration scheme
In the distributed integration scheme, you install Feed Service, Search Head App, and Forwarder App in your distributed Splunk environment and configure the service and the apps to interact with each other.
How to integrate Kaspersky CyberTrace with Splunk in the single-instance integration mode
To integrate Kaspersky CyberTrace with Splunk in the single-instance integration mode:
- Make sure that you have installed Kaspersky CyberTrace.
In the single-instance integration scheme, Kaspersky CyberTrace and the Splunk instance are installed on the same computer or on different computers. By default, Kaspersky CyberTrace App for Splunk is configured to be installed on the same computer with Kaspersky CyberTrace. However, we recommend that you install Kaspersky CyberTrace on a separate computer; in this case, Feed Service must be configured during the installation, and Kaspersky CyberTrace App for Splunk must be configured in step 2 (below).
- Step 1. Install Kaspersky CyberTrace App for Splunk.
- Step 2 (optional). Configure Kaspersky CyberTrace App for Splunk.
This step is optional. If you skip this step, Kaspersky CyberTrace App for Splunk will use the default configuration. Email alerts will not be sent in this case.
By default, Kaspersky CyberTrace App for Splunk uses port
9999to send events to Kaspersky CyberTrace and port9998to receive events from Kaspersky CyberTrace. If these ports are used by another application, you must configure either Kaspersky CyberTrace App for Splunk or the other application to use different ports. - Step 3 (optional). Configure the lookup script.
This step is optional. If you skip this step, the lookup script will use the default configuration.
- Step 4. Perform the verification test.
Please make sure you perform the verification test before editing any matching process settings.
How to integrate with Splunk in the distributed integration mode
To integrate Kaspersky CyberTrace with Splunk in the distributed integration mode:
- Make sure that you have installed Kaspersky CyberTrace.
In the distributed deployment scheme, you can install Kaspersky CyberTrace on one of the computers that has Forwarder or Indexer already installed, or on a separate computer.
In the distributed deployment scheme, you must configure Feed Service during the installation to receive events from other Splunk entities such as heavy forwarders and indexers, and send its own events to the indexer that stores the index used by Kaspersky CyberTrace App for Splunk.
- Step 1. Install Forwarder App and Search Head App.
- Step 2. Configure Forwarder App and Search Head App so that they can interact with each other and forward events to Kaspersky CyberTrace.
- Step 3 (optional). Configure the lookup script.
This step is optional. If you skip this step, the lookup script will use the default configuration.
- Step 4. Perform the verification test.
Please make sure you perform the verification test before editing any matching process settings.
Single-instance integration (Splunk)
This section contains instructions for integrating Kaspersky CyberTrace and Splunk in the single-instance integration scheme.
About the single-instance integration scheme
By default, both Feed Service and Kaspersky CyberTrace App use the following integration scheme. This scheme is the single-instance integration scheme.
About apps and services
The single instance integration scheme uses one app and one service:
- Feed Service
This service matches Splunk events against Kaspersky Threat Data Feeds.
Feed Service sends the resulting events to Splunk. Splunk stores the events from Feed Service in the
mainindex. - Kaspersky CyberTrace App
This app contains Kaspersky CyberTrace App dashboards, alert templates, and a lookup script. The app also contains parsing rules for Feed Service events and rules for forwarding events from Splunk to Feed Service.
Single-instance integration scheme
In the single-instance integration scheme, Splunk Apps and Feed Service work on the same computer by default (IP address is 127.0.0.1). Kaspersky CyberTrace App receives input on port 3000 and forwards it to Feed Service on port 9999. Feed Service then returns matches to Kaspersky CyberTrace App on port 9998.
If you want to install Feed Service on a separate computer, you must specify addresses and ports used by Feed Service and Kaspersky CyberTrace App when installing Kaspersky CyberTrace.
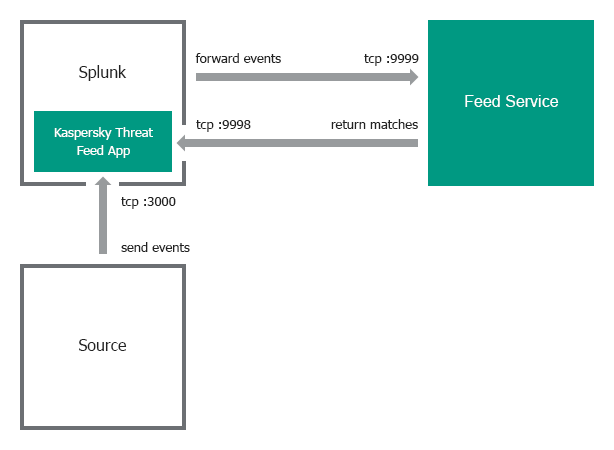
Single-instance integration scheme
Event format
By default, Kaspersky CyberTrace App and Feed Service receive events in a certain format:
- Feed Service uses regular expressions from its configuration file to parse events. You can view and configure these regular expressions on the Settings > Matching tab in Kaspersky CyberTrace Web. These regular expressions parse a specific format of inbound data. For example, the default regular expression for URLs matches strings that contains a protocol (for example,
http://orhttps://). If URLs in the events that come from your devices do not contain protocols, you must change the regular expression. - The lookup script that comes with Kaspersky CyberTrace App sends events to Feed Service in a format that matches the regular expressions used by Feed Service. When you change the regular expressions, edit the lookup script so that it uses a format that matches the new regular expressions.
Step 1. Installing Kaspersky CyberTrace App (single-instance deployment)
This section describes the process of installing Kaspersky CyberTrace App.
Kaspersky CyberTrace App is installed from the %service_dir%/integration/splunk/Kaspersky-CyberTrace-App-for-Splunk.tar.gz file.
Installing the app
To install Kaspersky CyberTrace App:
- In Splunk Web, go to the home page.
- On the home page, click the Manage Apps button.
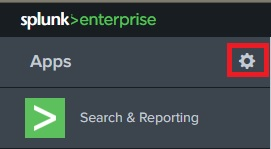
Manage Apps button
- On the Apps page, click the Install app from file button.

Install app from file button
- In the Upload an app window, click Choose File and select the Kaspersky CyberTrace App application file.
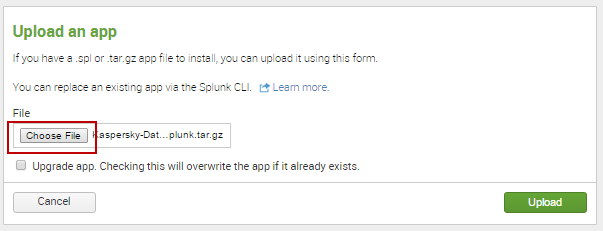
Choose File button
- In the Upload an app window, click the Upload button.
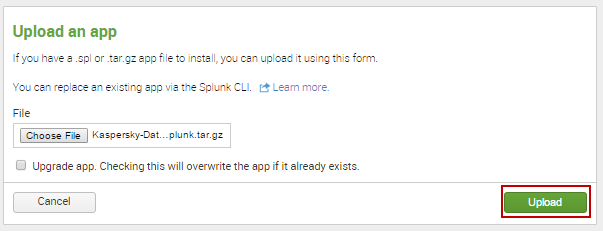
Upload button
- In the Restart required window, click the Restart Splunk button.
This step can be skipped, depending on the Splunk version. If Splunk does not display the Restart required window, skip this step.
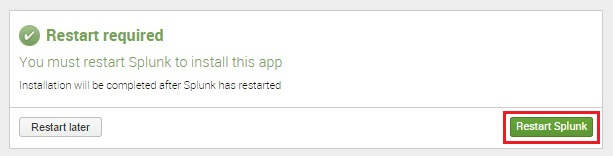
Restart Splunk button
- When Splunk starts again, the Apps page will open with information about the successful installation of Kaspersky CyberTrace App. Kaspersky CyberTrace App will appear in the list of apps on the Splunk home page.
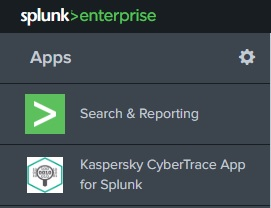
Kaspersky CyberTrace App for Splunk in the list of apps
Step 2 (optional). Configuring Kaspersky CyberTrace App (single-instance deployment)
Kaspersky CyberTrace App reads its parameters from the configuration files. These configuration files define input settings, output settings, and the event format used by Kaspersky CyberTrace App.
Restart Splunk after you have made changes to the Kaspersky CyberTrace App configuration files.
Edit only those Kaspersky CyberTrace App configuration files that are described in this section. Editing other Kaspersky CyberTrace App configuration files may result in unpredictable behavior.
About the configuration files
The following configuration files can be used to configure Kaspersky CyberTrace App ($SPLUNK_HOME is the Splunk installation directory):
$SPLUNK_HOME/etc/apps/Kaspersky-CyberTrace-App-for-Splunk/default/commands.confThis configuration file specifies the command for the lookup script.
$SPLUNK_HOME/etc/apps/Kaspersky-CyberTrace-App-for-Splunk/default/inputs.confThis configuration file specifies the Kaspersky CyberTrace App input settings. This includes ports and addresses for data from event sources and for incoming detection events from Feed Service.
$SPLUNK_HOME/etc/apps/Kaspersky-CyberTrace-App-for-Splunk/default/outputs.confThis configuration file specifies the parameters for forwarding events to Feed Service.
$SPLUNK_HOME/etc/apps/Kaspersky-CyberTrace-App-for-Splunk/default/props.confThis configuration file specifies the parameters for processing input data.
$SPLUNK_HOME/etc/apps/Kaspersky-CyberTrace-App-for-Splunk/default/savedsearches.confThis configuration file specifies the parameters for alert templates.
Default commands.conf file
This file specifies the lookup script that Kaspersky CyberTrace App will use when the user runs the klsearch command.
Below, you can view the default contents of the commands.conf configuration file.
[klsearch] filename = kl_search.py |
Default inputs.conf file
This file specifies input settings for Kaspersky CyberTrace App.
By default, Kaspersky CyberTrace App does the following:
- It receives detection events from Feed Service at address
:9998. - It receives data from sources at address
:3000(and then forwards it to address127.0.0.1:9999, which is specified in outputs.conf).
Below, you can view the default contents of the inputs.conf configuration file.
[tcp://:9998] _INDEX_AND_FORWARD_ROUTING=local connection_host = dns index = main sourcetype = kl_cybertrace_events source = tcp:9998 disabled = false
[tcp://:3000] _TCP_ROUTING = service9999 |
Default outputs.conf file
This file specifies the output settings for Kaspersky CyberTrace App.
By default, Kaspersky CyberTrace App forwards data from the address :3000 to the Feed Service at the address 127.0.0.1:9999. The input port (:3000) is specified in inputs.conf.
Below, you can view the default contents of the outputs.conf configuration file.
[tcpout] defaultGroup = noforward disabled = false
[indexAndForward] index=true
[tcpout:service9999] disabled=false server = 127.0.0.1:9999 sendCookedData = false |
Default props.conf file
This file specifies how Splunk processes incoming data.
By default, Kaspersky CyberTrace App does the following:
- It defines how time stamps are extracted from incoming data.
- It defines a delimiter (line breaker) between events for incoming data.
For example, if the incoming data has the sequence
"%data_1%\n\n%data_2%"and the line breaker is one or more\nsymbols, Splunk splits this sequence into two events (%data_1%and%data_2%).
Below, you can view the default contents of the props.conf configuration file.
[source::tcp:3000] TIME_PREFIX = ^ MAX_TIMESTAMP_LOOKAHEAD = 17 TIME_FORMAT = %b %d %H:%M:%S LINE_BREAKER = ([\n]+) SHOULD_LINEMERGE = false
[source::tcp:9998] TIME_PREFIX = ^ MAX_TIMESTAMP_LOOKAHEAD = 17 TIME_FORMAT = %b %d %H:%M:%S LINE_BREAKER = ([\n]+) SHOULD_LINEMERGE = false |
Managing event sources
You can change the port Kaspersky CyberTrace App listens on for incoming events from a source, or add new event sources.
To change the port Kaspersky CyberTrace App listens on for incoming events from a source:
- In inputs.conf, change the default port number
3000to the port number that you want.For example, if you want to change
3000to3010, the record in inputs.conf looks like the following:[tcp://:3010]
_TCP_ROUTING = service9999
- In props.conf, also change the default port number 3000 to the port number that you want.
For example, if you want to change
3000to3010, the record in props.conf looks like the following:[source::tcp:3010]
TIME_PREFIX = ^
MAX_TIMESTAMP_LOOKAHEAD = 17
TIME_FORMAT = %b %d %H:%M:%S
LINE_BREAKER = ([\n]+)
SHOULD_LINEMERGE = false
- Restart Splunk.
To add a new event source:
- In inputs.conf, specify a new event source that uses the
service9999TCP routing rule.All data from this input will be forwarded to Feed Service.
- In props.conf, specify how data from this source must be processed.
- Restart Splunk.
Make sure that data from the new event source matches the regular expressions used by Kaspersky CyberTrace.
Below is an example of adding the address :3001 as the event source; it specifies that data from :3001 must be processed as are other input data in the default integration scheme (in this scheme, the forwarder, indexer, and search head are installed on a single computer).
# to inputs.conf [tcp://:3001] _TCP_ROUTING = service9999
# to props.conf [source::tcp:3001] TIME_PREFIX = ^ MAX_TIMESTAMP_LOOKAHEAD = 17 TIME_FORMAT = %b %d %H:%M:%S LINE_BREAKER = ([\n]+) SHOULD_LINEMERGE = false |
Changing the address and port for data from Feed Service
By default, Kaspersky CyberTrace App is configured to receive data from Feed Service at port 9998 at any available address. This is specified in the inputs.conf configuration file of Kaspersky CyberTrace App. If you want to receive data from Feed Service only at a specific address and port (for example, if Splunk has access to several network interfaces), edit the inputs.conf file accordingly.
Use the following rules to specify the address and port where data from Feed Service must be received by Kaspersky CyberTrace App:
- If Feed Service and Splunk are located on the same computer, use the following format to specify the port where data from Feed Service must be received by Kaspersky CyberTrace App:
[tcp://127.0.0.1:<port>] - If Feed Service and Splunk are located on different computers, use the following format to specify the address and port where data from Feed Service must be received by Kaspersky CyberTrace App:
[tcp://<address>:<port>] - To specify that Kaspersky CyberTrace App will receive data from Feed Service at any available address, use the following format:
[tcp://:<port>]Note that this format can affect security, because Kaspersky CyberTrace App will receive information at the specified port of every available network interface.
In the format examples above, <address> and <port> are the IP address and port that Kaspersky CyberTrace App will listen on for incoming data from Feed Service.
You may also have to change the addresses and ports for outbound events used by Kaspersky CyberTrace.
Below are examples of specifying the address and port where data from Feed Service is to be received.
In the following example, Feed Service and Splunk are located on the same computer. Kaspersky CyberTrace App receives detection events at port 9998 port of that same computer.
[tcp://127.0.0.1:9998] _INDEX_AND_FORWARD_ROUTING=local connection_host = dns index = main sourcetype = kl_cybertrace_events source = tcp:9998 disabled = false |
In the following example, Feed Service and Splunk are located on different computers. Kaspersky CyberTrace App receives detection events from Feed Service at address 192.0.2.42:9997.
[tcp://192.0.2.42:9997] _INDEX_AND_FORWARD_ROUTING=local connection_host = dns index = main sourcetype = kl_cybertrace_events source = tcp:9997 disabled = false |
In the following example, Kaspersky CyberTrace App receives detection events from Feed Service at port 3000 of any available address.
[tcp://:3000] _INDEX_AND_FORWARD_ROUTING=local connection_host = dns index = main sourcetype = kl_cybertrace_events source = tcp:3000 disabled = false |
Configuring alert templates
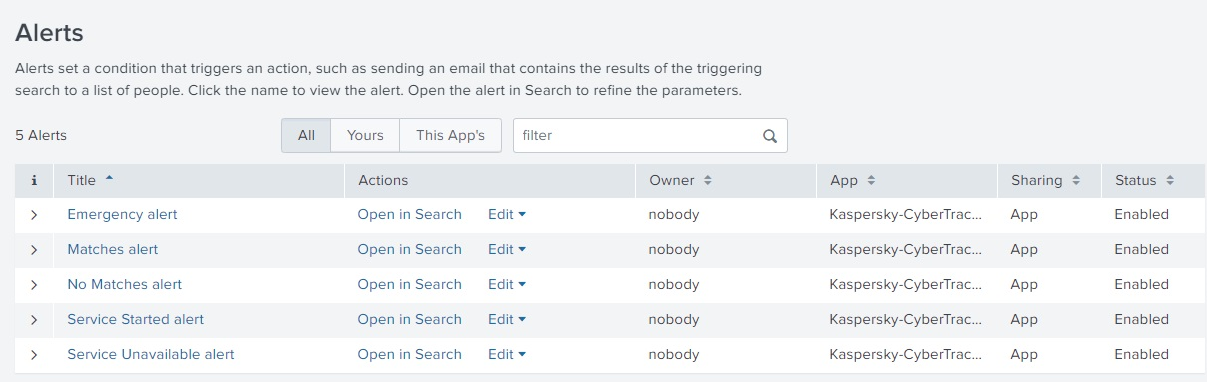
Kaspersky CyberTrace App comes with several alert templates that you can use and customize from the Alerts dashboard.
The following alert templates are available:
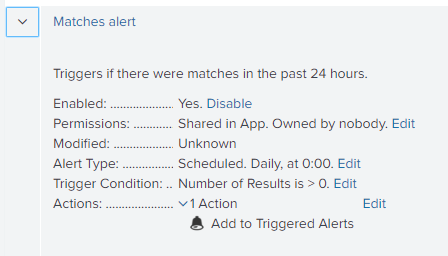
- Matches alert
This alert is triggered if there were matches with Kaspersky Threat Data Feeds in the past 24 hours.
- No Matches alert
This alert is triggered if there were no matches with Kaspersky Threat Data Feeds in the past 24 hours.
- Emergency alert
This alert is triggered if there were 5000 matches with Kaspersky Threat Data Feeds in the course of one minute.
- Service Unavailable alert
This alert is triggered if Feed Service is unavailable.
- Service Started alert
This alert is triggered when Feed Service is started.
Following are the default Kaspersky CyberTrace App settings:
- All of the alerts included in Kaspersky CyberTrace App are turned on.
To turn them off, use the Alerts dashboard.
- The "Add to Triggered Alerts" action is defined for all alerts.
Splunk will display the alert in Triggered Alerts.
To enable email notifications for alerts:
- In Kaspersky CyberTrace App, open Alerts.
- Expand the parameters of an alert that you want to configure.
- Locate the Actions field, and then click Edit.
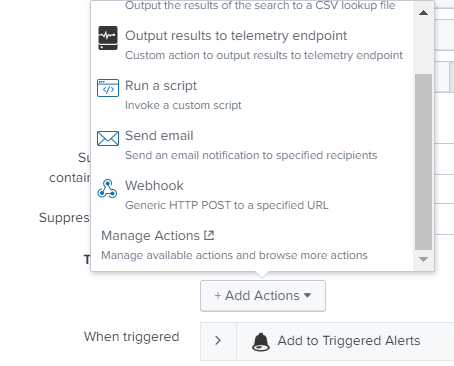
- Under Trigger Actions, click Add Actions.
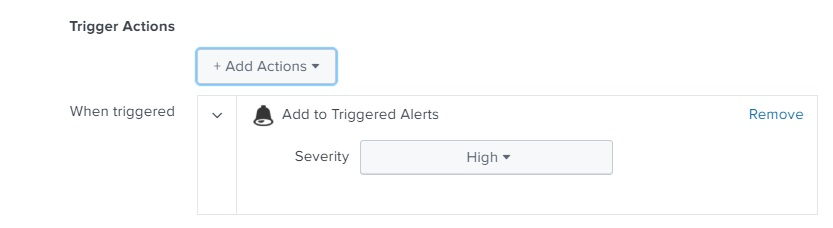
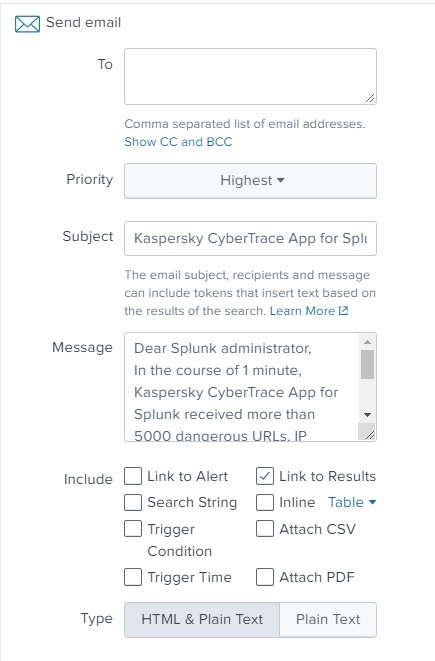
- From the list of options, select Send email.
- Enter the email message parameters and save the changes.
Step 3 (optional). Configuring the lookup script (single-instance deployment)
The lookup script is used to match individual URLs, IP addresses, and hashes to Kaspersky Threat Data Feeds. It can be invoked from the Indicators lookup tab in Kaspersky CyberTrace App.
To configure the lookup script:
- In Kaspersky CyberTrace App, go to the Indicators lookup tab.
- Specify Kaspersky CyberTrace connection strings:
- In the Kaspersky CyberTrace address field, specify the IP address of Kaspersky CyberTrace
- In the Kaspersky CyberTrace port field, specify the port that Kaspersky CyberTrace uses
The script is ready for use.
Page topStep 4. Performing the verification test (Splunk, single-instance integration)
This section explains how to check the capabilities of Kaspersky CyberTrace by performing the verification test.
Please make sure you perform the verification test before editing any matching process settings.
About the verification test
The verification test is a procedure that is used to check the capabilities of Kaspersky CyberTrace and to confirm the accuracy of the integration.
During this test you will check whether events from Splunk are received by Feed Service, whether events from Feed Service are received by Splunk, and whether events are correctly parsed by Feed Service using the regular expressions.
This section describes the verification scenario for the default integration scheme (in this scheme, the forwarder, indexer, and search head are installed on a single computer), but you can also use the verification test after changes were made to the configuration parameters to check that Kaspersky CyberTrace and the SIEM solution work correctly.
Verification test file
The %service_dir%/verification/kl_verification_test_cef.txt file is a verification test file. It contains a collection of events with URLs, IP addresses, and hashes.
Verification test scenario
To perform the verification test:
- Specify the Feed Service address in the Log Scanner utility configuration file.
- Send the verification file to Feed Service by using the Log Scanner utility.
If you run the Log Scanner utility, you cannot erase test data from the index.
- Compare the verification test results with the target numbers displayed on the Kaspersky CyberTrace Matches dashboard.
- Perform the Self-test.
The Self-test is an automatic feed test performed by Kaspersky CyberTrace App.
- Optionally, clear Splunk of events that arrived when the verification test was being performed.
Verification test scenario
The verification test scenario proceeds in stages:
Stage 1. Specifying the Feed Service address in the Log Scanner configuration file
Specify the address and port that Feed Service listens on in the Connection element of the Log Scanner configuration file.
Stage 2. Sending the verification file to Feed Service
You must send the verification file to Feed Service by using the Log Scanner utility.
Before you send the file, make sure that Feed Service is running.
The following commands send the contents of the kl_verification_test_cef.txt file to Feed Service:
- In Linux:
./log_scanner -p ../verification/kl_verification_test_cef.txt - In Windows:
log_scanner.exe -p ..\verification\kl_verification_test_cef.txt
After receiving data from Log Scanner, Feed Service sends the test results to Splunk. The address of Splunk is specified in the Service settings of Kaspersky CyberTrace. Also, this address is specified during the installation or reconfiguration of Kaspersky CyberTrace.
Stage 3. Checking the verification test results
In this step, you must verify that URLs, IP addresses, and hashes are processed correctly by Kaspersky CyberTrace App.
To check the verification test results:
- In Kaspersky CyberTrace App, on the navigation bar select Kaspersky CyberTrace Matches.
The Kaspersky CyberTrace Matches Dashboard opens.
- Compare numbers in the Matches by eventName panel to the numbers of the detected objects in the table shown below.
The verification test results depends on the feeds you use. The following table summarizes target numbers for the verification test when all commercial feeds are used.
Verification test results (commercial feeds)
Feed used
eventName value
Detected objects
Malicious URL Data Feed
KL_Malicious_URL
http://fakess123.nu
http://badb86360457963b90faac9ae17578ed.com
Phishing URL Data Feed
KL_Phishing_URL
http://fakess123ap.nu
http://e77716a952f640b42e4371759a661663.com
Botnet CnC URL Data Feed
KL_BotnetCnC_URL
http://fakess123bn.nu
http://a7396d61caffe18a4cffbb3b428c9b60.com
IP Reputation Data Feed
KL_IP_Reputation
192.0.2.0
192.0.2.3
Malicious Hash Data Feed
KL_Malicious_Hash_MD5
FEAF2058298C1E174C2B79AFFC7CF4DF
44D88612FEA8A8F36DE82E1278ABB02F
C912705B4BBB14EC7E78FA8B370532C9
Mobile Malicious Hash Data Feed
KL_Mobile_Malicious_Hash_MD5
60300A92E1D0A55C7FDD360EE40A9DC1
Mobile Botnet CnC URL Data Feed
KL_Mobile_BotnetCnC_Hash_MD5
001F6251169E6916C455495050A3FB8D
Mobile Botnet CnC URL Data Feed
KL_Mobile_BotnetCnC_URL
http://sdfed7233dsfg93acvbhl.su/steallallsms.php
Ransomware URL Data Feed
KL_Ransomware_URL
http://fakess123r.nu
http://fa7830b4811fbef1b187913665e6733c.com
Vulnerability Data Feed
KL_Vulnerable_File_Hash_MD5
D8C1F5B4AD32296649FF46027177C594
APT URL Data Feed
KL_APT_URL
http://b046f5b25458638f6705d53539c79f62.com
APT Hash Data Feed
KL_APT_Hash_MD5
7A2E65A0F70EE0615EC0CA34240CF082
APT IP Data Feed
KL_APT_IP
192.0.2.4
IoT URL Data Feed
KL_IoT_URL
http://e593461621ee0f9134c632d00bf108fd.com/.i
ICS Hash Data Feed
KL_ICS_Hash_MD5
7A8F30B40C6564EFF95E678F7C43346C
The following table summarizes target numbers for the verification test when only demo feeds are used.
Verification test results (demo feeds)
Feed used |
eventName value |
Detected objects |
DEMO Botnet_CnC_URL_Data_Feed |
KL_BotnetCnC_URL |
http://5a015004f9fc05290d87e86d69c4b237.com http://fakess123bn.nu |
DEMO IP_Reputation_Data_Feed |
KL_IP_Reputation |
192.0.2.1 192.0.2.3 |
DEMO Malicious_Hash_Data_Feed |
KL_Malicious_Hash_MD5 |
776735A8CA96DB15B422879DA599F474 FEAF2058298C1E174C2B79AFFC7CF4DF 44D88612FEA8A8F36DE82E1278ABB02F |
Stage 4. Performing the Self-test
The Self-test is an automatic feed test performed by Kaspersky CyberTrace App using the lookup script. You must verify that results of this test are correct.
To perform a Self-test:
- In Kaspersky CyberTrace App, on the navigation bar select Kaspersky CyberTrace Status.
The Kaspersky CyberTrace Status dashboard opens.
- For all the feeds that you use, check the
statusvalues in the Self-test panel:- If you use only demo feeds, the value for demo feeds must be
OKand values for all other feeds must beFALSE. - If you use commercial feeds, the value for all feeds that you use must be
OK. All other values including values for demo feeds must beFALSE.
- If you use only demo feeds, the value for demo feeds must be
The following figure shows an example of a Self-test results for commercial feeds. In this example, all commercial feeds are used, and demo feeds are not used. The value for demo feeds is FALSE, as expected.
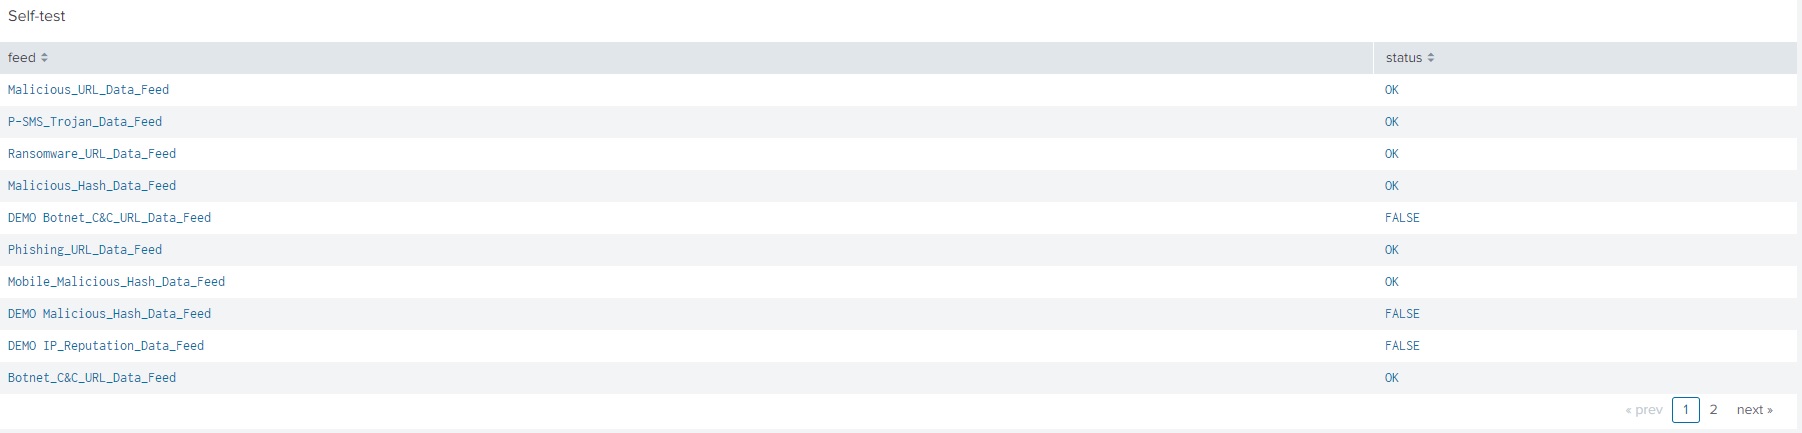
Self-test results
Stage 5 (optional). Clearing Splunk of events received when the verification test was performed
To clear Splunk of events received from Kaspersky CyberTrace when the verification test was performed:
- On the Search dashboard of the Splunk GUI, click the Search & Reporting button to run the Search & Reporting app.
- Delete the events from Kaspersky CyberTrace:
- In the Search field, type the following command:
index="main" sourcetype="kl_cybertrace_events" | delete - Click the All time split button next to the Search field.
If the split button has another name, click it and in the drop-down list select All time.
- Click Search (
 ).
).

Search & Reporting app
- In the Search field, type the following command:
Distributed integration scheme (Splunk)
This section contains instructions for integrating Kaspersky CyberTrace and Splunk in the distributed integration scheme.
For a description of the integration process, see Integration guide (Splunk).
For a description of distributed integration scheme, see About the distributed integration scheme.
About the distributed integration scheme
Kaspersky CyberTrace supports distributed Splunk environments. The integration scheme for distributed Splunk environments is called the distributed integration scheme.
About the apps and services used in the distributed integration scheme
In the distributed integration scheme, Kaspersky CyberTrace is divided into two apps and one service:
- Feed Service
This service matches Splunk events against Kaspersky Threat Data Feeds.
Feed Service sends the resulting events to a single indexer that keeps the index with events from Kaspersky CyberTrace.
This service can be installed on a separate computer.
- Kaspersky CyberTrace App Search Head (or Search Head App)
This app contains Kaspersky CyberTrace App dashboards, alert templates, and the lookup script.
This app is intended for installation on a Splunk instance that acts as a search head and sends search requests to the indexer that keeps the index with events from Kaspersky CyberTrace.
- Kaspersky CyberTrace App Forwarder (or Forwarder App)
This app contains rules for forwarding events from Splunk to Feed Service. It also receives events from Feed Service.
This app is intended for installation on Splunk instances that must forward events to Feed Service.
About the integration scheme variants
The following variants of the distributed integration scheme demonstrate a general approach to integrating Kaspersky CyberTrace with your distributed Splunk environment. Depending on how your distributed Splunk environment is organized, you may have to change or combine these variants.
One indexer, multiple forwarders variant
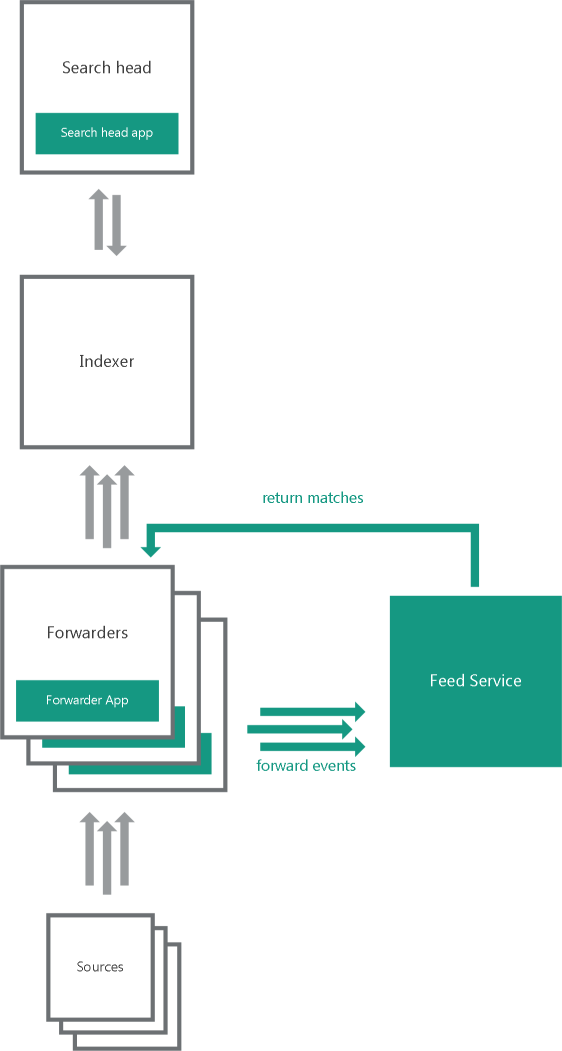
One indexer, multiple forwarders
In the one indexer, multiple forwarders variant, several heavy forwarders parse and send events directly to Feed Service. These forwarders must use Forwarder App. One of the forwarders receives matches from Feed Service. The forwarders send the matches to the indexers that store them in the index used by Kaspersky CyberTrace for Splunk Search Head App.
Multiple indexers, multiple forwarders variant
In the multiple indexers, multiple forwarders variant, several heavy forwarders parse and send events directly to Feed Service. These forwarders must use Forwarder App. One of the forwarders receives matches from Feed Service. The forwarders send the matches to the indexers that store them in the index used by Kaspersky CyberTrace App.
Default ports and addresses
By default, Forwarder App and Feed Service are configured to use certain addresses and ports for forwarding events and receiving matches. You must change these addresses and ports based on the organization of your distributed Splunk environment.
You must change the default addresses and ports that are used by Forwarder App and Feed Service.
By default, Forwarder App:
- Receives events at
:3000port. - Receives events from Kaspersky CyberTrace at
:9998port. These events are stored in themainindex. - Forwards events to
127.0.0.1:9999.
By default, Feed Service does the following:
- Receives events at
127.0.0.1:9999. - Sends its own events to
127.0.0.1:9998.
Event format
By default, Kaspersky CyberTrace App and Feed Service are configured to receive events in a certain format:
- Feed Service parses events with regular expressions defined in its configuration file (the regular expressions are also displayed in Kaspersky CyberTrace Web). These regular expressions are created for a specific format of inbound data. For example, the default regular expression for URLs will match a URL containing the protocol (for example, HTTP, HTTPS). If the URLs in the events generated by your devices do not contain the procotol, change the regular expression accordingly.
- The lookup script that comes with Kaspersky CyberTrace App (or Search Head App in the case of the distributed integration scheme) sends events to Feed Service in a format that matches the regular expressions used by Feed Service.
Step 1. Installing Forwarder and Search Head apps
In the distributed deployment scheme, you must install Forwarder App and Search Head App on the basis of the organization of your distributed Splunk environment. For more information about how to choose the computers where the apps must be installed, see the section about the distributed integration scheme.
Forwarder App is installed from the %service_dir%/integration/splunk/Kaspersky-CyberTrace-App-for-Splunk_Forwarder.tar.gz file. Search Head App is installed from the %service_dir%/integration/splunk/Kaspersky-CyberTrace-App-for-Splunk_Search-Head.tar.gz file.
Installing the apps
Forwarder App and Search Head App are installed from Splunk Web. The only difference in the installation process is the application file name.
To install Forwarder App or Search Head App:
- Open Splunk Web for the Splunk instance where you want to install the app.
- In Splunk Web, go to the home page.
- On the home page, click the Manage Apps button.
Manage Apps button
- On the Apps page, click the Install app from file button.
Install app from file button
- In the Upload an app window, click Choose File and select the application file mentioned above in this section.
Choose File button
- In the Upload an app window, click the Upload button.
Upload button
- In the Restart required window, click the Restart Splunk button.
This step can be skipped, depending on the Splunk version. If Splunk does not display the Restart required window, skip this step.
Restart Splunk button
- When Splunk starts again, the Forwarder App will be displayed in the list of installed apps. When Kaspersky Search Head App is installed, the Apps page will open with information about the successful installation of Kaspersky Search Head App. Kaspersky Search Head App will appear in the list of apps on the Splunk home page.
Kaspersky Search Head App for Splunk in the list of apps
Step 2. Configuring Forwarder and Search Head apps (distributed deployment)
In the distributed deployment scheme, you must configure Forwarder App on the basis of the organization of your distributed Splunk environment. For example, the configuration changes may include changing the Feed Service address used by the apps, or adding new event sources for Forwarder App. For Search Head App, you may have to configure the email addresses for alerts.
Configuration actions for Forwarder App and Search Head App
For Forwarder App, you may have to do the following:
- Change the address and port for forwarding events to Feed Service. See subsection "Changing the address and port for forwarding data to Feed Service" below.
- Configure Forwarder App to send events to the Indexer (or multiple Indexers). By default, events that are sent from Forwarder App to Feed Service are not registered in the indexes. See subsection "Configuring Forwarder App to send events to indexes" below.
- If several Forwarder Apps are used, only one Forwarder App must receive events from Kaspersky CyberTrace at port
9998. For all other Forwarder Apps, disable this rule by specifyingtruein thedisabledparameter for this rule in the Forwarder App configuration file. The IP address and port of the Forwarder App that will receive events from Kaspersky CyberTrace must be specified on the Settings > Service tab in Kaspersky CyberTrace Web. - Add new event sources. See subsection "Adding new event sources" below.
For Search Head App, you may have to do the following:
- Add email addresses to alert templates. See "Adding email addresses to alert templates" below.
Restart Splunk after you make changes to the configuration files.
Edit only those Forwarder App and Search Head App configuration files that are described in this section. Editing other configuration files may result in unpredictable behavior.
Configuration files (distributed deployment)
The following table summarizes configuration files used by Forwarder App and Search Head App in the following distributed deployment scheme variants:
- One indexer, multiple forwarders
- Multiple indexers, multiple forwarders
Configuration files of Forwarder App and Search Head App
Application
Configuration file
Default rules
Forwarder App
\default\inputs.confReceives data from sources at port
3000and forwards it as configured inoutputs.conf.Receives events from Kaspersky CyberTrace at
:9998port.Forwarder App
\default\outputs.confForwards data to
127.0.0.1:9999(Feed Service address).Forwarder App
\default\props.confParse data received at
:3000. For a description of default data parsing rules, see "Default data parsing rules" below.Search Head App
\default\savedsearches.confRules for alert templates.
Default data parsing rules
The way in which Forwarder App parses incoming data is defined in the props.conf file. By default, Forwarder App does the following:
- Defines how time stamps are extracted from incoming data.
- Defines a delimiter (line breaker) between events for incoming data.
For example, if the incoming data has the sequence
"%data_1%\n\n%data_2%"and the line breaker is one or more\nsymbols, Splunk splits this sequence into two events (%data_1%and%data_2%).
The following are the default rules used by Forwarder App to parse incoming data.
TIME_PREFIX = ^ MAX_TIMESTAMP_LOOKAHEAD = 17 TIME_FORMAT = %b %d %H:%M:%S LINE_BREAKER = ([\n]+) SHOULD_LINEMERGE = false |
Changing the address and port for forwarding data to Feed Service
By default, Forwarder App is configured to forward data to Feed Service at 127.0.0.1:9999.
To change the address and port for forwarding data to Feed Service,
In the outputs.conf configuration file, in the [tcpout:service9999] section, specify the new address and port for the server parameter that will be used by Feed Service.
In the following example, 192.0.2.100:9999 is specified as the Feed Service address.
[tcpout:service9999] disabled=false server = 192.0.2.100:9999 sendCookedData = false |
Adding new event sources
To add new event sources, edit the inputs.conf and props.conf configuration files of the app.
To add a new event source:
- In inputs.conf, specify a new event source that uses the
service9999TCP routing rule.All data from this input will be forwarded to Feed Service.
- In props.conf, specify how data from this source must be processed.
- Restart Splunk.
Make sure that data from the new event source matches the regular expressions used by Kaspersky CyberTrace.
Below is an example of adding the address :3001 as the event source; it specifies that data from the address :3001 must be processed as other input data in the default integration scheme (in this scheme, the forwarder, indexer, and search head are installed on a single computer).
# to inputs.conf [tcp://:3001] _TCP_ROUTING = service9999
# to props.conf [source::tcp:3001] TIME_PREFIX = ^ MAX_TIMESTAMP_LOOKAHEAD = 17 TIME_FORMAT = %b %d %H:%M:%S LINE_BREAKER = ([\n]+) SHOULD_LINEMERGE = false |
If Splunk Forwarder is already configured for receiving events from different event sources and you want to send events to Feed Service, perform the following procedure. This can be done if the server field of the outputs.conf configuration file of Forwarder App contains the IP address and port that are specified in the InputSettings > ConnectionString element of the Feed Service configuration file.
To forward events to Feed Service:
- In the outputs.conf file that is used for forwarding events from Splunk (it can be either the outputs.conf file of a custom Splunk application or the
%SPLUNK_DIR%/etc/system/local/inputs.conffile), in thedefaultGroupfield, add a comma and a stringservice9999.In this case, check the event forwarding logic and make sure that events that arrived from Feed Service are not sent again to Feed Service by Splunk.
If the inputs.conf configuratioin file contains the
_TCP_ROUTINGparameter for those event sources, the events from which are sent to Feed Service, add a comma and theservice9999string to the_TCP_ROUTINGparameter. - Restart Splunk.
Configuring Forwarder App to send events to indexes
By default, events that are sent from Forwarder App to Feed Service are not registered in the indexes. You can change this behavior by configuring Forwarder App.
To configure Forwarder App to send events to the main index:
- Locate the Forwarder that you want to configure. This Forwarder is typically a machine with Forwarder App installed. You must configure all Forwarders that are used in your distributed integration scheme.
- On the Forwarder, in the
%SPLUNK_HOME%\etc\system\local\outputs.conffile, locate the name of the target group that is used for sending events to the Indexer (or multiple Indexers). Here%SPLUNK_HOME%is the Splunk installation directory.By default, the name of this group is default-autogroup-lb:
[tcpout: default-autogroup-lb] - In the
inputs.conffile used by the Forwarder App, locate the section withservice9999TCP routing rule:_TCP_ROUTING = service9999 - Add the name of the target group to this rule.
For example, if the name of the target group is default-autogroup-lb, the rule must be changed in the following way:
_TCP_ROUTING=service9999, default-autogroup-lb - Restart Splunk on the Forwarder.
Configuring alert templates
For more information about configuring alert templates, see "Configuring alert templates" in Step 2 (optional). Configuring Kaspersky CyberTrace App.
Page topStep 3 (optional). Configuring the lookup script (distributed deployment)
The lookup script is used to match individual URLs, IP addresses, and hashes to Kaspersky Threat Data Feeds. It can be invoked from the Indicators lookup tab in Kaspersky CyberTrace App for Search Head.
To configure the lookup script:
- In Kaspersky CyberTrace App, go to the Indicators lookup tab.
- Specify Kaspersky CyberTrace connection strings:
- In the Kaspersky CyberTrace address field, specify the IP address of Kaspersky CyberTrace
- In the Kaspersky CyberTrace port field, specify the port that Kaspersky CyberTrace uses
The script is ready for use.
Page topStep 4. Performing the verification test (Splunk, distributed integration)
The verification test for the distributed integration of Kaspersky CyberTrace with Splunk is performed in the same way as the verification test for the single-instance integration.
Page topIntegration with ArcSight
This chapter describes how to integrate Kaspersky CyberTrace with ArcSight.
Integration steps (ArcSight)
This chapter describes how to integrate Kaspersky CyberTrace with ArcSight products.
About the integration schemes
Kaspersky CyberTrace can be integrated with ArcSight in several integration schemes. For more information about the integration schemes for ArcSight, see Integration schemes (ArcSight).
How to integrate with ArcSight
To integrate Kaspersky CyberTrace with ArcSight:
- Before you install Kaspersky CyberTrace, make sure that ArcSight SmartConnector is installed.
- Make sure that you have installed Kaspersky CyberTrace.
- Import the Kaspersky_CyberTrace_Connector.arb package.
- Install ArcSight Forwarding Connector using one of two options:
- Configure Kaspersky CyberTrace for interaction with ArcSight.
- Perform the verification test.
Please make sure you perform the verification test before editing any matching process settings.
Before you begin (ArcSight)
ArcSight SmartConnector must be installed before you install Kaspersky CyberTrace. This section describes how to install ArcSight SmartConnector.
Installing ArcSight SmartConnector (Linux)
This section describes how to install ArcSight SmartConnector.
To install ArcSight SmartConnector:
- Run the ArcSight SmartConnector installation application.
This application is a component of HP ArcSight and is not included in Kaspersky CyberTrace.
- Select the ArcSight SmartConnector installation directory (hereinafter referred to as
%ARCSIGHT_HOME%). - Instruct the installer not to create links.
- After the contents of the binary file are unpacked, select Add a Connector.
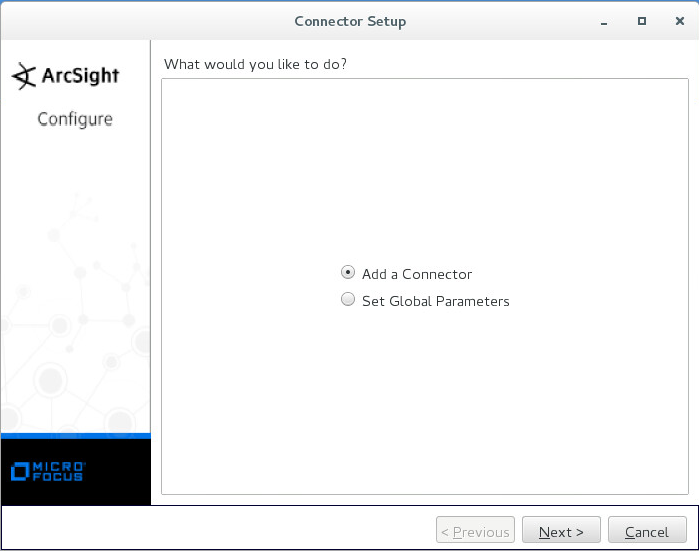
Adding a connector
If this window is not displayed, configure ArcSight SmartConnector manually. For this purpose, run the following command:
%ARCSIGHT_HOME%/current/bin/runagentsetup.sh - Select Syslog Daemon as the connector type.
- In the Enter the parameter details form, specify the following data:
- Network Port—Port to which Feed Service will send detection events.
It is the same port that is specified on the Settings > Service tab of Kaspersky CyberTrace Web (by default, it is
9998). - IP Address—IP address to which Feed Service will send detection events.
It is the same IP address that is specified on the Settings > Service tab of Kaspersky CyberTrace Web (by default, it is
127.0.0.1).You can specify
(ALL)if you want Arcsight SmartConnector to receive events from all network interfaces of the computer on which it runs. (Note that you cannot specify(ALL)in the Feed Service configuration file.) - Protocol—Specify
Raw TCP. - Forwarder—Specify
false.
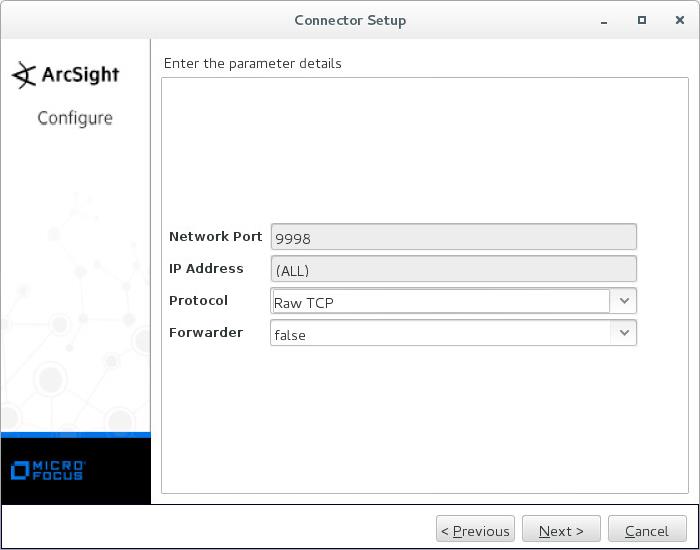
Parameters for sending detection events
Click Next.
- Network Port—Port to which Feed Service will send detection events.
- Specify ArcSight Manager (encrypted) as the type of destination.
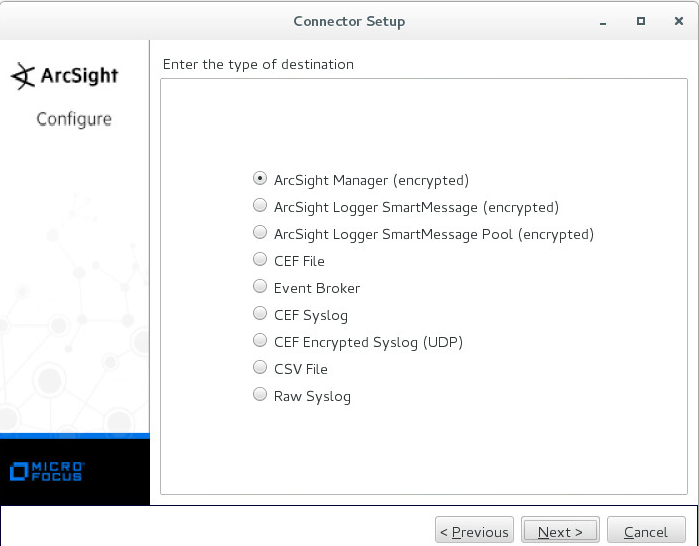
Type of destination
Click Next.
- Specify other destination settings:
- Manager Hostname—Host where ArcSight Manager is running.
- Manager Port—Port where ArcSight Manager is available.
By default, it is 8443.
- User—Name of the ArcSight ESM user that has rights for registering the connector.
- Password—Password of the ArcSight ESM user.
- AUP Master Destination—Specify false.
- Filter Out All Events—Specify false.
- Enable Demo CA—Specify false.
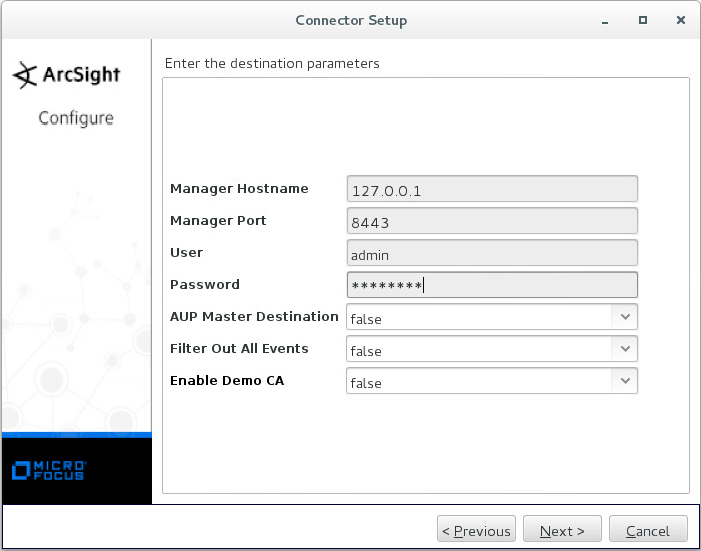
Destination parameters
Click Next.
- Specify the connector details: the name (arbitrary value permitted), location (arbitrary value permitted), location of the device that will send events to the connector (arbitrary value permitted, can be empty), and comment about the connector (arbitrary value permitted, can be empty).
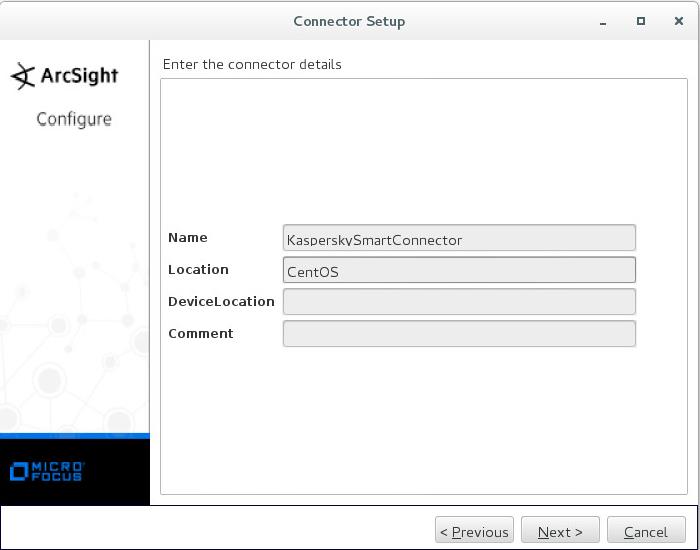
Connector details
Click Next.
- If the ArcSight Manager parameters are valid, accept importing the certificate from the destination.
- If the certificate is imported successfully, install the ArcSight SmartConnector service.
- If you do not run the installation as root, a warning will be displayed.
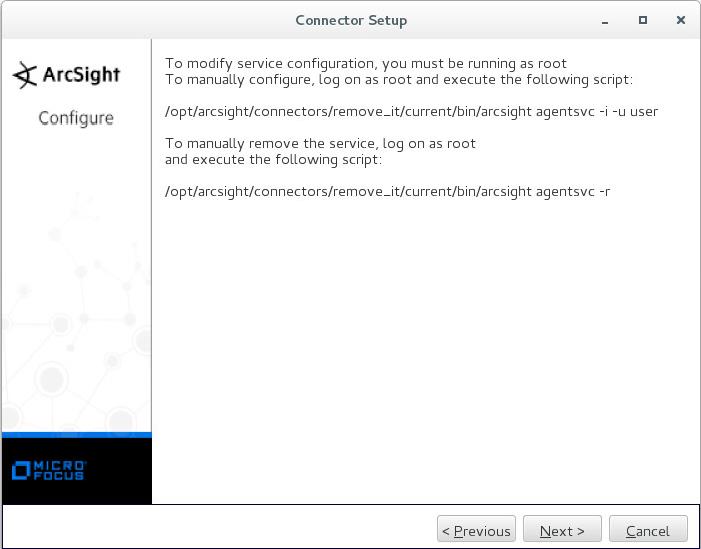
Warning about user privileges
You can either run the Connector Setup Wizard as root, or run the following command as root:
%ARCSIGHT_HOME%/current/bin/arcsight agentsvc -i -u $username -sn $service_nameHere
$usernameis the name of the operating system user that will run the service.$service_nameis the service name.We recommend that you set the service name to be the same as the connector name.
The
%ARCSIGHT_HOME%/current/logs/agent.loglog file will contain messages about the installation process.Skip the next step that describes how to specify the service parameters.
- If you run the installation as root, select Install as a service.
Click Next.
- Specify the service parameters.
We recommend that you set the service name to be the same as the connector name.
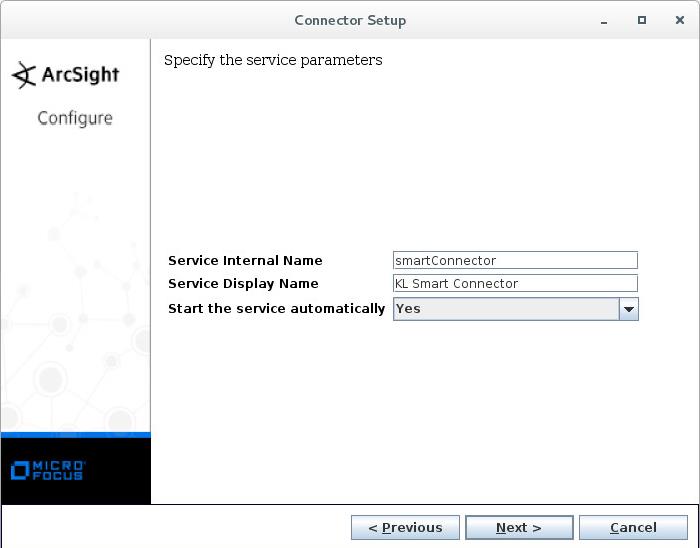
Specifying service parameters
Click Next.
- Start ArcSight SmartConnector by calling the following command:
/etc/init.d/arc_$service_name startIn this command,
$service_nameis the service name.
After you have installed ArcSight SmartConnector, you can install Feed Service and integrate it with ArcSight. For more information, see Integration steps (ArcSight).
Page topInstalling ArcSight SmartConnector by using the console (Linux)
You can install ArcSight SmartConnector on Linux by using the console instead of the GUI installer.
To install ArcSight SmartConnector by using the console:
- In the console, run the ArcSight SmartConnector installer.
- Read the Introduction section and press Enter.
- When prompted, select Choose Install Folder, and type the full path to the directory where ArcSight SmartConnector will be installed (
%ARCSIGHT_HOME%).The default value of the installation directory is
/root/ArcSightSmartConnectors. - When prompted, select Choose Link Location, and specify whether a link to the installation directory must be created.
We recommend that you specify
Don't create links. - Make sure that the Pre-Installation Summary section lists the correct values of the installation settings. Press Enter if the values are correct.
After ArcSight SmartConnector is installed, the following information will be displayed in the console:
Installation Complete---------------------The core components of the ArcSight SmartConnector have been successfully installed to:%ARCSIGHT_HOME%To finish the configuration of the SmartAgent, please go to the folder:%ARCSIGHT_HOME%/current/bin/and execute the script:./runagentsetup.sh - Run
%ARCSIGHT_HOME%/current/bin/runagentsetup.sh. - Run
Add a Connector. - Specify
Syslog Daemonas the connector type. - Specify the following settings of the connector:
- Network Port
Specify the port to which Feed Service sends events. This port is specified on the Settings > Service tab of Kaspersky CyberTrace Web (by default, it is
9998). - IP Address
Specify the IP address to which Feed Service sends events. This IP address is specified on the Settings > Service tab of Kaspersky CyberTrace Web (by default, it is
127.0.0.1).You can specify
ALLif you want Arcsight SmartConnector to receive events from all network interfaces of the computer on which it runs. (Note that you cannot specifyALLin the Feed Service configuration file.) - Protocol
Specify
Raw TCP. - Forwarder
Specify
false.
- Network Port
- Specify
ArcSight Manager (encrypted)as the destination type. - Specify whether to mask passwords.
It is recommended to specify
yes. - Specify the following connection settings of ArcSight Manager:
- Manager Hostname
ArcSight Manager host.
- Manager Port
ArcSight Manager port. By default, it is
8443. - User
Name of the user that has the right to register a connector in ArcSight.
- Password
Password of the specified user.
- AUP Master Destination
Specify
False. - Filter Out All Events
Specify
False. - Enable Demo CA
Specify
False.
- Manager Hostname
- Specify the following connector settings:
- Name
Arbitrary value can be specified.
- Location
Arbitrary value can be specified.
- DeviceLocation
Arbitrary value can be specified.
- Comment
Arbitrary value can be specified.
After this, the connector will be registered.
- Name
- Specify the following action for importing the certificate:
Import the certificate to connector from destination. - Make sure that the displayed data to check is correct.
If correct data is displayed, type
yes. - Specify how the connector must be installed:
Install as a service. - Specify the service settings:
- Service Internal Name
- Service Display Name
- Start the service automatically
Indicates whether the service will start on the system startup. We recommend that you specify
yes.
- Check the specified data. If it is correct, press Enter.
The connector will be installed as a service.
- Start the connector by calling the following command:
/etc/init.d/arc_$service_name startIn this command,
$service_nameis the service internal name that you specified.
After you have installed ArcSight SmartConnector, you can install Kaspersky CyberTrace and integrate it with ArcSight.
Page topInstalling ArcSight SmartConnector (Windows)
This section describes how to install ArcSight SmartConnector on Windows.
To install ArcSight SmartConnector:
- Run the ArcSight SmartConnector installation application.
This application is a component of HP ArcSight and is not included in Kaspersky CyberTrace.
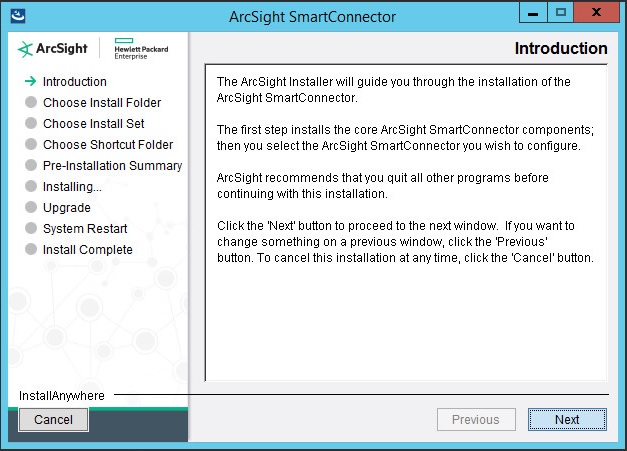
SmartConnector installation: Introduction
- Select the ArcSight SmartConnector installation folder (hereinafter referred to as
%ARCSIGHT_HOME%).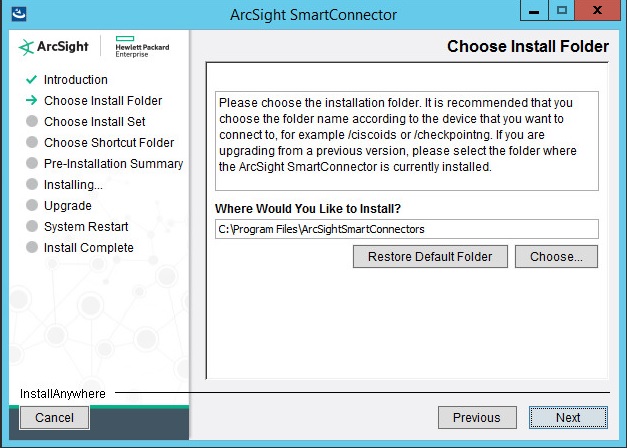
Choosing an installation folder
- Set the installation type to Typical.
- Select the location where a shortcut for the connector will be created.
You can also choose not to create icons.
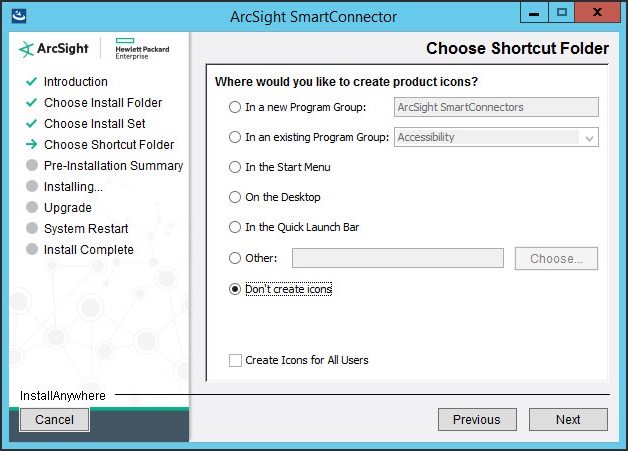
Choosing a shortcut folder
- After the contents of the binary file are unpacked, click Add a Connector.
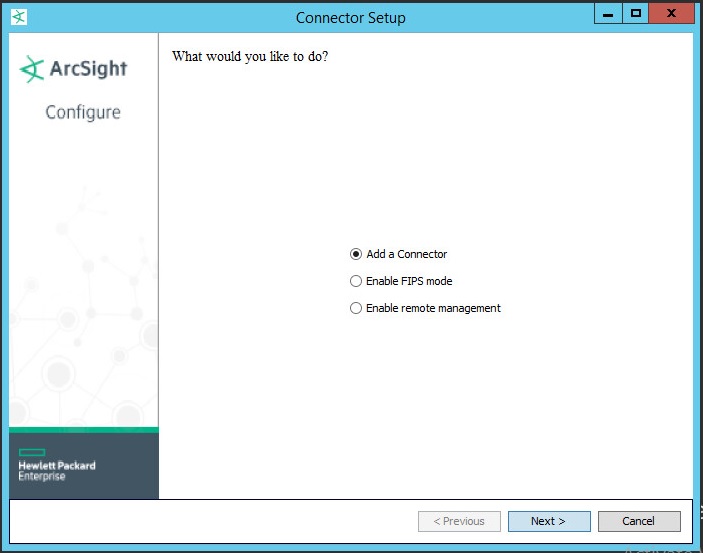
Adding a connector
If this window is not displayed, configure ArcSight SmartConnector manually. For this purpose, run the following command:
%ARCSIGHT_HOME%\current\bin\runagentsetup.bat - Select Syslog Daemon as the connector type.
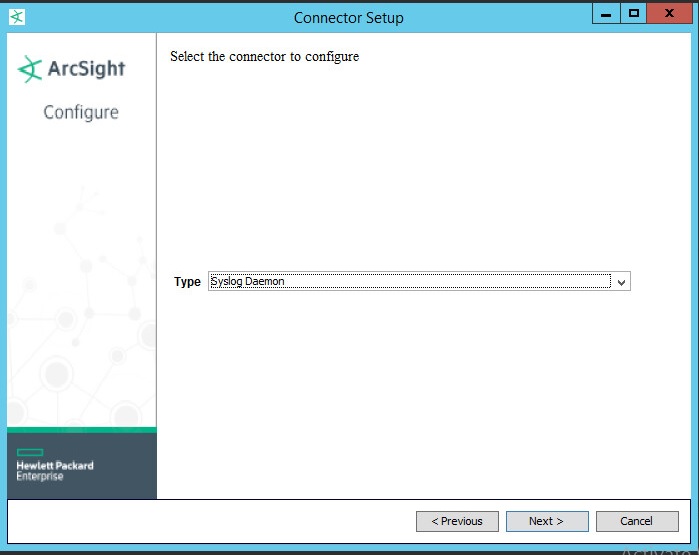
Selecting the connector type
Click Next.
- In the Enter the parameter details form, specify the following data:
- Network Port—Port to which Feed Service will send detection events.
It is the same port that is specified on the Settings > Service tab of Kaspersky CyberTrace Web (by default, it is
9998). - IP Address—IP address to which Feed Service will send detection events.
It is the same IP address that is specified on the Settings > Service tab of Kaspersky CyberTrace Web (by default, it is
127.0.0.1).You can specify
ALLif you want Arcsight SmartConnector to receive events from all network interfaces of the computer on which it runs. (Note that you cannot specifyALLin the Feed Service configuration file.) - Protocol—Specify
Raw TCP. - Forwarder—Specify
false.
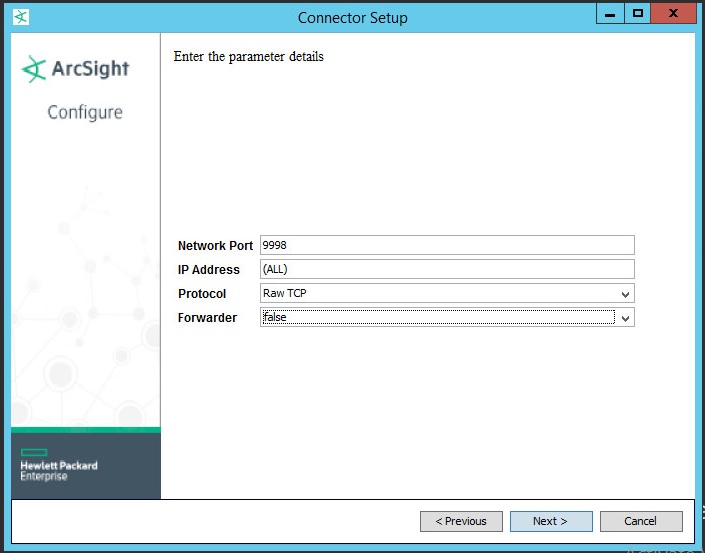
Parameters for sending detection events
Click Next.
- Network Port—Port to which Feed Service will send detection events.
- Specify ArcSight Manager (encrypted) as the type of destination.
Click Next.
- Specify other destination parameters:
- Manager Hostname—Host where ArcSight Manager is running.
- Manager Port—Port where ArcSight Manager is available.
By default, it is 8443.
- User—Name of the ArcSight ESM user that has rights for registering the connector.
- Password—Password of the ArcSight ESM user.
- AUP Master Destination—Specify false.
- Filter Out All Events—Specify false.
- Enable Demo CA—Specify false.
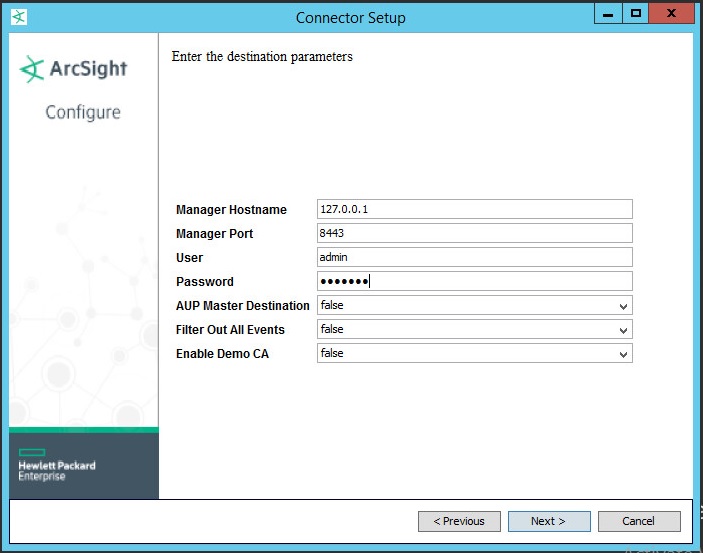
Destination parameters
Click Next.
- Specify the connector details: the name (arbitrary value permitted), location (arbitrary value permitted), location of the device that will send events to the connector (arbitrary value permitted, can be empty), and comment about the connector (arbitrary value permitted, can be empty).
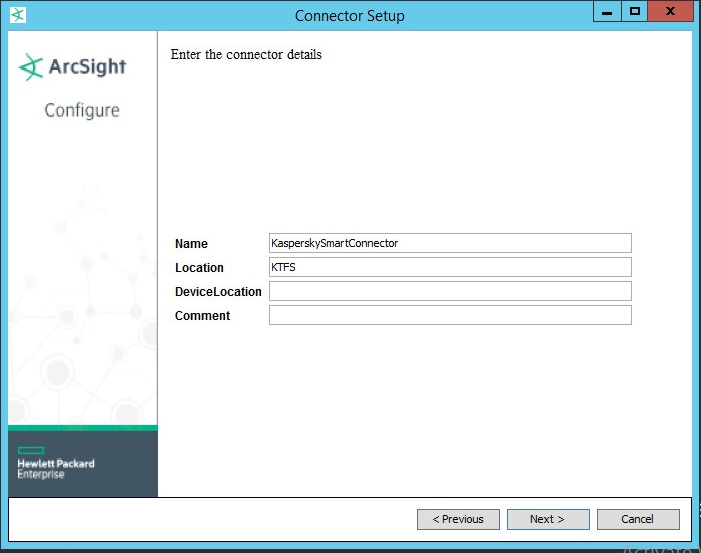
Connector details
Click Next.
- If the ArcSight Manager parameters are valid, accept importing the certificate from the destination.
- If the certificate is imported successfully, you will be asked to install ArcSight SmartConnector either as a service or as an application. We recommend that you install it as a service.
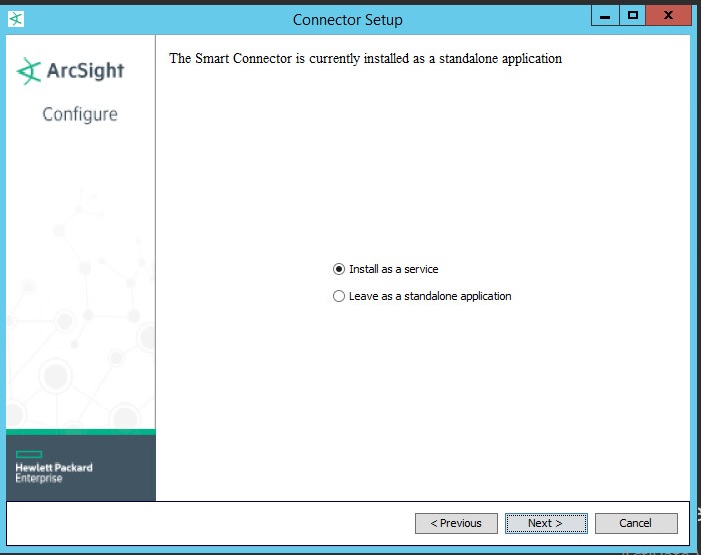
Choosing installation mode
Click Next.
- Specify the service parameters.
We recommend that you set the service name to be the same as the connector name.
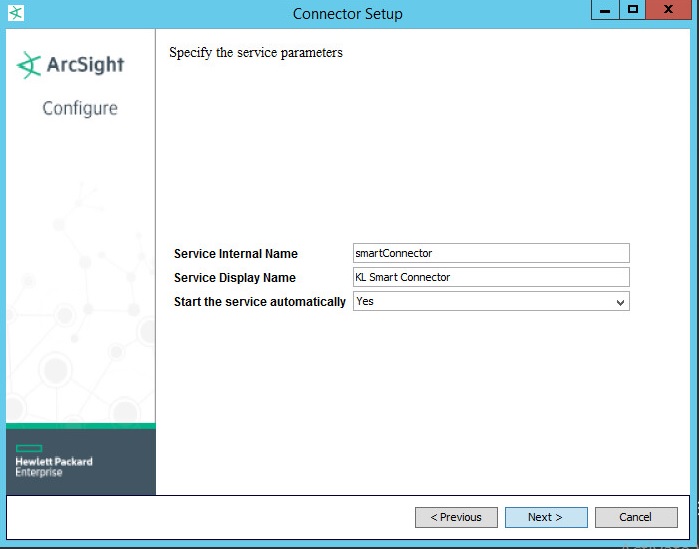
Specifying service parameters
Click Next.
The operation summary is displayed.
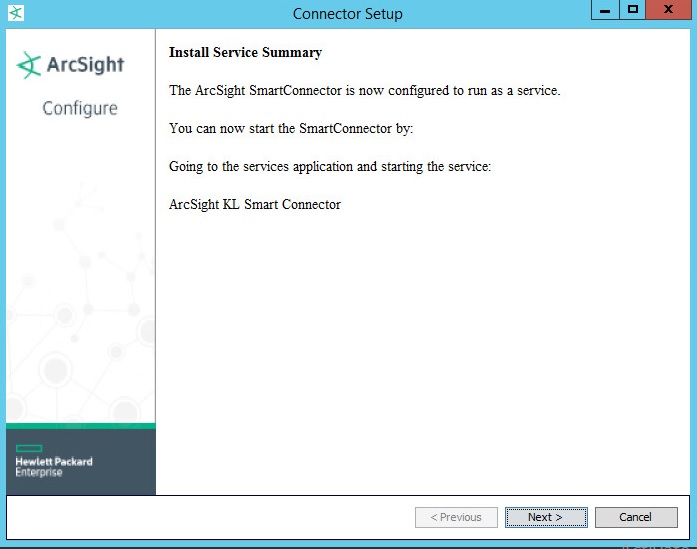
SmartConnector installation: Operation summary
- In the
%ARCSIGHT_HOME%/current/user/agent/agent.propertiesconfiguration file, specify30000in theagents[0].tcppeerclosedchecktimeoutparameter. - Make sure that the service named
ArcSight %ServiceDisplayName%is running (%ServiceDisplayName%is the name that you specified in the Service Display Name box in the previous step).For this purpose, open Windows Task Manager and check the status of the service. The status must be
Running. Using Windows Task Manager, you can stop or start the service.
Standard integration (ArcSight)
This section contains instructions for integrating Kaspersky CyberTrace with ArcSight in different integration schemes.
Integration schemes (ArcSight)
This section describes possible integration schemes of ArcSight products and Kaspersky CyberTrace.
About the components of the standard integration scheme
The following components are used in the integration schemes for ArcSight:
- ArcSight ESM
This SIEM solution is used in this integration.
- Forwarding Connector
This ArcSight component sends ArcSight events to Feed Service.
- Feed Service
This service matches ArcSight events against Kaspersky Threat Data Feeds.
- SmartConnector
This ArcSight component sends events generated by Feed Service to ArcSight.
- Security controls
These are sources of events for ArcSight such as firewalls, proxies, intrusion detection systems, and other networking devices. Security controls can send events to ArcSight via any method supported by ArcSight.
ArcSight ESM, ArcSight Forwarding Connector, ArcSight SmartConnector, and Feed Service can be installed on the same computer or connect over a network. ArcSight ESM and ArcSight Forwarding Connector run on Linux, so they must be installed separately from Feed Service.
The figures in the following sections show some of the possible integration schemes.
Single-computer installation
The figure below depicts all four components installed on a single computer.
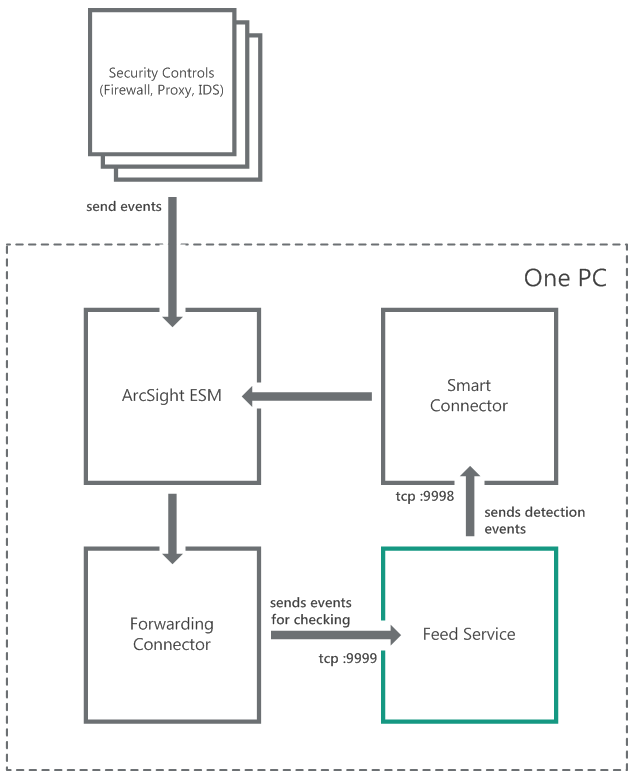
Single-computer installation
Two-computer installation (suggested integration)
The figure below depicts ArcSight ESM and Forwarding Connector installed on one computer, and Feed Service and SmartConnector installed on another.
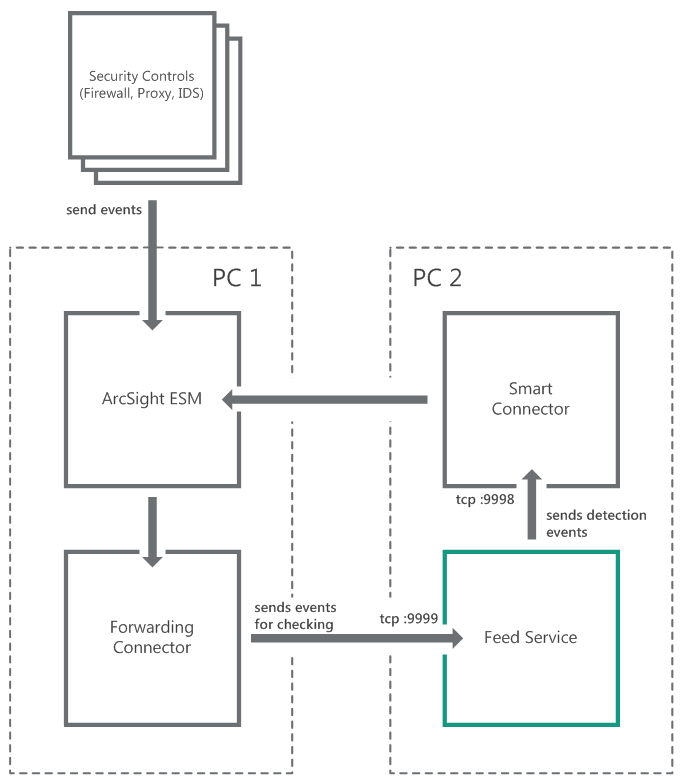
Two-computer installation (suggested integration)
Two-computer installation (second suggested integration)
The figure below depicts ArcSight ESM installed on one computer, and Forwarding Connector, Feed Service, and SmartConnector installed on another.
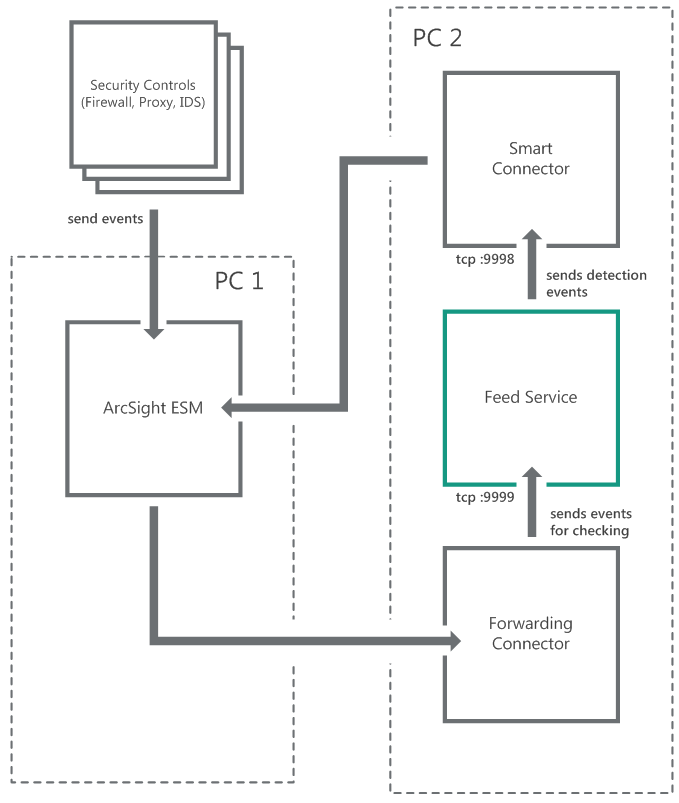
Two-computer installation (second suggested integration)
Two-computer installation (third suggested integration)
The figure below depicts Feed Service installed on one computer, and SmartConnector, ArcSight ESM, and Forwarding Connector installed on another.
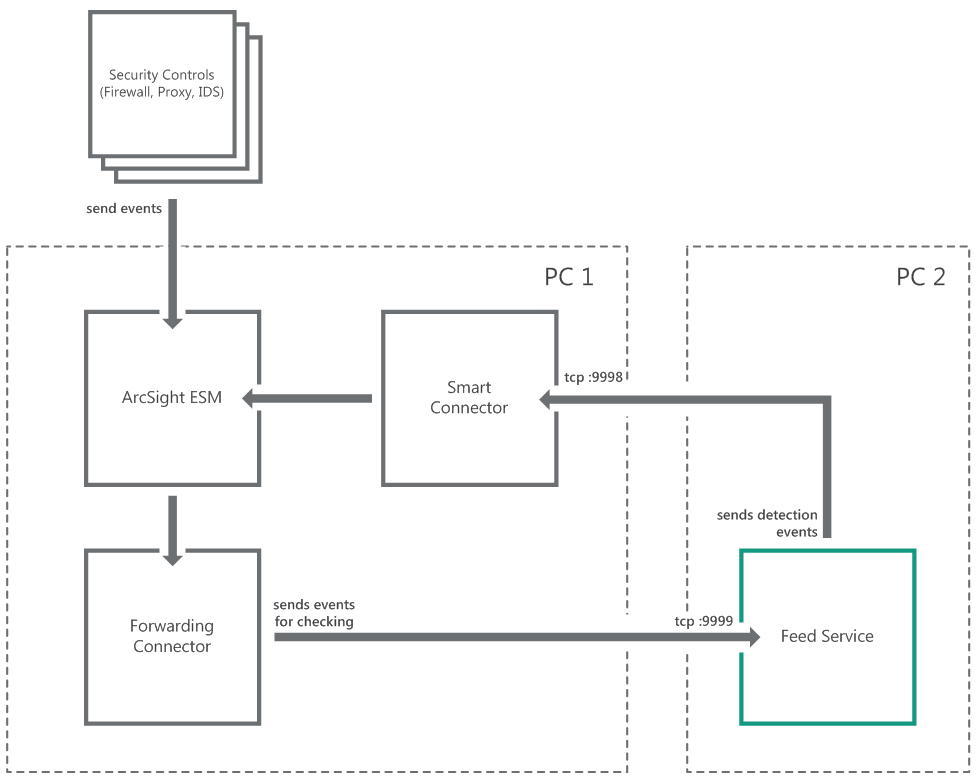
Two-computer installation (third suggested integration)
Three-computer installation
The figure below depicts ArcSight ESM installed on one computer, Forwarding Connector installed on another, and Feed Service and SmartConnector installed on still another.
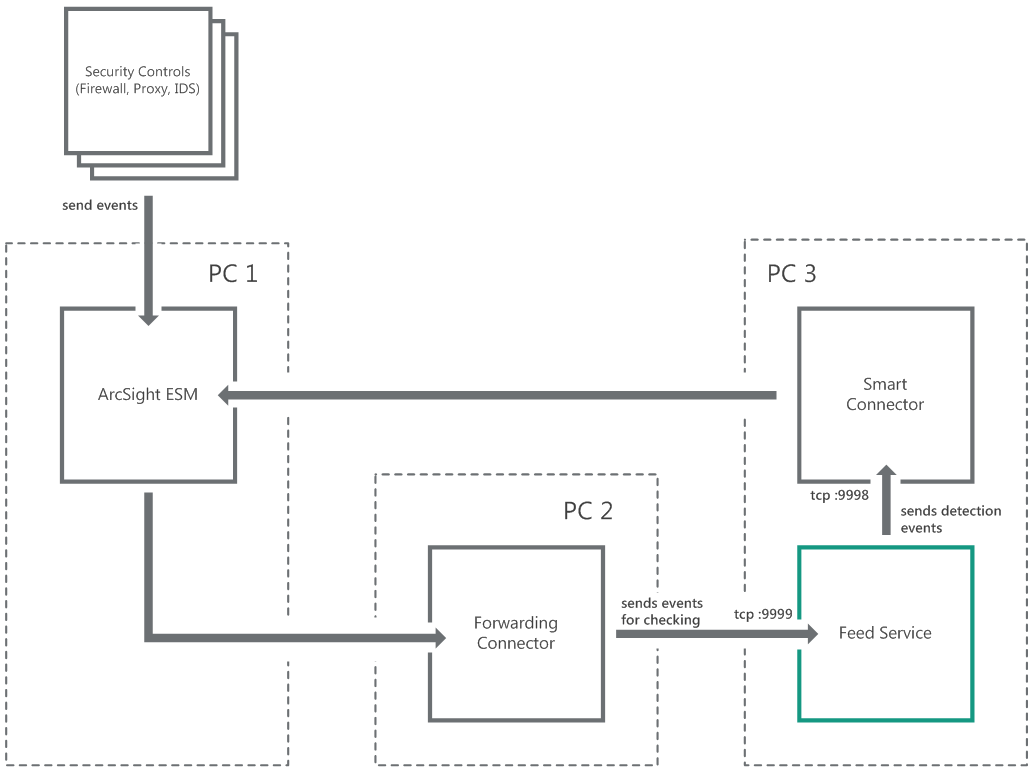
Three-computer installation
Page topStep 1. Importing the ARB package
This section describes how to import the ARB package to ArcSight.
The ARB package contains objects (active channels, dashboards, field sets, reports, rules, filters, users) that are necessary for integrating the service with ArcSight. When you import this file, these objects are created in ArcSight.
To import the ARB package:
- Run ArcSight Console.
- In the Navigator pane (tree view), select the Packages tab.
- Click the Import button.
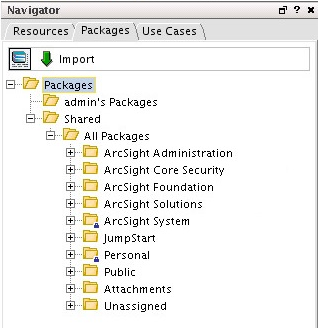
ArcSight packages
- In the Open window, select the Kaspersky_CyberTrace_Connector.arb file, located in the
integrationdirectory.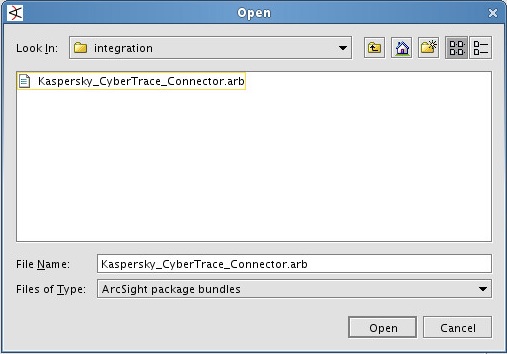
ARB file selection
The import process will be performed.
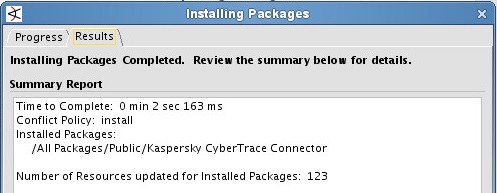
ARB import complete
After all objects from the ARB file are imported to ArcSight, all the imported rules are real-time rules, that is, they will be applied in real time.
To browse and manage the list of real-time rules:
- In the tree view, click the Resources tab.
- Open the Active Channels drop-down list and select Rules.
- In the tree, select Rules > Shared > All Rules > Real-time Rules.
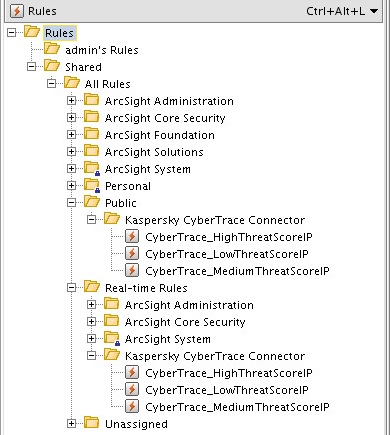
Real-time rules
- Expand Real-time Rules and remove unnecessary nested items from it.
After the ARB package is imported, new objects are created in ArcSight.
- When the Active Channels item in the tree view is selected, the following objects will be at the Active Channels > Shared > All Active Channels > Public > Kaspersky CyberTrace Connector location:
Object
Description
Default state
CyberTrace alerts
Displays service events from Kaspersky CyberTrace in real time.
Turned on
CyberTrace all matches
Displays detection events from Kaspersky CyberTrace in real time.
Turned on
CyberTrace hash matches
Displays hash detection events from Kaspersky CyberTrace in real time.
Turned off
CyberTrace URL matches
Displays URL detection events from Kaspersky CyberTrace in real time.
Turned off
CyberTrace IP matches
Displays IP detection events from Kaspersky CyberTrace in real time.
Turned off
- When the Dashboards item in the tree view is selected, the following objects will be at the Dashboards > Shared > All Dashboards > Public > Kaspersky CyberTrace Connector location:
Object
Description
Default state
CyberTrace detection map
Displays all devices that sent events containing malicious URLs, IP addresses, or hashes. Displays all feeds that were involved in the detection process.
Turned off
CyberTrace match statistics
Detection statistics: how many objects of a specific category were detected.
Turned on
CyberTrace Top 10 matched indicators
Top 10 detected indicators.
Turned off
The
CyberTrace detection mapandCyberTrace Top 10 matched indicatorsdashboards are turned off by default so as not to overload ArcSight. You can turn them on if you need these dashboards. - When the Field Sets item in the tree view is selected, the following objects will be at the Field Sets > Shared > All Field Sets > Public > Kaspersky CyberTrace Connector location:
Object
Description
Default state
CyberTrace alerts
Displayed fields of service events from Kaspersky CyberTrace.
Static
CyberTrace all matches
Displayed fields of detection events from Kaspersky CyberTrace.
Static
CyberTrace matched hashes
Displayed fields of hash detection events from Kaspersky CyberTrace.
Static
CyberTrace matched URLs
Displayed fields of URL detection events from Kaspersky CyberTrace.
Static
CyberTrace matched IPs
Displayed fields of IP address detection events from Kaspersky CyberTrace.
Static
- When the Reports item in the tree view is selected, the following objects will be at the Reports > Shared > All Reports > Public > Kaspersky CyberTrace Connector location:
Object
Description
Default state
CyberTrace all matches
Report that contains detection events from Kaspersky CyberTrace.
Static
- When the Rules item in the tree view is selected, the following object will be at the Rules > Shared > All Rules > Public > Kaspersky CyberTrace Connector location:
Object
Description
Default state
CyberTrace_HighThreatScoreIP
Rule for assigning high severity level and storing high priority IP detection events from Kaspersky CyberTrace.
Turned on
CyberTrace_MediumThreatScoreIP
Rule for assigning medium severity level and storing medium priority IP detection events from Kaspersky CyberTrace.
Turned on
CyberTrace_LowThreatScoreIP
Rule for assigning low severity level and storing low priority IP detection events from Kaspersky CyberTrace.
Turned on
- When the Filters item in the tree view is selected, the following objects will be at the Filters > Shared > All Filters > Public > Kaspersky CyberTrace Connector location:
Object
Description
Default state
CyberTrace all matches
Filter for selecting detection events sent by Kaspersky CyberTrace.
Static
CyberTrace forwarding events
Filter for forwarding to Kaspersky CyberTrace those events that contain URLs, IP addresses, or hashes.
Static
CyberTrace matched hashes
Filter for selecting hash detection events sent by Kaspersky CyberTrace.
Static
CyberTrace matched URLs
Filter for selecting URL detection events sent by Kaspersky CyberTrace.
Static
CyberTrace matched IPs
Filter for selecting IP detection events sent by Kaspersky CyberTrace.
Static
- When the Users item in the tree view is selected, the following objects will be at the Users > Shared > Custom User Groups > Kaspersky CyberTrace Connector location:
Object
Description
Default state
FwdCyberTrace
Account that is used for configuring ArcSight event forwarding.
Static
After the import is finished, make sure that the FwdCyberTrace user is created. To check, navigate to Users > Shared > Custom User Groups > Kaspersky CyberTrace Connector in ArcSight Console. If there is no FwdCyberTrace user, create it manually.
Step 2. Installing ArcSight Forwarding Connector
This section describes how to install ArcSight Forwarding Connector.
ArcSight Forwarding Connector is a component of HP ArcSight and is not included in Kaspersky CyberTrace. You can receive this application in one of the following ways:
- Contact the HP support team to get ArcSight Forwarding Connector.
- Contact a Kaspersky technical account manager (TAM) to get ArcSight Forwarding Connector.
To install ArcSight Forwarding Connector:
- Run the ArcSight Forwarding Connector installation application.
- Select the ArcSight Forwarding Connector installation directory (hereinafter referred to as
%ConnectorInstallDir%). - After the installation files are unpacked, select Add a Connector.
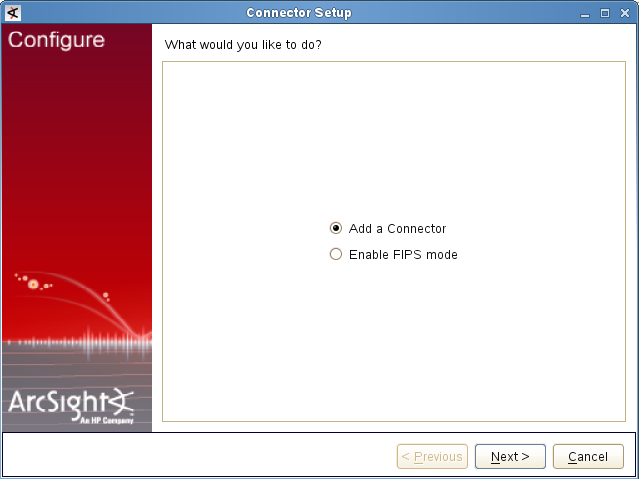
Adding a connector
Click Next.
- In the Type drop-down list, select ArcSight Forwarding Connector (Enhanced).
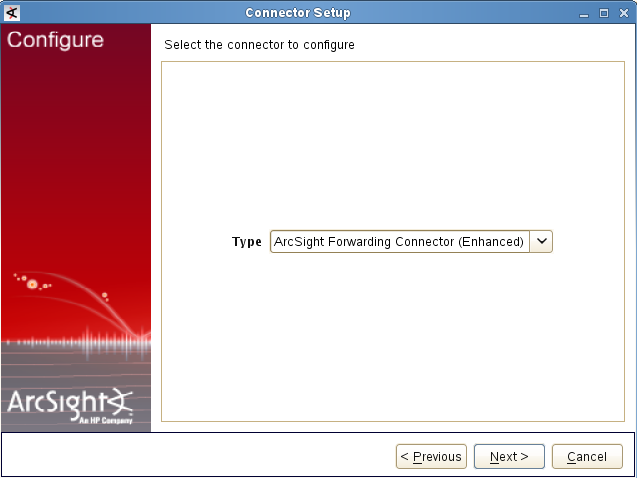
Selecting the connector type
Click Next.
- Specify the following connection parameters of ArcSight Source Manager:
- Host Name
ArcSight Source Manager host.
- Port
ArcSight Source Manager port (by default, it is
8443). - User Name
User name of the account intended for use by ArcSight Forwarding Connector (by default, it is
FwdCyberTrace).You can also specify a user other than
FwdCyberTrace. To do so, specify а custom ArcSight user in the ArcSight Forwarding Connector settings. - Password
Password for the account intended for use by ArcSight Forwarding Connector (by default, it is
KasperskyLab!).
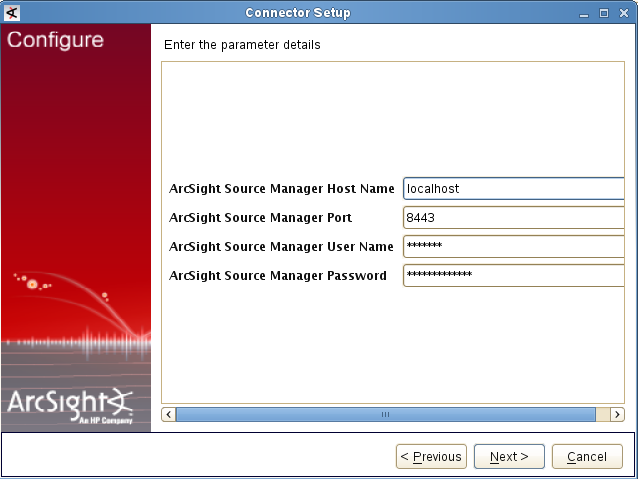
ArcSight Source Manager parameters
If an authentication error occurs (user name or password is incorrect), we recommend that you verify the
FwdCyberTraceuser is present in ArcSight Console. If not, create it manually.Click Next.
- Host Name
- If valid connection parameters are specified, import the required certificate.
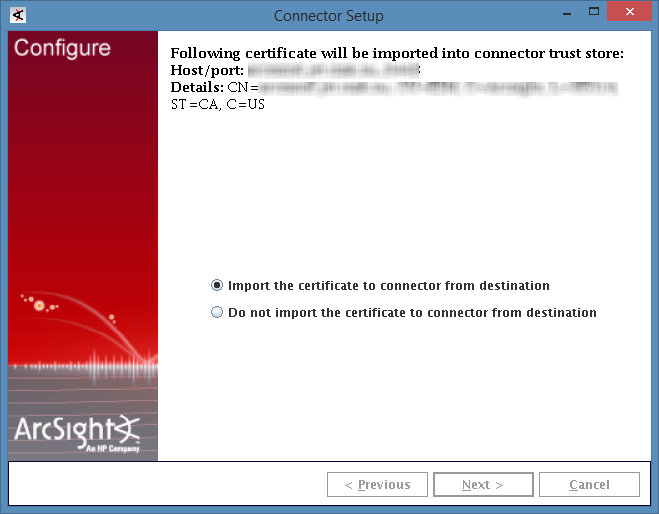
Importing the certificate
Click Next.
- Specify CEF Syslog as the event format that will be used for events sent to Feed Service.
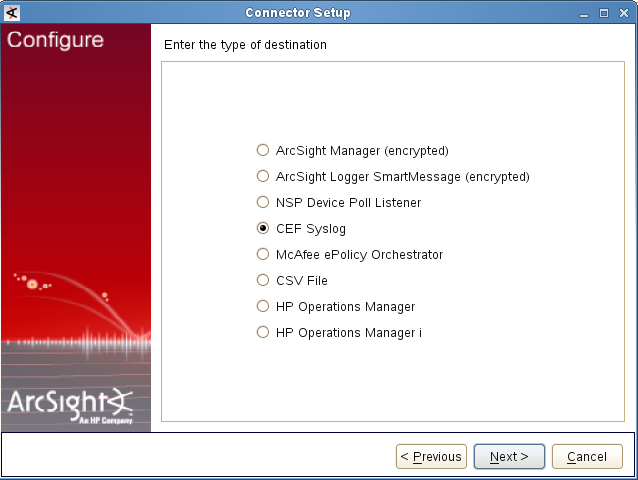
Specifying event format
Click Next.
- Specify the IP address (or host) and port that Feed Service will listen on for events. Specify Raw TCP as the protocol.
The IP address and port are the same as specified on the Settings > Service tab of Kaspersky CyberTrace Web. By default,
127.0.0.1:9999is used as the IP address and port for receiving events from ArcSight.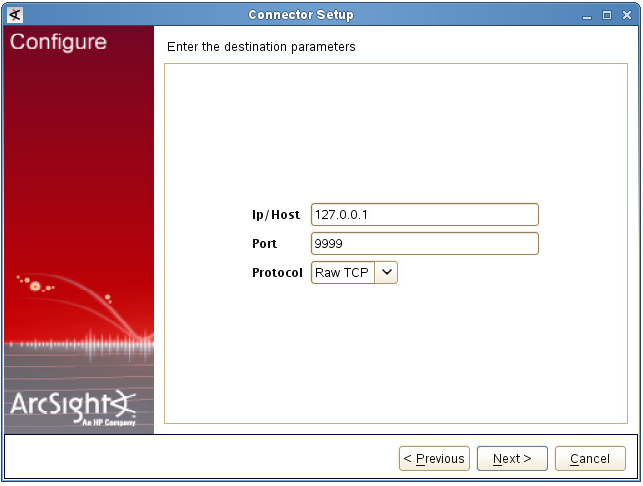
Specifying event destination
Click Next.
- Specify the details of the new ArcSight Forwarding Connector object: the name (arbitrary value permitted), location (arbitrary value permitted), location of the device that will send events to the connector (arbitrary value permitted, can be empty), and comment about the connector (arbitrary value permitted, can be empty).
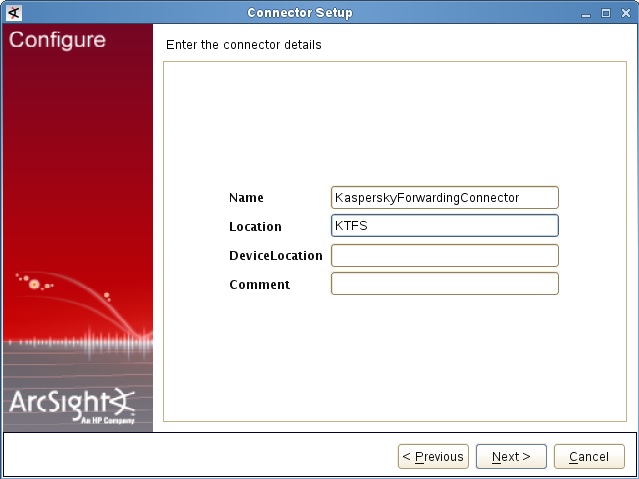
Connector details
Click Next.
- Install the ArcSight Forwarding Connector service.
- If you do not run the Connector Setup Wizard as root, a warning will be displayed.
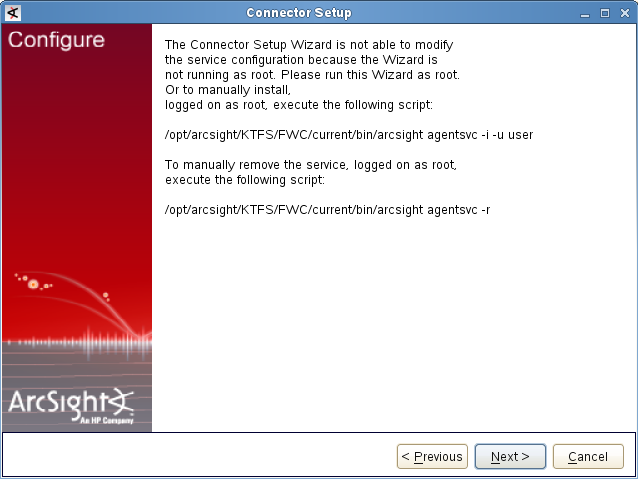
Warning about user privileges
You can either run the Connector Setup Wizard as root, or run the following command as root:
%ConnectorInstallDir%/current/bin/arcsight agentsvc -i -u $username -sn $service_nameHere
$usernameis the name of the operating system user that will run the service.$service_nameis the service name.We recommend that you set the service name to be the same as the connector name.
Log file
%ConnectorInstallDir%/current/logs/agent.logwill contain messages about the installation process.Skip the next step, which describes how to specify the service parameters.
- If you run the installation as root, select Install as a service.
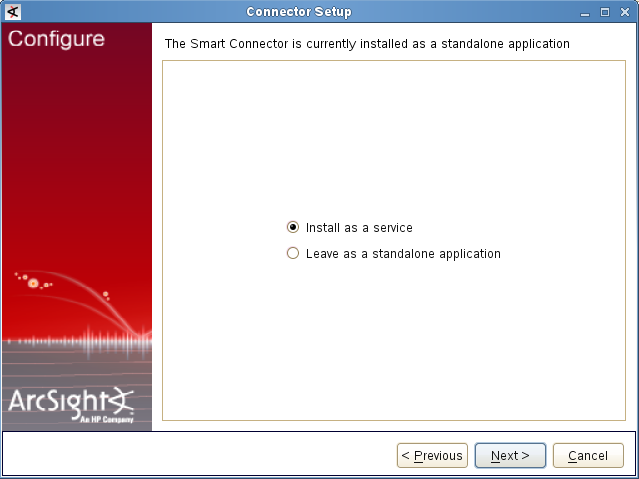
Choosing installation mode
Click Next.
- Specify the service parameters.
We recommend that you set the service name to be the same as the connector name.
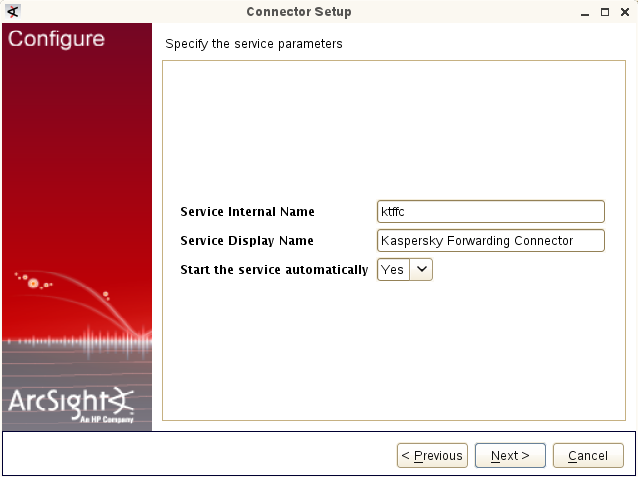
Specifying service parameters
Click Next.
After this, the Connector Setup Wizard informs you that the new forwarding connector is installed.
- Make sure that the connector is running (see the section about ArcSight troubleshooting on how you can do this). If it is not running, start it by using the following command:
/etc/init.d/arc_%FORWARDING% startHere
%FORWARDING%is the name of the connector.
If the forwarding connector sends a large amount of events (more than 1000 events per second) to Feed Service, we recommend that you do the following: in the %ConnectorInstallDir%/current/user/agentagent.wrapper.conf file, set the wrapper.java.maxmemory field to 512 and restart the forwarding connector.
Step 2 (alternative). Installing ArcSight Forwarding Connector by using the console
You can install ArcSight Forwarding Connector by using the console instead of the GUI installer.
To install ArcSight Forwarding Connector by using the console:
- In the console, run the ArcSight Forwarding Connector installer.
- Read the Introduction section and press Enter.
- When prompted, select Choose Install Folder, and type the full path to the directory where ArcSight Forwarding Connector will be installed (
%ConnectorInstallDir%).The default value of the installation directory is
/root/ArcSightSmartConnectors - When prompted, select Choose Install Set, and type
1(stands forTypical). - When prompted, select Choose Link Location, and specify whether a link to the installation directory must be created.
We recommend that you specify
Don't create links. - Make sure that the Pre-Installation Summary section lists the correct values of the installation settings. Press Enter if the values are correct.
After ArcSight Forwarding Connector is installed, the following information will be displayed in the console:
Installation Complete---------------------The core components of the ArcSight SmartConnector have been successfully installed to:%ConnectorInstallDir%To finish the configuration of the SmartAgent, please go to the folder:%ConnectorInstallDir%/current/bin/and execute the script:./runagentsetup.sh - Run
%ConnectorInstallDir%/current/bin/runagentsetup.sh. - At the prompt, select
Add a Connector. - Specify
ArcSight Forwarding Connectoras the connector type. - Specify whether to mask passwords.
We recommend that you specify
yes. - Specify the following connection parameters of ArcSight Source Manager:
- Host Name
ArcSight Source Manager host.
- Port
ArcSight Source Manager port (by default, it is
8443). - User
Username of the account intended for use by ArcSight Forwarding Connector (by default, it is
FwdCyberTrace).You can also specify a user other than
FwdCyberTrace. To do so, specify а custom ArcSight user in the ArcSight Forwarding Connector settings. - Password
Password for the account intended for use by ArcSight Forwarding Connector (by default, it is
KasperskyLab!).
- Host Name
- Specify the following action for importing the certificate:
Import the certificate to connector from destination. - Specify the destination type:
CEF Syslog. - Specify the following settings:
- Ip/Host
IP address that Feed Service listens on for events.
- Port
Port through which Feed Service receives events. By default, it is
9999. - Protocol
Specify
Raw TCP.
The IP address and port are the same as specified in the Connection settings section of the Service tab of Kaspersky CyberTrace Web.
- Ip/Host
- Specify the following connector settings:
- Name
Arbitrary value can be specified.
- Location
Arbitrary value can be specified.
- DeviceLocation
Arbitrary value can be specified.
- Comment
Arbitrary value can be specified.
After this, the connector will be registered.
- Name
- Specify the way in which the connector must be installed:
Install as a service. - Specify the service settings:
- Service Internal Name
- Service Display Name
- Start the service automatically
Indicates whether the service will start on the system startup. We recommend that you specify
yes.
- Check the specified data. If it is correct, press Enter.
The connector will be installed as a service.
- Make sure that the connector is running (see the section about ArcSight troubleshooting on how you can do this). If it is not running, start it by using the following command:
/etc/init.d/arc_%FORWARDING% startHere
%FORWARDING%is the name of the connector.
If the forwarding connector sends a large amount of events (more than 1000 events per second) to Feed Service, we recommend that you do the following: in the %ConnectorInstallDir%/current/user/agentagent.wrapper.conf file, set the wrapper.java.maxmemory field to 512 and restart the forwarding connector.
Step 3. Configuring CyberTrace for interaction with ArcSight
This section describes how to configure CyberTrace for interaction with ArcSight during normal work.
To configure CyberTrace for interaction with ArcSight:
- Open Kaspersky CyberTrace Web.
- Select the Settings > Service tab.
- In the Connection settings section, for Service listens on, select the IP address and port that Feed Service listens on for incoming events. The IP address and port are set when ArcSight Forwarding Connector is installed (its default value is
127.0.0.1:9999). - Select the Matching tab, and then select the Edit default rules link.
The Default properties form opens.
- On the Normalizing rules tab, do the following:
- In the Regexp to replace field, enter the symbol sequence
\= - In the Replace with field,enter the symbol
=
After you make the changes, the Normalizing rules tab must look like this:
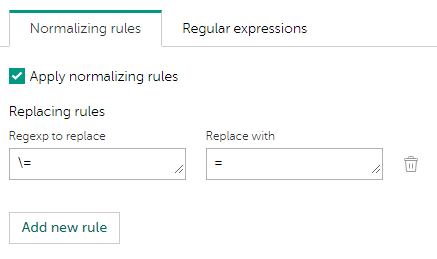
Normalizing rules tab
- In the Regexp to replace field, enter the symbol sequence
- Select the Regular expressions tab. This tab contains universal regular expressions that match URLs (with protocol), hashes, IP addresses (src and dst), device name, vendor name, device IP address, user name, and event ID. Change these regular expressions to match the events.
- Close the Default properties form.
- On the Events format tab, in the Alert events format field, enter the following string:
CEF:0|Kaspersky|Kaspersky CyberTrace for ArcSight|2.0|1|CyberTrace Service Event|4| reason=%Alert% msg=%RecordContext% - In the Detection events format field, specify the following string:
CEF:0|Kaspersky|Kaspersky CyberTrace for ArcSight|2.0|2|CyberTrace Detection Event|8| reason=%Category% dst=%DST_IP% src=%DeviceIp% fileHash=%RE_HASH% request=%RE_URL% sourceServiceName=%Device% sproc=%Product% suser=%UserName% msg=CyberTrace detected %Category% externalId=%Id% %ActionableFields% cs5Label=MatchedIndicator cs5=%MatchedIndicator% cn3Label=Confidence cn3=%Confidence% cs6Label=Context cs6=%RecordContext%
ArcSight and actionable fields
The following actionable fields are used in Kaspersky Data Feeds. You can review the actionable fields on the Settings > Feeds tab. For more information, see section "Adding actionable fields to a feed".
- For Demo Botnet CnC URL Data Feed and Botnet CnC URL Data Feed:
Field name
Output
CEF field
mask
cs1
deviceCustomString1
first_seen
flexString1
flexString1
last_seen
flexString2
flexString2
popularity
cn2
deviceCustomNumber2
threat
cs3
deviceCustomString3
urls/url
cs4
deviceCustomString4
whois/domain
cs2
deviceCustomString2
- For Demo Malicious Hash Data Feed and Malicious Hash Data Feed:
Field name
Output
CEF field
first_seen
flexString1
flexString1
last_seen
flexString2
flexString2
popularity
cn2
deviceCustomNumber2
threat
cs3
deviceCustomString3
urls/url
cs4
deviceCustomString4
file_size
fsize
file_size
- For Demo IP Reputation Feed and IP Reputation Data Feed:
Field name
Output
CEF field
first_seen
flexString1
flexString1
last_seen
flexString2
flexString2
popularity
cn2
deviceCustomNumber2
threat_score
cn1
deviceCustomNumber1
domains
cs2
deviceCustomString2
urls/url
cs4
deviceCustomString4
files/threat
cs3
deviceCustomString3
- For Malicious URL Data Feed:
Field name
Output
CEF field
mask
cs1
deviceCustomString1
first_seen
flexString1
flexString1
last_seen
flexString2
flexString2
popularity
cn2
deviceCustomNumber2
files/threat
cs3
deviceCustomString3
category
cs4
deviceCustomString4
whois/domain
cs2
deviceCustomString2
- For Mobile Malicious Hash Data Feed:
Field name
Output
CEF field
first_seen
flexString1
flexString1
last_seen
flexString2
flexString2
popularity
cn2
deviceCustomNumber2
threat
cs3
deviceCustomString3
file_size
fsize
file_size
- For Phishing URL Data Feed:
Field name
Output
CEF field
mask
cs1
deviceCustomString1
first_seen
flexString1
flexString1
last_seen
flexString2
flexString2
popularity
cn2
deviceCustomNumber2
industry
deviceFacility
deviceFacility
whois/domain
cs2
deviceCustomString2
- For Mobile Botnet Data Feed:
Field name
Output
CEF field
threat
cs3
deviceCustomString3
- For Vulnerability Data Feed:
Field name
Output
CEF field
severity
cs3
deviceCustomString3
detection_date
flexString1
flexString1
- For APT URL Data Feed:
Field name
Output
CEF field
detection_date
flexString1
flexString1
publication_name
cs3
deviceCustomString3
- For APT IP Data Feed:
Field name
Output
CEF field
detection_date
flexString1
flexString1
publication_name
cs3
deviceCustomString3
- For APT Hash Data Feed:
Field name
Output
CEF field
detection_date
flexString1
flexString1
publication_name
cs3
deviceCustomString3
- For IoT URL Data Feed:
Field name
Output
CEF field
mask
cs1
deviceCustomString1
first_seen
flexString1
flexString1
last_seen
flexString2
flexString2
popularity
cn2
deviceCustomNumber2
files/threat
cs3
deviceCustomString3
Clearing ArcSight fields occupied by information from Kaspersky Data Feeds
If you want to use a CEF field for data other than information from Kaspersky Data Feeds, you must clear this field.
To clear a CEF field:
- Select the Settings tab of Kaspersky CyberTrace Web.
- Select the Feeds tab.
- In the Filtering rules for feeds section, make sure the Kaspersky feeds tab is selected and then click the Kaspersky Threat Data Feed that contains the field that you want to clear.
- In the Actionable fields section, find the Output field containing the name of the CEF field that you want to clear.
- Click the Delete icon (
 ) next to the Output field that you found in the previous step.
Step 4. Performing the verification test (ArcSight)
After you install Kaspersky CyberTrace and the necessary ArcSight software, you can test their performance.
Please make sure you perform the verification test before editing any filtering rules in the Feed Utility configuration file.
To check whether Kaspersky CyberTrace is correctly integrated with ArcSight:
- Configure Log Scanner to send events to ArcSight SmartConnector.
For this purpose, set the host and port of ArcSight SmartConnector in the
Connectionelement of the Log Scanner configuration file. - Send the
%service_dir%/verification/kl_verification_test_cef.txtfile to ArcSight SmartConnector.For this purpose, run the following command (in Linux):
./log_scanner -p ../verification/kl_verification_test_cef.txtFor this purpose, run the following command (in Windows):
log_scanner.exe -p ..\verification\kl_verification_test_cef.txtDo not specify the
-rflag in this command: send the test results to the SIEM solution by using the parameters for outbound events specified in the Service settings of Kaspersky CyberTrace. - Make sure that you have the test results below.
You can view the test results in the CyberTrace all matches active channel. For this purpose, set the following inline filter for the Source Service Name field:
Kaspersky Lab|CyberTrace Verification Kit.
Verification test results
The verification test results depends on the feeds you use. The verification test results are listed in the following table.
Verification test results
Feed used |
Detected objects |
Malicious URL Data Feed |
http://fakess123.nu http://badb86360457963b90faac9ae17578ed.com |
Phishing URL Data Feed |
http://fakess123ap.nu http://e77716a952f640b42e4371759a661663.com |
Botnet CnC URL Data Feed |
http://fakess123bn.nu http://a7396d61caffe18a4cffbb3b428c9b60.com |
IP Reputation Data Feed |
192.0.2.0 192.0.2.3 |
Malicious Hash Data Feed |
FEAF2058298C1E174C2B79AFFC7CF4DF 44D88612FEA8A8F36DE82E1278ABB02F (EICAR Standard Anti-Virus Test File) C912705B4BBB14EC7E78FA8B370532C9 |
Mobile Malicious Hash Data Feed |
60300A92E1D0A55C7FDD360EE40A9DC1 |
Mobile Botnet CnC URL Data Feed |
001F6251169E6916C455495050A3FB8D (MD5 hash) sdfed7233dsfg93acvbhl.su/steallallsms.php (URL mask) |
Ransomware URL Data Feed |
http://fakess123r.nu http://fa7830b4811fbef1b187913665e6733c.com |
Vulnerability Data Feed |
D8C1F5B4AD32296649FF46027177C594 |
APT URL Data Feed |
http://b046f5b25458638f6705d53539c79f62.com |
APT Hash Data Feed |
7A2E65A0F70EE0615EC0CA34240CF082 |
APT IP Data Feed |
192.0.2.4 |
IoT URL Data Feed |
http://e593461621ee0f9134c632d00bf108fd.com/.i |
Demo Botnet CnC URL Data Feed |
http://5a015004f9fc05290d87e86d69c4b237.com http://fakess123bn.nu |
Demo IP Reputation Data Feed |
192.0.2.1 192.0.2.3 |
Demo Malicious Hash Data Feed |
776735A8CA96DB15B422879DA599F474 FEAF2058298C1E174C2B79AFFC7CF4DF 44D88612FEA8A8F36DE82E1278ABB02F |
ICS Hash Data Feed |
7A8F30B40C6564EFF95E678F7C43346C |
Integration with QRadar
This chapter describes how to integrate Kaspersky CyberTrace with QRadar.
Integration steps (QRadar)
This chapter describes how to integrate Kaspersky CyberTrace with QRadar.
About the integration schemes
Kaspersky CyberTrace can be integrated with QRadar in two integration schemes:
- Standard integration
Use this scenario if it is possible to get QRadar updates. For more information about the standard integration scheme, see About the standard integration scheme (QRadar).
- Integration when QRadar cannot get updates
This is an additional scenario for a case when it is not possible to get QRadar updates. The procedure is outlined in Integration with QRadar when QRadar cannot get updates.
How to integrate Kaspersky CyberTrace with QRadar
Make sure that you have installed Kaspersky CyberTrace (see Part 1: Installing Kaspersky CyberTrace).
To integrate Kaspersky CyberTrace with QRadar in the standard integration scenario:
- Step 1. Configure QRadar to receive latest updates.
- Step 2. Send a set of events to QRadar so that QRadar will automatically add new log sources.
- Step 3. Forward events from QRadar to Feed Service.
- Step 4. Perform the verification test.
Please make sure you perform the verification test before editing any matching process settings.
- Step 5. Configure QRadar to retrieve custom event properties.
- Step 6. Configure QRadar to create a search filter for CyberTrace events.
- Step 7 (optional). Configure QRadar to display events in a dashboard.
After you have successfully integrated Kaspersky CyberTrace with QRadar, install Kaspersky Threat Feed App:
- Step 8 (optional). Configure QRadar to notify about incoming service events.
- Step 9 (optional). Install Kaspersky Threat Feed App.
- Step 10 (optional). Enable the indexes of the added custom event properties.
- Step 11 (optional). Configure Kaspersky Threat Feed App.
Standard integration (QRadar)
This section contains instructions for integrating Kaspersky CyberTrace with QRadar in the standard integration scheme.
About the standard integration scheme (QRadar)
This section describes the standard integration scheme for QRadar and Kaspersky CyberTrace.
For the standard integration scheme to work properly, you must install the update DSM-KasperskyCyberTrace-%version%-20180802144954.noarch.rpm, where %version% is the version of QRadar. Usually, you receive these updates as part of the auto-update process, but you can also visit IBM Fix Central and download them manually.
About the components of the standard integration scheme
The following components are used in the standard integration scheme for QRadar:
- Feed Service
This service matches QRadar events against Kaspersky Threat Data Feeds.
- QRadar
The SIEM solution used in this integration.
- Security controls
These are sources of events for QRadar such as firewalls, proxies, intrusion detection systems, and other networking devices.
Security controls can send events to QRadar by any method supported by QRadar.
Standard integration scheme
In the standard integration scheme, Feed Service by default is configured to listen for incoming events from QRadar on 0.0.0.0:9999 (аll interfaces).
Feed Service sends detection events to port 514 of the interface defined in QRadar configuration. The address of this interface is specified when you install Kaspersky CyberTrace.
Security controls can send events to QRadar in any format that is supported by QRadar, for example, Syslog, JDBC, OPSEC, File, or SNMP.
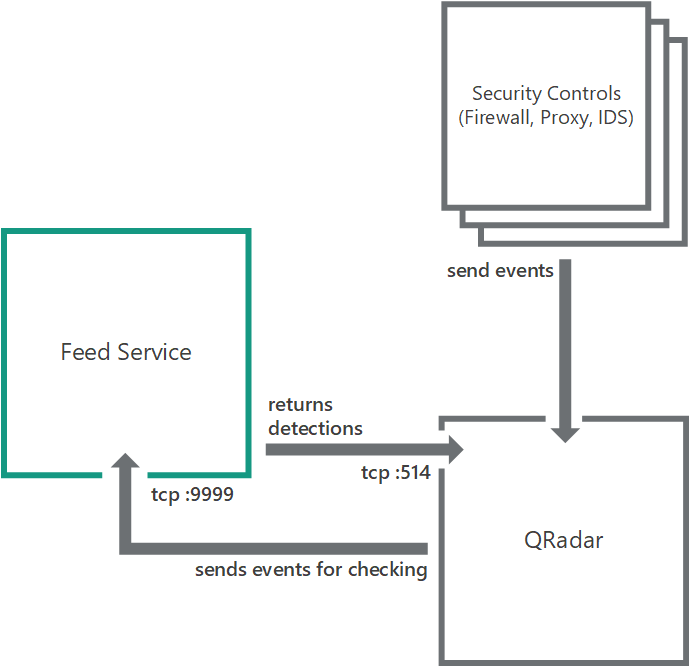
Standard integration scheme for QRadar
Page topStep 1. Configuring QRadar to receive latest updates
This section describes how you can receive the latest updates of QRadar.
To configure QRadar for getting latest updates:
- In QRadar Console, select Admin > Auto-Update.
The Update Configuration form opens.
- On the Basic tab, in the Configuration Updates section, select Auto Integrate in the Update Type drop-down list.
- In the DSM, Scanner, Protocol Updates section, select the Auto Install update type.
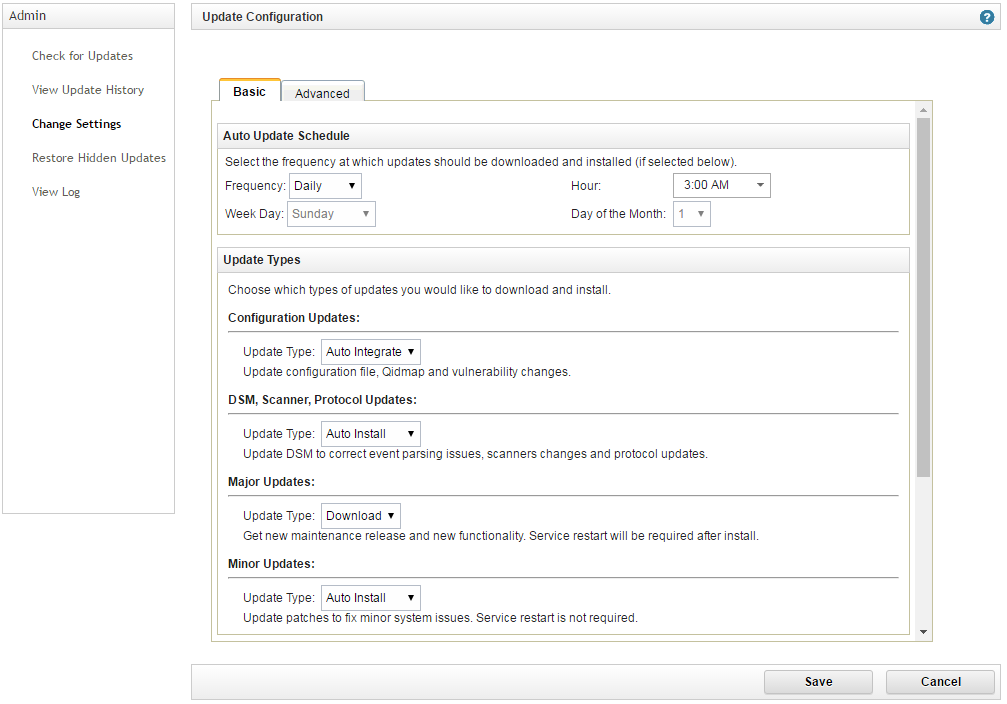
Update configuration
- Click Save.
- Wait for installation of the updates.
- In QRadar Console, select Admin > Log Sources > Add.
The Add a log source form opens.
- Make sure that Kaspersky CyberTrace appears in the Log Source Type drop-down list.
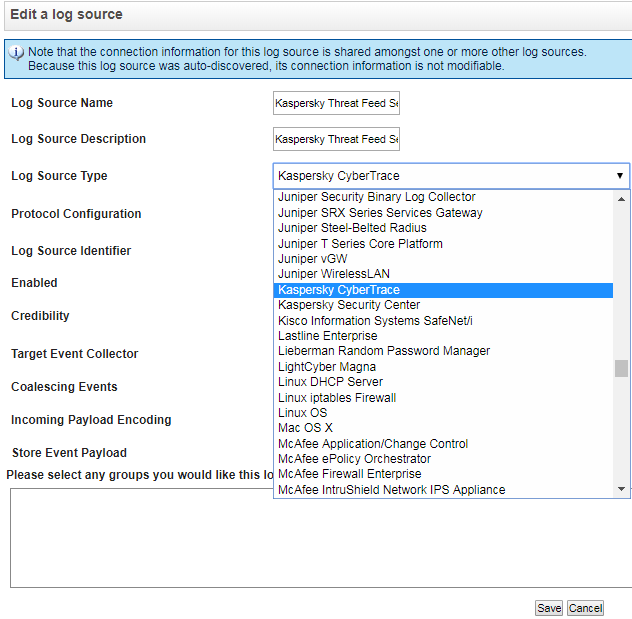
Kaspersky CyberTrace log source type
As an alternative to auto-updating QRadar, you can visit IBM Fix Central to manually download and install the DSM package that is specified in section "About the standard integration scheme (QRadar)", and then configure QRadar, as described in section "Integration with QRadar when QRadar cannot get updates".
Page topStep 2. Sending a set of events to QRadar
On this step, you must send two sets of events to QRadar so that QRadar will automatically add two new log sources—one for verification and the other for events from Feed Service.
To add new log sources:
- Send the verification test log file.
Send the
verification/kl_verification_test_leef.txtfile to QRadar, as described in the procedure in subsection "Sending a set of events" below.After you send the verification test file, QRadar will contain the
KL_Verification_Toollog source. - Send the sample log file.
For testing and final adjustments of integration with QRadar, send the
integration/qradar/sample_initiallog.txtsample log file to QRadar, as described in the procedure in subsection "Sending a set of events" below.After you send the sample log file, QRadar will contain the
KL_Feed_Service_v2log source.Up to 25 events can be missed after a new log source is added, according to the QRadar documentation. So you may have to send sample_initiallog.txt several times. This ensures that some events will be displayed by QRadar and handled by Feed Service.
Sending a set of events
To send events to QRadar:
- In the
Connectionelement of the Log Scanner configuration file, specify the IPv4 address and port of your QRadar server (usually it is514). - Invoke the following command from the Log Scanner directory.
In Linux:
./log_scanner -p <log_file> [-p <log_file2> ...]In Windows:
log_scanner.exe -p <log_file> [-p <log_file2> ...]<log_file>,<log_file2>are log files to send. Alternatively, you can specify a directory containing log files to send. - In QRadar Console (which is the web interface for QRadar), select Admin > Log Sources.
A new log source of the
Kaspersky CyberTracetype appears in the log sources list. - In the settings form of the new log source, clear the Coalescing Events check box and click Save.
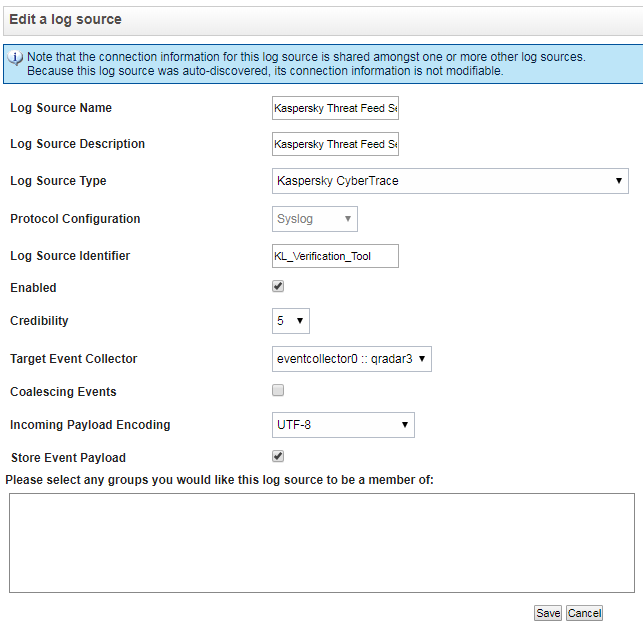
Editing a log source
- If necessary, deploy the changes by selecting the Admin > Deploy Changes menu item in QRadar Console.
Step 3. Forwarding events from QRadar to Feed Service
To check events that arrive in QRadar by way of Feed Service, you must configure QRadar to forward the events to Feed Service.
To forward events from QRadar to Feed Service:
- Select Admin > System Configuration > Forwarding Destinations > Add.
- In the Forwarding Destination Properties window, type the identifier of the destination (for example,
"KL_Threat_Feed_Service_v2"). - Type the destination address (the host where Feed Service runs).
- Select
Payloadas the events format andTCPas the protocol.The
Payloadformat can contain less information, in comparison with theJSONformat. For example, if event source names are used, QRadar may remove them from the event. You can specify theJSONformat instead, but make sure to configure it properly. For the instructions on how to configure events in theJSONformat to forward to Kaspersky CyberTrace, see subection "Recommendations on configuring events in JSON format" below. - Set the port according to the parameters for inbound events of Kaspersky CyberTrace. You can see this information on the Settings >Service tab of Kaspersky CyberTrace Web.
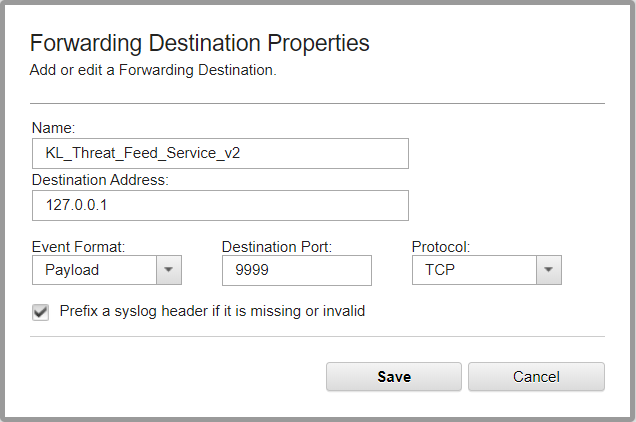
Adding a forwarding destination
- Click Save.
- Select Admin > Routing rules > Add.
- In the Routing Rule window, type the rule name (for example,
KL_Threat_Feed_Service_v2_Rule). - Select
Onlineas the mode. - Leave the default value in the Forwarding Event Collector drop-down list.
- Select
Eventsas the data source. - In the Event Filters group, set the event filter.
Choose the log sources together with
KL_Verification_Tool, and use theEquals any ofoperator in the filter. Also, to achieve maximum performance of the service, you are advised to select only those events that contain indicators to look up in the feeds (such as URLs, hashes (MD5, SHA1, SHA256), and IP addresses).Clear the Match all incoming events check box or leave it cleared so that the detection events received from Feed Service will not be sent back to Feed Service.
- Select the Forward check box. In the table, next to the Name column, select the check box next to the item added in step 1 (in this case, it is
KL_Threat_Feed_Service_v2).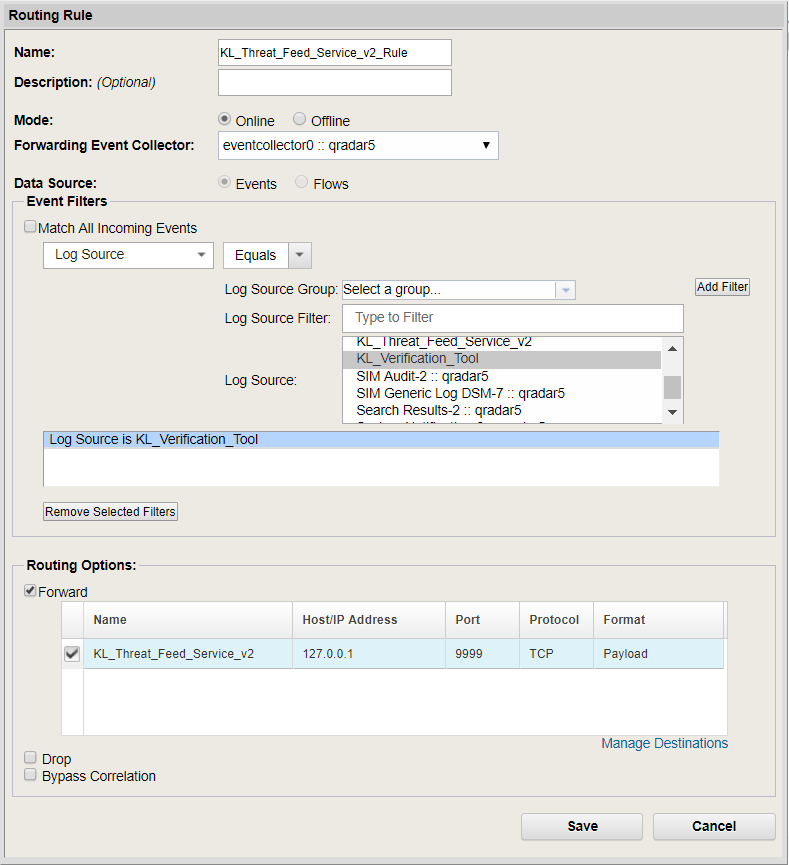
Adding a routing rule
- Click Save.
Recommendations for configuring events in the JSON format
A number of QRadar versions (such as, 7.3.2 Patch 6 and 7.4.0) can drop some forwarded events in the JSON format, which may lead to incorrect results. To prevent this, we recommend that you exclude some fields from the event in JSON (for an exact list of such fields, contact IBM's QRadar Support team or try to determine this list manually). You must specify additional normalizing rules in Kaspersky CyberTrace Web (see below).
Therefore, use the JSON format instead of the Payload format if the event in the Payload format does not contain the necessary fields. In this case, make sure that the following conditions are met:
- In the Forwarding Destination Properties window, only fields that you need are selected. QRadar does not drop forwarded events. To enable or disable fields that will be forwarded within an event, open the Forwarding Profile Properties window by clicking the button near the Profile field.
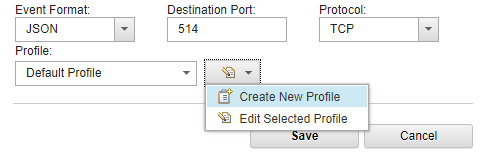
Configuring events in JSON format
- On the Settings > Matching tab of Kaspersky CyberTrace Web, the following normalizing rules are specified:
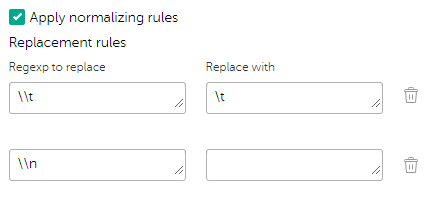
Configuring additional normalizing rules
Step 4. Performing the verification test (QRadar)
This section explains how to check the capabilities of Kaspersky CyberTrace by performing the verification test.
Please make sure you perform the verification test before editing any matching process settings.
What is the verification test
The verification test is a procedure that is used to check the capabilities of Kaspersky CyberTrace and to confirm the accuracy of the integration.
During this test you will check whether events from QRadar are received by Feed Service, whether events from Feed Service are received by QRadar, and whether events are correctly parsed by Feed Service using the regular expressions.
About the verification test file
The verification test file is a file that contains a collection of events with URLs, IP addresses, and hashes. This file is located in the ./verification directory in the distribution kit. The name of this file is kl_verification_test_leef.txt.
Verification procedure
To verify the installation:
- Make sure that the
"KL_Verification_Tool"log source is added to QRadar and routing rules are set in such a way that events from"KL_Verification_Tool"are sent to Feed Service. - Open QRadar Console and select the Log Activity tab.
- Add a filter:
- Click the Add Filter button.
- In the Parameter drop-down list, select
Log Source. - In the Operator drop-down list, select
Equals. - In the Value group, in the Log Source drop-down list select the required service name.
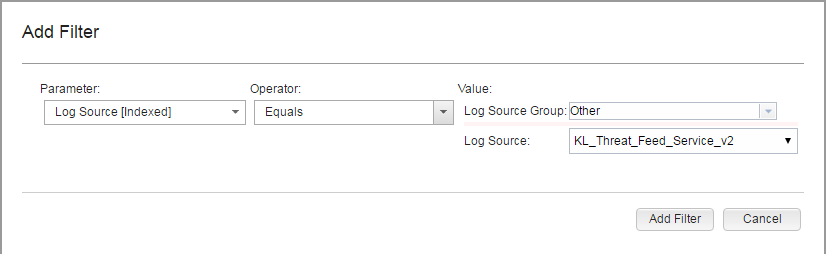
Adding a filter for browsing events
- Click the Add Filter button.
The
Log Source is KL_Threat_Feed_Service_v2string will be displayed under Current Filters. - In the View drop-down list, select
Real Timeto clear the event area.You now can browse information about the service events.
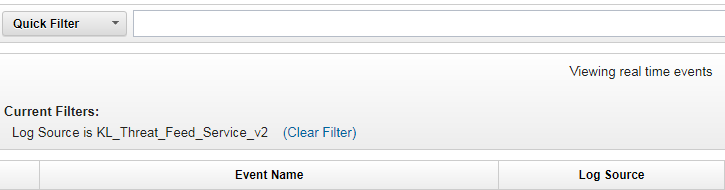
Browsing filtered information
- Send the
kl_verification_test_leef.txtfile to QRadar by using Log Scanner, by running the following command:For Linux:
./log_scanner -p ../verification/kl_verification_test_leef.txtFor Windows:
log_scanner.exe -p ..\verification\kl_verification_test_leef.txtIf you specify the
-rflag in this command, the test results are written to the Log Scanner report file. If you do not specify the-rflag, the test results are sent to the SIEM solution by using the settings for outbound events specified for Feed Service.The expected results to be displayed by QRadar depend on the feeds you use. The verification test results are listed in the following table.
Verification test results
Feed used
Detected objects
Malicious URL Data Feed
http://fakess123.nu
http://badb86360457963b90faac9ae17578ed.com
Phishing URL Data Feed
http://fakess123ap.nu
http://e77716a952f640b42e4371759a661663.com
Botnet CnC URL Data Feed
http://fakess123bn.nu
http://a7396d61caffe18a4cffbb3b428c9b60.com
IP Reputation Data Feed
192.0.2.0
192.0.2.3
Malicious Hash Data Feed
FEAF2058298C1E174C2B79AFFC7CF4DF
44D88612FEA8A8F36DE82E1278ABB02F (stands for EICAR Standard Anti-Virus Test File)
C912705B4BBB14EC7E78FA8B370532C9
Mobile Malicious Hash Data Feed
60300A92E1D0A55C7FDD360EE40A9DC1
Mobile Botnet CnC URL Data Feed
001F6251169E6916C455495050A3FB8D (MD5 hash)
http://sdfed7233dsfg93acvbhl.su/steallallsms.php (URL mask)
Ransomware URL Data Feed
http://fakess123r.nu
http://fa7830b4811fbef1b187913665e6733c.com
Vulnerability Data Feed
D8C1F5B4AD32296649FF46027177C594
APT URL Data Feed
http://b046f5b25458638f6705d53539c79f62.com
APT Hash Data Feed
7A2E65A0F70EE0615EC0CA34240CF082
APT IP Data Feed
192.0.2.4
IoT URL Data Feed
http://e593461621ee0f9134c632d00bf108fd.com/.i
Demo Botnet CnC URL Data Feed
http://5a015004f9fc05290d87e86d69c4b237.com
http://fakess123bn.nu
Demo IP Reputation Data Feed
192.0.2.1
192.0.2.3
Demo Malicious Hash Data Feed
776735A8CA96DB15B422879DA599F474
FEAF2058298C1E174C2B79AFFC7CF4DF
44D88612FEA8A8F36DE82E1278ABB02F
ICS Hash Data Feed
7A8F30B40C6564EFF95E678F7C43346C
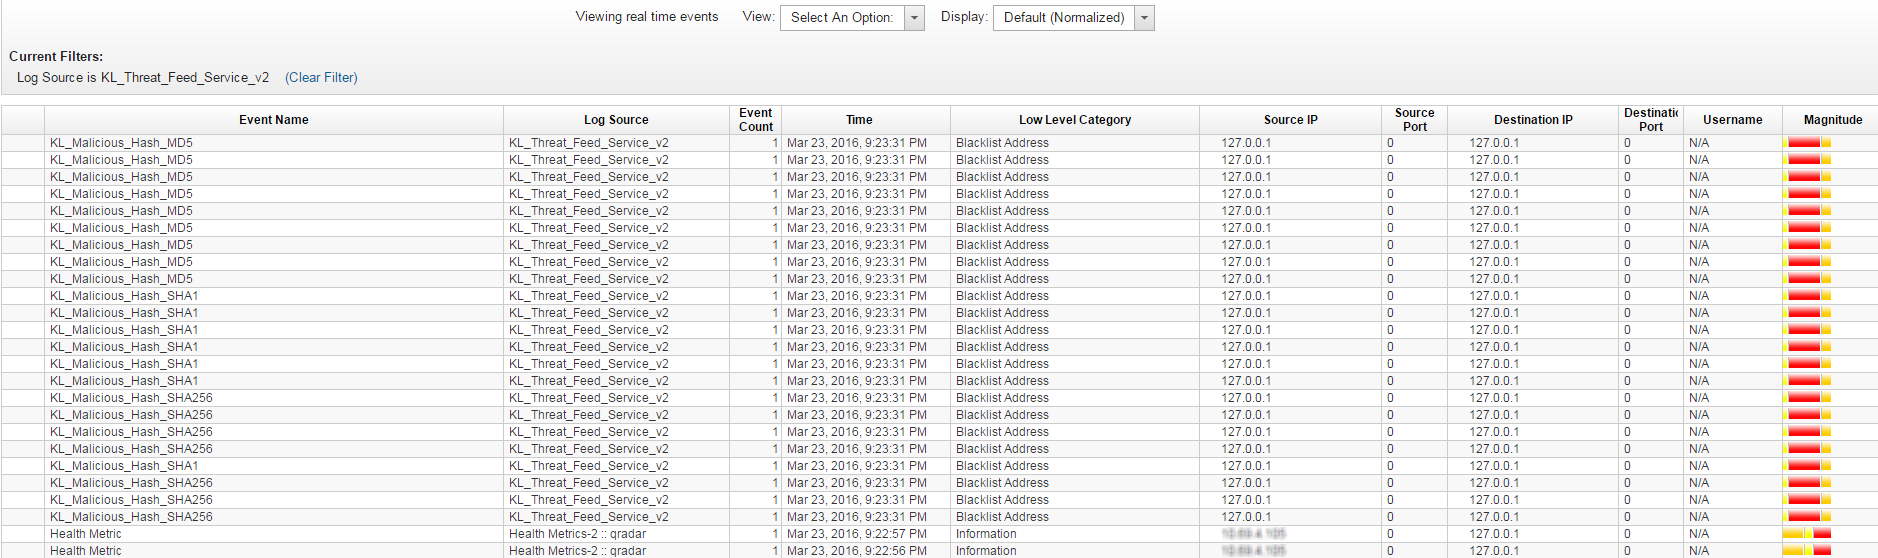
Browsing events from Feed Service
If the actual results of the test are the same as those expected, the integration of Feed Service with QRadar is correct.
Page topStep 5. Retrieving custom event properties
This section describes how to configure retrieval of custom event properties from Kaspersky CyberTrace outgoing events, in addition to standard fields. As a result of this setting, the MD5, SHA1, and SHA256 hashes will be extracted and the extraction rule of the Source IP field will be redefined.
To configure retrieval of custom event properties:
- Select the Log Activity tab, and then click Add Filter.
The Add Filter form opens.
- Fill in the form:
- In the Parameter drop-down list, select
Log Source [Indexed]. - In the Operator drop-down list, select
Equals. - In the Log Source list, select
KL_Threat_Feed_Service_v2.The selection
KL_Threat_Feed_Service_v2is the log source name that is set in theOutputSettings > EventFormatelement and theOutputSettings > AlertFormatelement of the Feed Service configuration file (you can also set them by using Kaspersky CyberTrace Web).
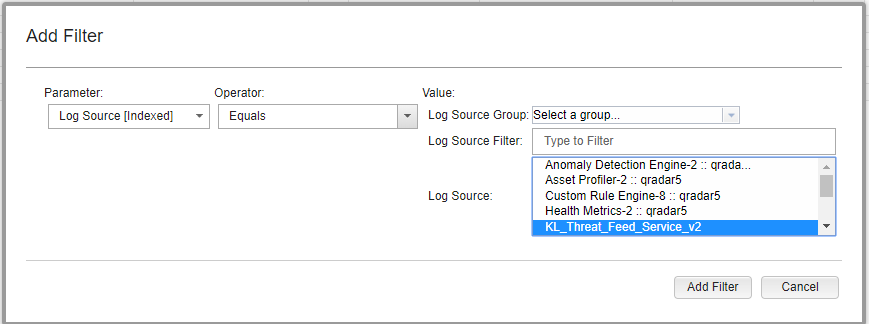
Adding a filter
- In the Parameter drop-down list, select
- Click Add Filter.
- Run the verification test, and then stop the events flow by clicking Pause (
 ) in the upper-right area of the window.
 - Press Ctrl (or Shift) to select several records, and then select Actions > DSM editor.
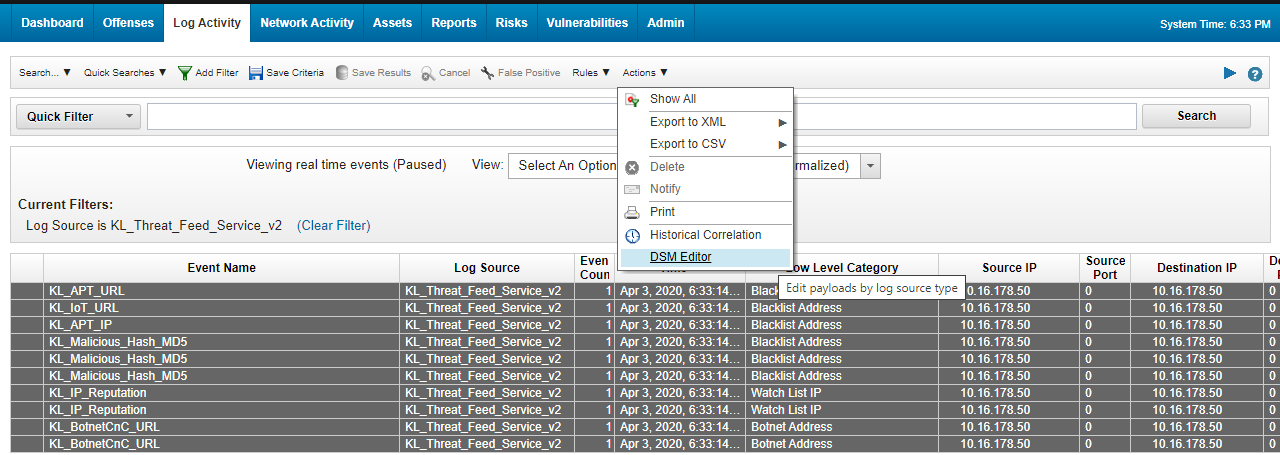
The Log Activity window
The DSM Editor window opens.
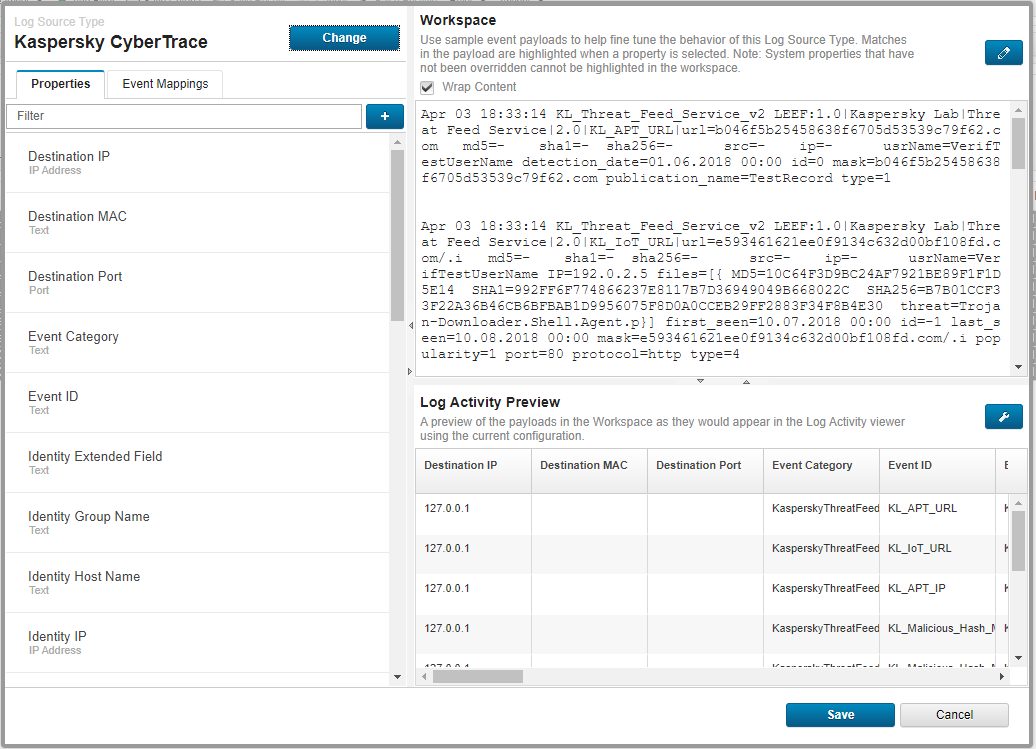
The DSM Editor window
- In the DSM Editor window, click the + button near the Filters text box.
The Choose a Custom Property Definition to Express form opens.
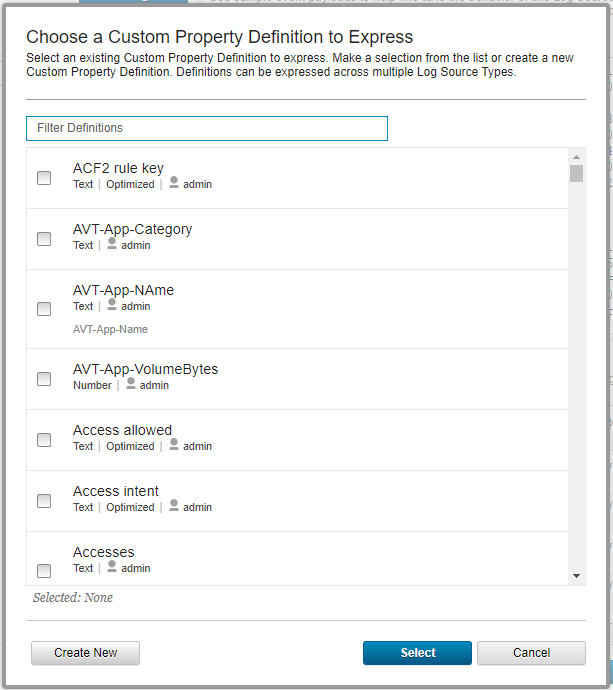
Choosing a custom property
- Click Create new.
The Create a new Custom Property Definition form opens.
- Fill in the form:
- In the Name field, enter
MD5. - In the Field Type drop-down list, select
Text. - In the Description field, enter a description of the property.
- Select the Enable this Property for Use in Rules and Search Indexing checkbox.
- Click Save.
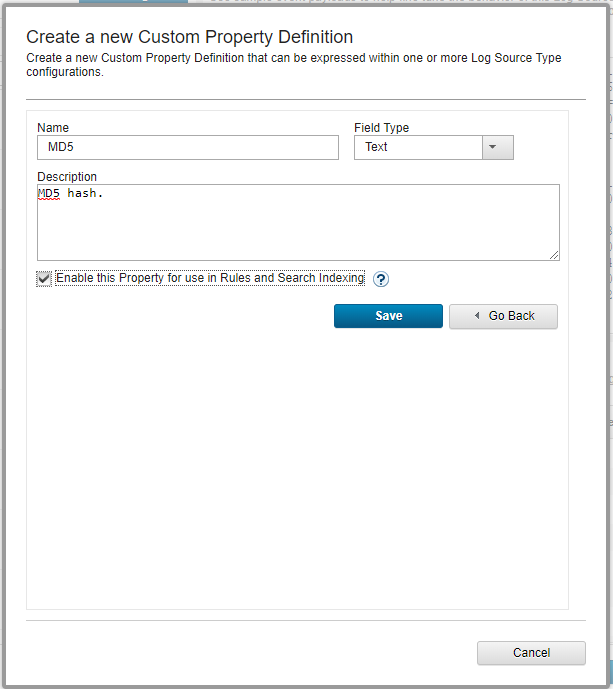
Creating a new custom property definition
- In the Name field, enter
- Add the
SHA1andSHA256properties similarly. - In the Choose a Custom Property Definition to Express window, select the created properties, add URL and Source IP, and then click Select.
- In the Log Activity Preview section, click Configure and then select the following properties:
Event NameIP (custom)MD5 (custom)SHA1 (custom)SHA256 (custom)Source IPURL (custom)Username
Click Update.
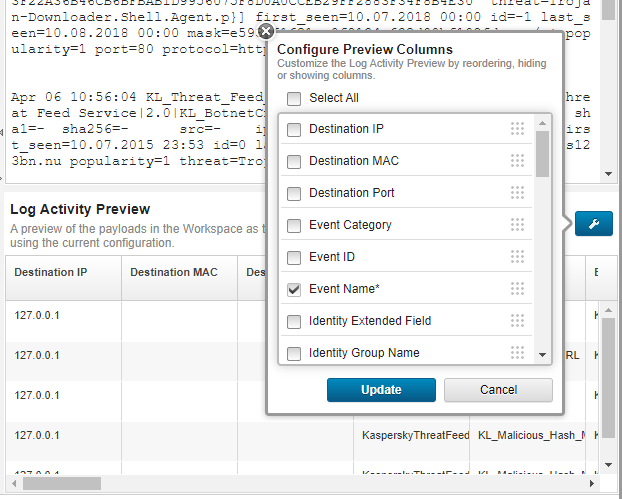
Configuring preview columns
- On the Properties tab, configure regular expressions as described in the table below:
Custom property
Regular expression
MD5
md5=([\da-fA-F]{32})SHA1
sha1=([\da-fA-F]{40})SHA256
sha256=([\da-fA-F]{64})URL
url=([-a-zA-Z0-9()@:%_\+.~#?&\/\/=]{2,})Source IP
src=(\d{1,3}\.\d{1,3}\.\d{1,3}\.\d{1,3})If necessary, type
1in the Capture Group field. - For the Source IP property, select the Override system behavior checkbox.
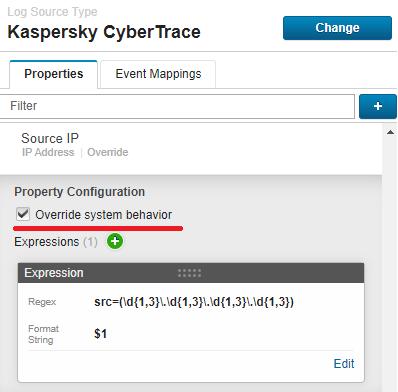
Source IP configuration
When changing the format for outgoing detection events in Kaspersky CyberTrace, the regular expressions that are specified above may require corresponding changes.
If all of the settings above are specified correctly, you will find the configured Custom properties in the Log Activity Preview section.
- Click Save and close the window.
- On the Log Activity tab, perform the new verification test.
After that, if you open the event received from
KL_Threat_Feed_Service_v2, the configured custom properties will be displayed.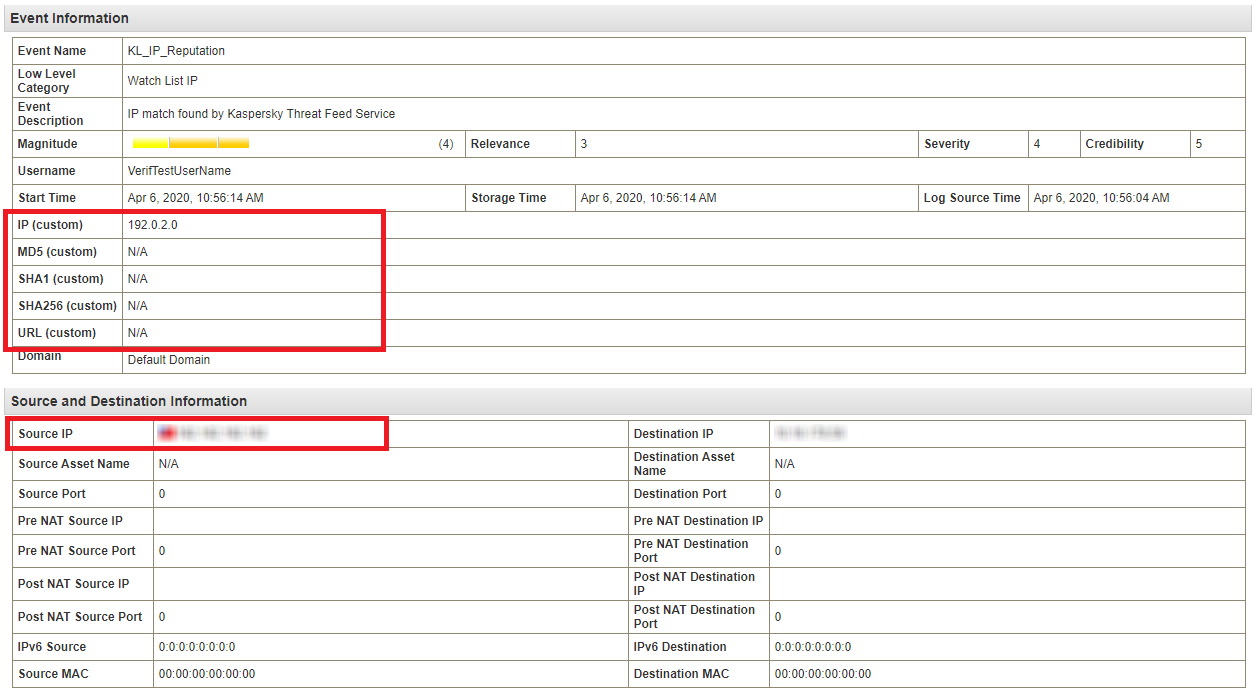
Event information
Step 6. Creating a search filter for CyberTrace events
This section describes how to create an event search.
To create an event search:
- Stop the events flow by clicking Pause () in the upper-right area of the window.
- In QRadar Console, select the Log Activity tab.
- Select Search > New Search.
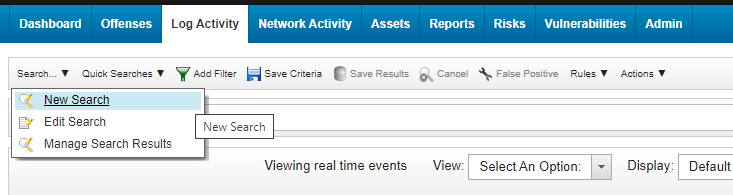
New search
- In the Column Definition form, add
MD5 (custom),SHA1 (custom),SHA256 (custom),URL (custom),IP (custom)from the Available Columns to the Columns list.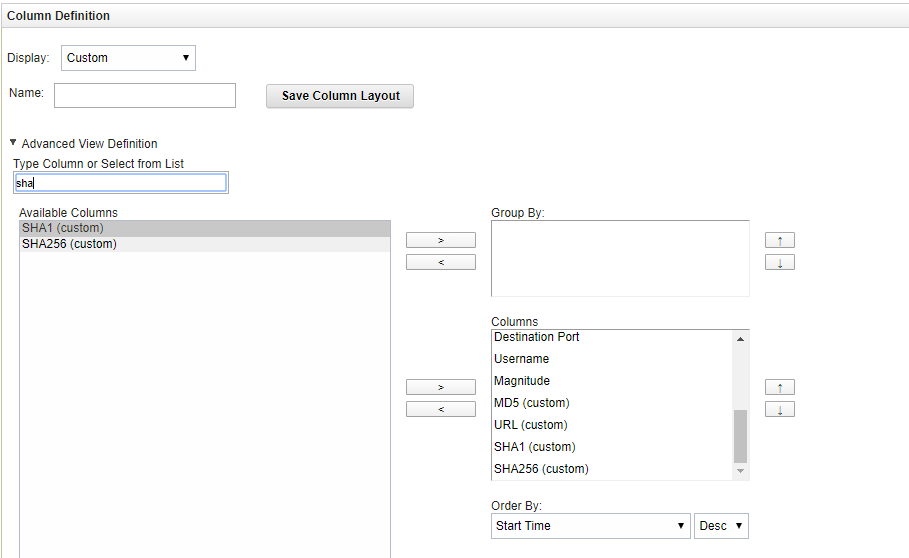
Defining columns
- Scroll down the page and in the Search Parameters form, set
KL_Threat_Feed_Service_v2as the log source:- In the Parameter drop-down list, select
Log Source [Indexed]. - In the Operator drop-down list, select
Equals. - In the Log Source list, select
KL_Threat_Feed_Service_v2.The selection
KL_Threat_Feed_Service_v2is the log source name that is set in theOutputSettings > EventFormatelement and theOutputSettings > AlertFormatelement of the Feed Service configuration file (you can also set them by using Kaspersky CyberTrace Web). - Click the Add Filter button.
The
Log Source is KL_Threat_Feed_Service_v2string will be added to the Current Filters list.
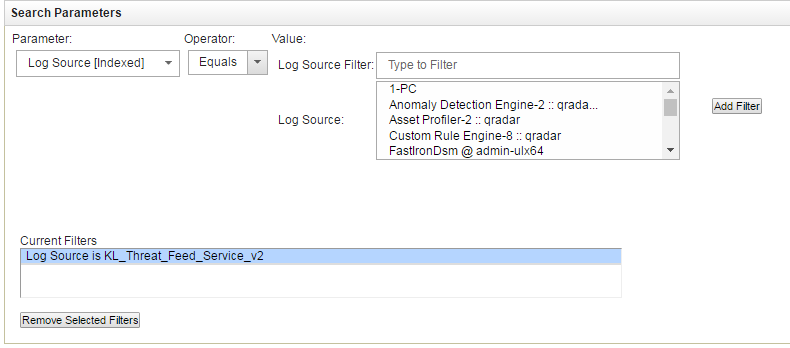
Setting the log source
- In the Parameter drop-down list, select
- Click either the Search button to display the search result.
- Click the Save Criteria button.

Save Criteria button
- In the Save Criteria form, type the name of the search in the Search Name text box, select the Include in my Quick Searches checkbox and then specify the analyzed interval for created search (for example, Real Time).
- Click OK.
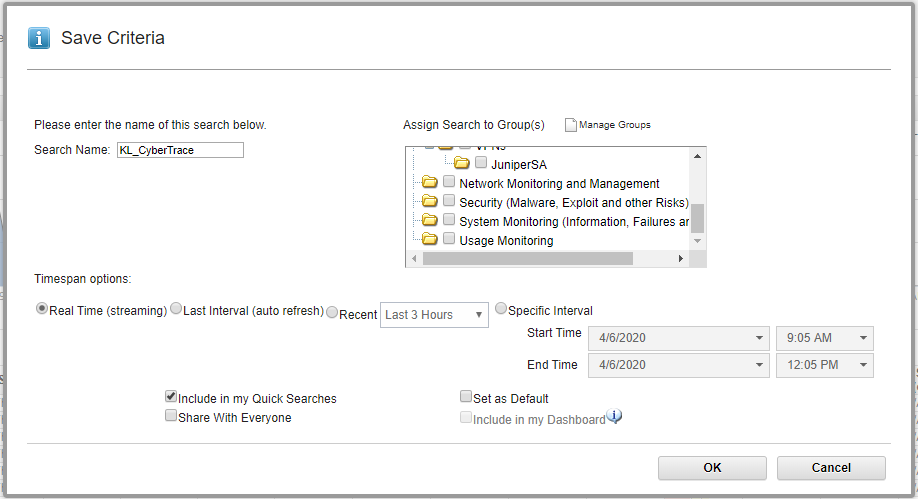
Saving criteria
Step 7 (optional). Displaying events in a dashboard
A QRadar dashboard presents detection results in visual format. For example, a chart displays the ratio of the number of events of different types.
QRadar 7.2.6 Patch 3 or later is required. Using an earlier version can lead to incorrect results.
Adding a chart that displays the detection results of Feed Service in visual format involves three procedures:
- Create an event search.
- Add a chart to a dashboard.
- Adjust the added chart.
Creating an event search
The following procedure describes how to create an event search.
To create an event search:
- In QRadar Console, select the Log Activity tab.
- Select Search > New Search.
- In the Column Definition form, delete
Event Namefrom the Available Columns list and addEvent Nameto the Group By list.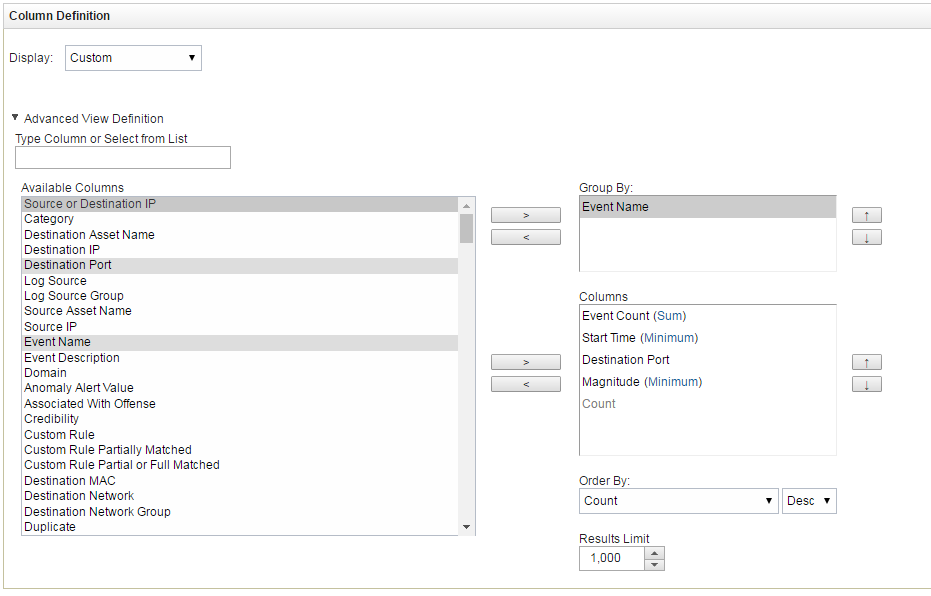
Defining columns
- Scroll down the page and in the Search Parameters form, set
KL_Threat_Feed_Service_v2as the log source:- In the Parameter drop-down list, select
Log Source [Indexed]. - In the Operator drop-down list, select
Equals. - In the Log Source list, select
KL_Threat_Feed_Service_v2.The selection
KL_Threat_Feed_Service_v2is the log source name that is set in the detection events format and alert events format parameters on the Events format tab of Kaspersky CyberTrace Web. - Click the Add Filter button.
The
Log Source is KL_Threat_Feed_Service_v2string will be added to the Current Filters list.
Setting the log source
- In the Parameter drop-down list, select
- Click either the Filter button or the Save button to display the search result.
- Click the Save Criteria button.
Save Criteria button
- In the Save Criteria form, select the Include in my Dashboard check box, type the name of the search in the Search Name text box, and then click OK.
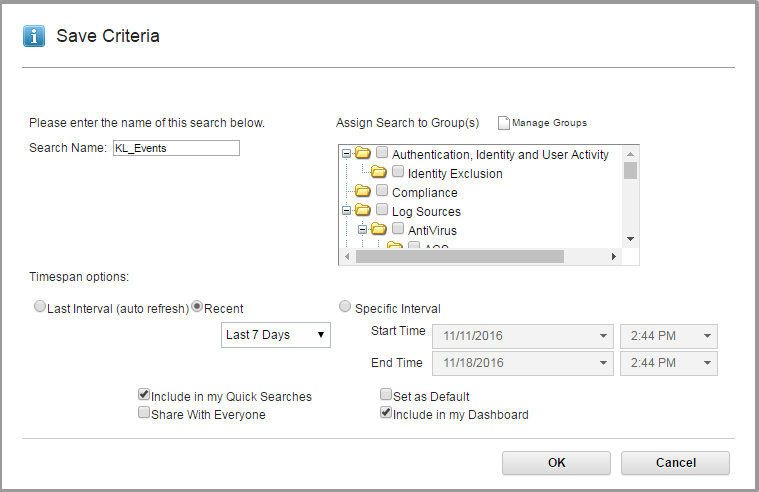
Saving criteria
Adding a diagram to a dashboard
The following procedure describes how to add a diagram to a dashboard.
To add a diagram to a dashboard:
- In QRadar Console, select the Dashboard tab.
- Select Add Item > Log Activity > Event Searches > KL_Events.
Here,
KL_Eventsis the name of the search that you set.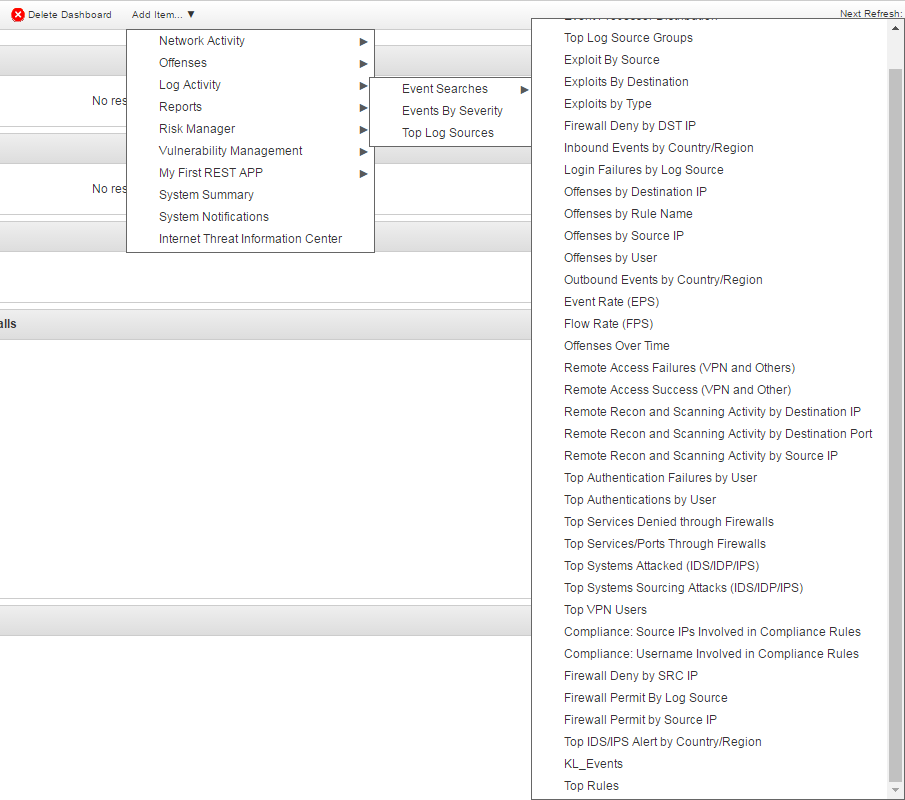
Adding an item to the dashboard
A chart will appear on the dashboard.
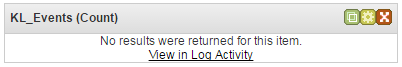
New chart
Adjusting the added chart
The following procedure describes how to adjust the chart that has been added to the dashboard.
To adjust the added chart:
- Click the Settings button (
 ) in the upper-right corner of the chart box.
 - Specify the settings of the chart.
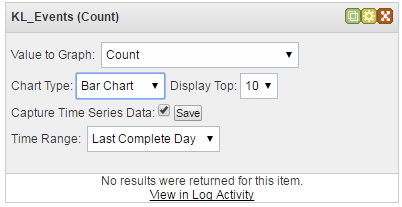
Chart settings
If you select the Capture Time Series Data check box, the chart will display all incoming data received after this check box is selected; the item selected in the Time Range drop-down list will be ignored. If you clear the Capture Time Series Data check box, only the information received during the time range selected in the Time Range drop-down box will be displayed.
After events arrive, the chart displays them.
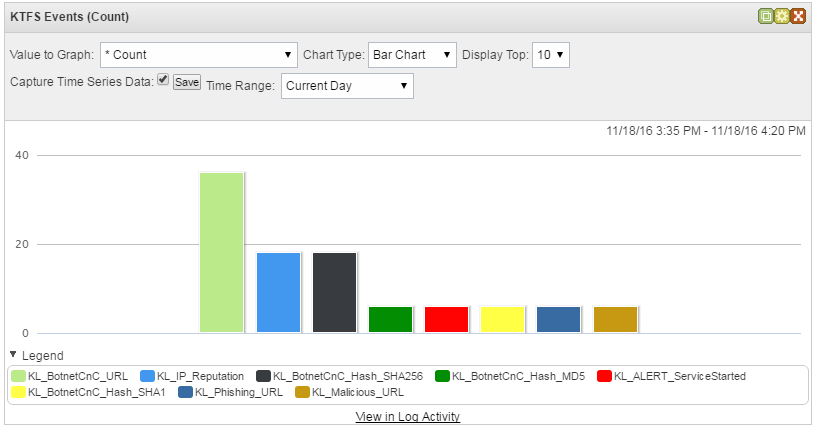
Bar chart
In the Chart Type drop-down list you can select the type of chart in which the data will be displayed.
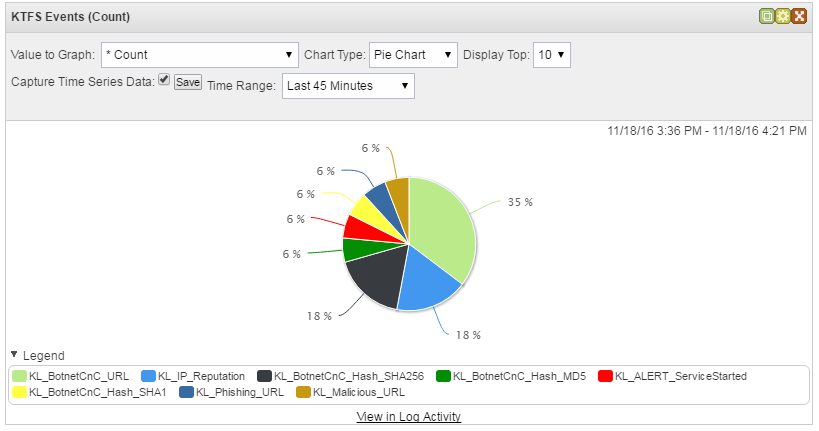
Pie chart
You can also get information about charts, which are based on the search results, from QRadar Help (section "Dashboard management" > "Adding search-based dashboard items to the Add Items list").
Page topStep 8 (optional). Creating notifications about incoming service events
You can create notifications about issues with Kaspersky CyberTrace by configuring alert rules.
To create notifications about service events from Kaspersky CyberTrace in QRadar:
- Run QRadar Console.
- Select any of the Offenses, Log Activity or Network Activity tabs, and then select Rules.
- In the Actions drop-down list, select New Event Rule.
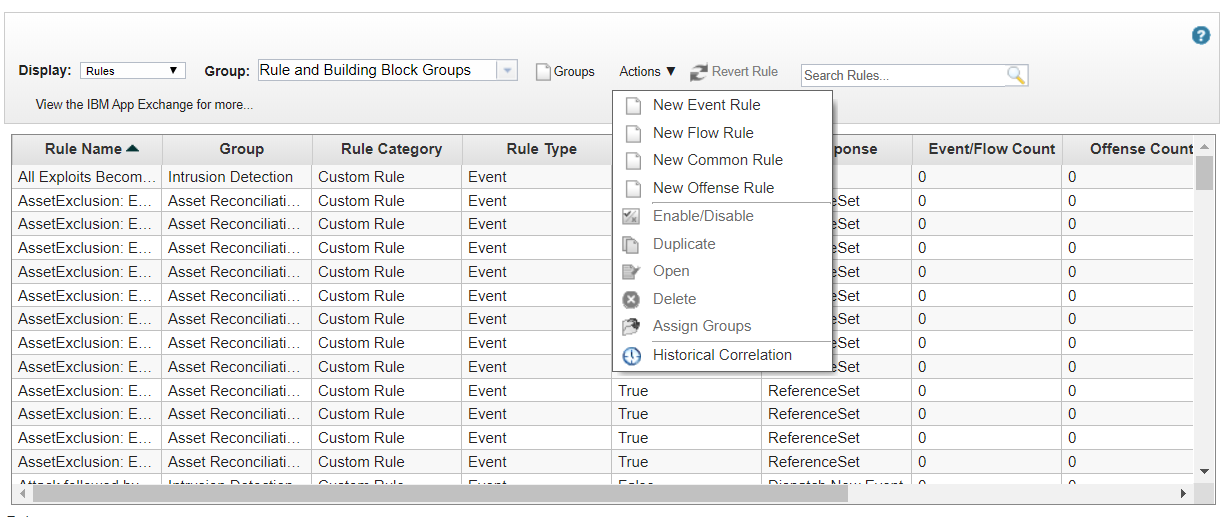
The Rules page
The Rule Wizard page opens.
- On the Rule Wizard page, click Next to select the source from which you want the rule to be generated.
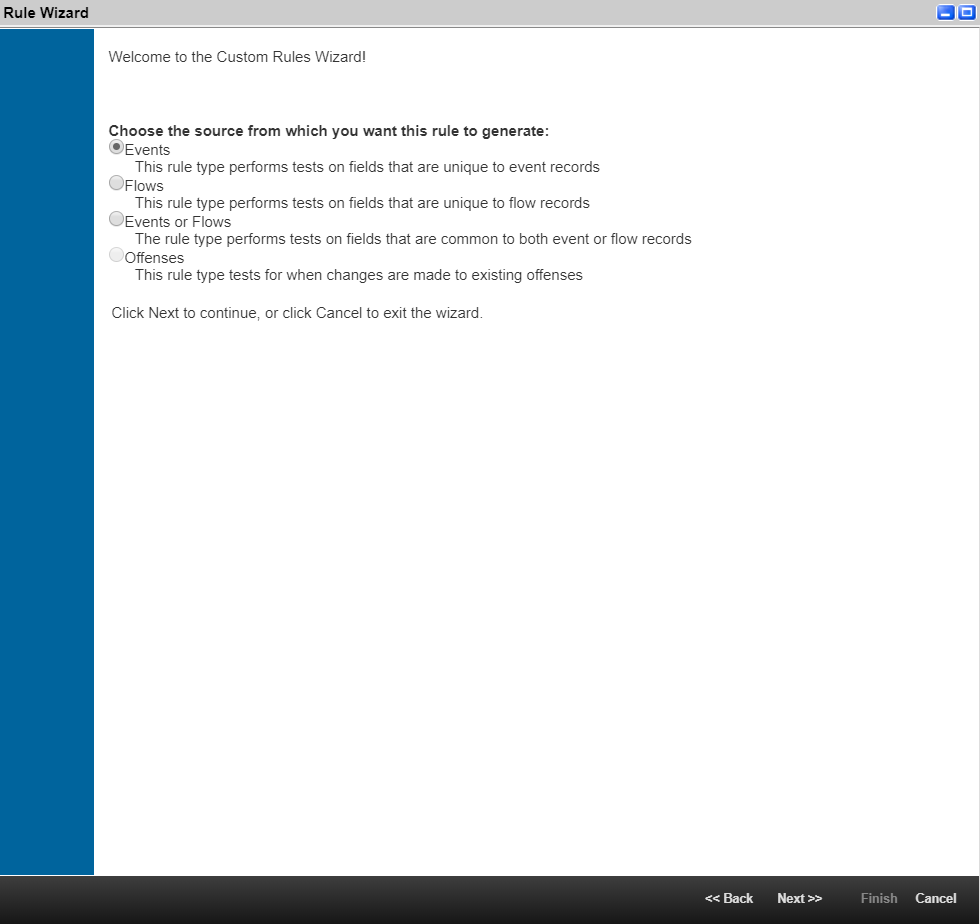
The Rules Wizard window
- Select Events, and then click Next.
- On the Rule Test Stack Editor page, perform the following actions:
- Add the following test conditions for a new rule:
when the event(s) were detected by one or more of these log sourceswhen the event matches this search filter
- For each specified condition, set a logical
andoperator. - For the
when the event(s) were detected by one or more of these log sourcescondition, specify Log Source that is equal toKL_Threat_Feed_Service_v2. If this event source is absent, add Feed Service as a log source. - For the
when the event matches this search filtercondition, specify a filter for comparing Event Name with the value of the event source name by performing the following actions:- In the list of the event fields, select Event Name.
- In the list of conditions, select Equals.
- Click Browse to choose the name of the service event for which the rule is created.
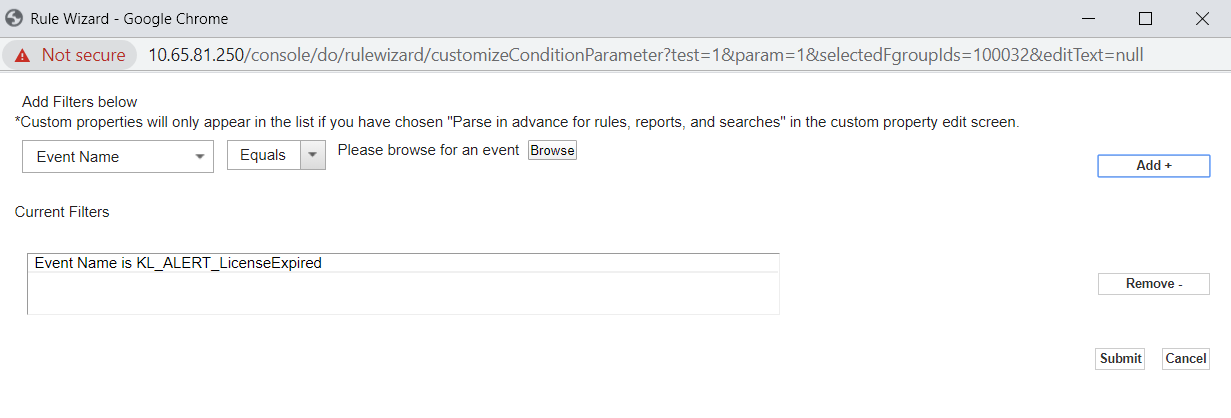
- Click Add+, and then Submit.
If the necessary event is absent, add it to the QRadar Identifiers (QID) list.
- Enter the name of the rule and select the way in which this rule will be applied to the incoming events (Local or Global). For more information about the Local and Global rules, see IBM documentation.
- Select the group that you need for the rule.
- Add a description for the rule.
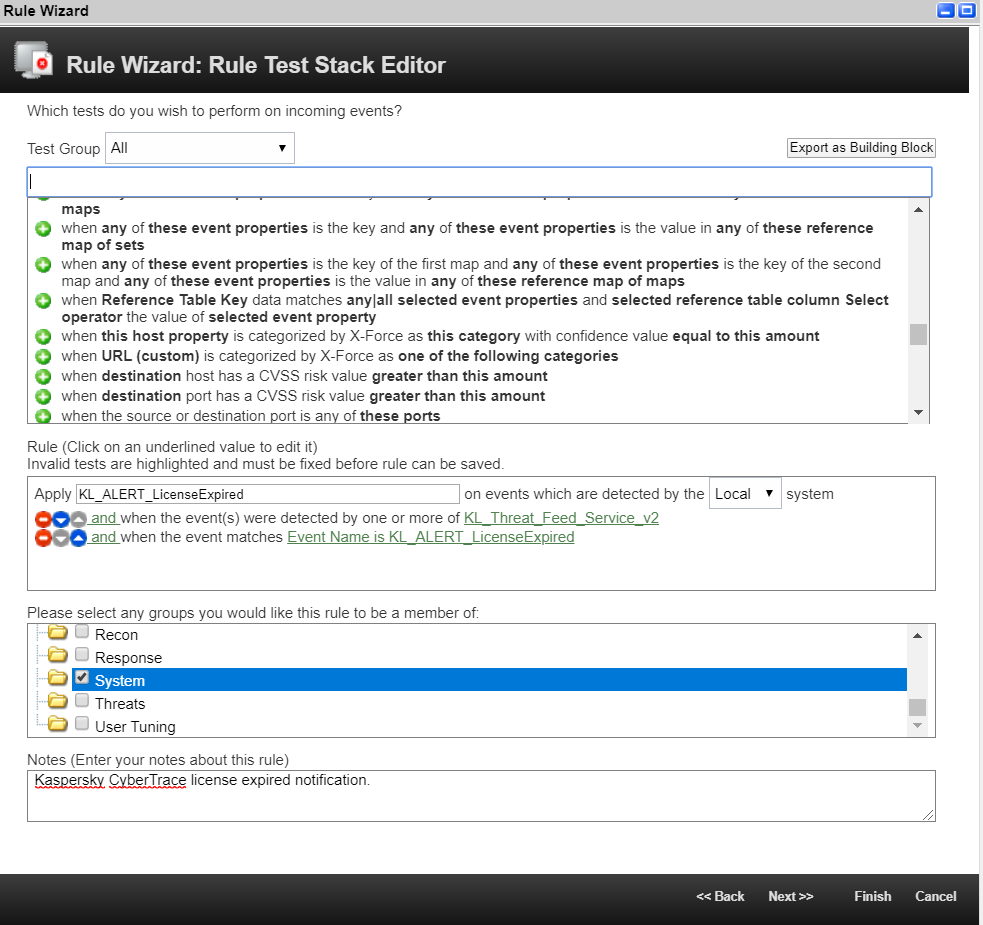
The Rule Editor window
- Click Next.
- Add the following test conditions for a new rule:
- On the Rule Response page, perform the following actions:
- Select Notify.
- If necessary, specify a limit on a rule triggering in the Response Limiter section.
- Check the Enable Rule section.
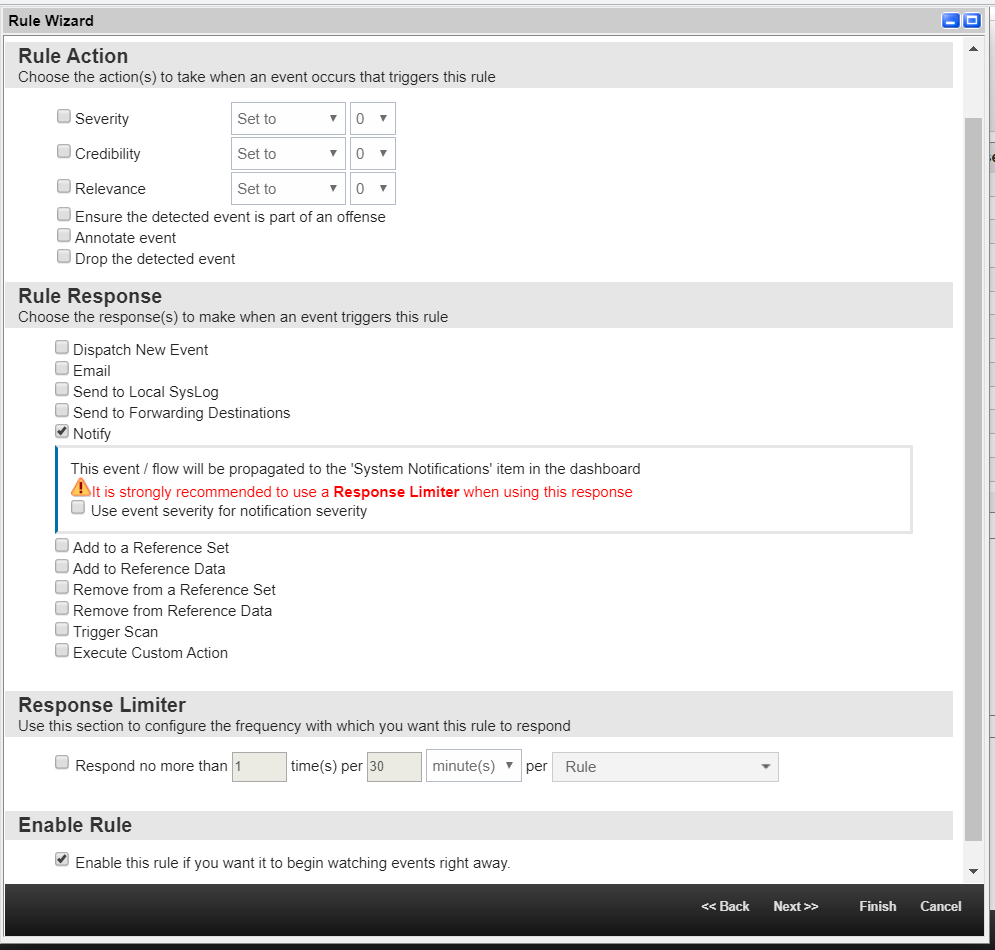
The Rule Editor page
- Click Next
- On the Rule Summary page, make sure that all settings are specified correctly, and click Finish.
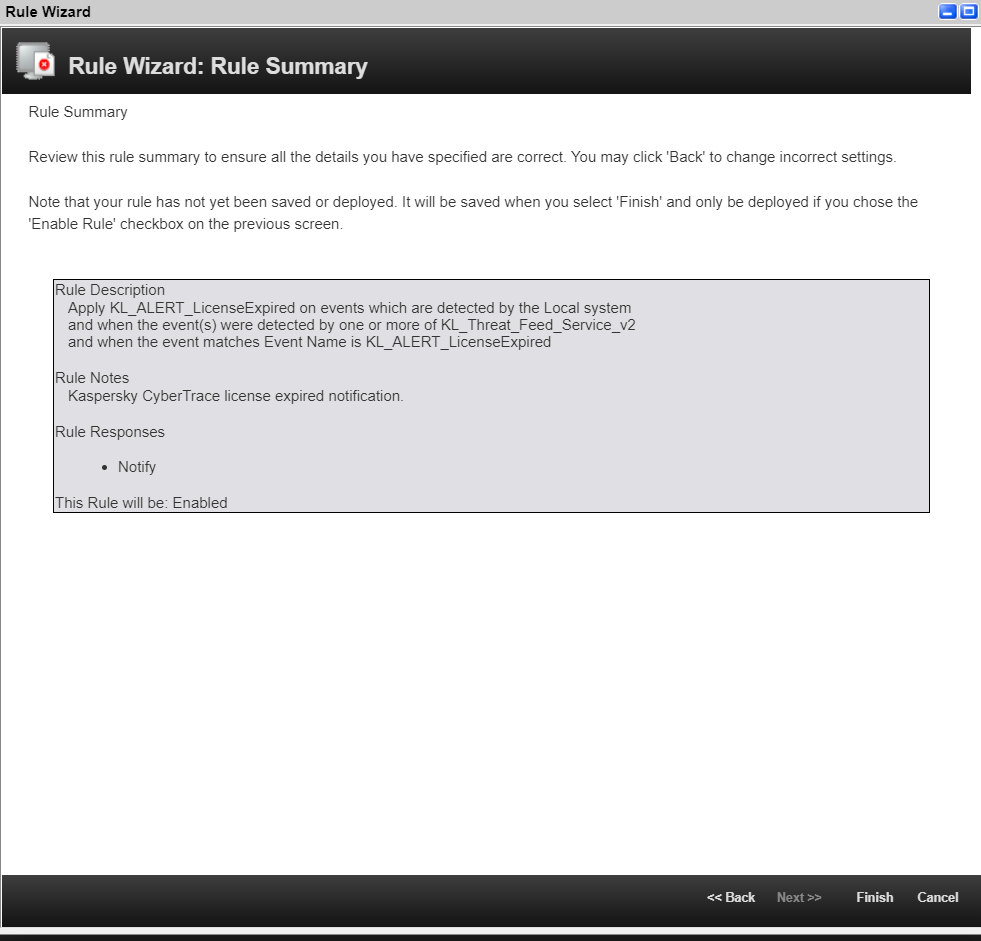
The Rule Summary page
The rule will now be added to the Rules list.
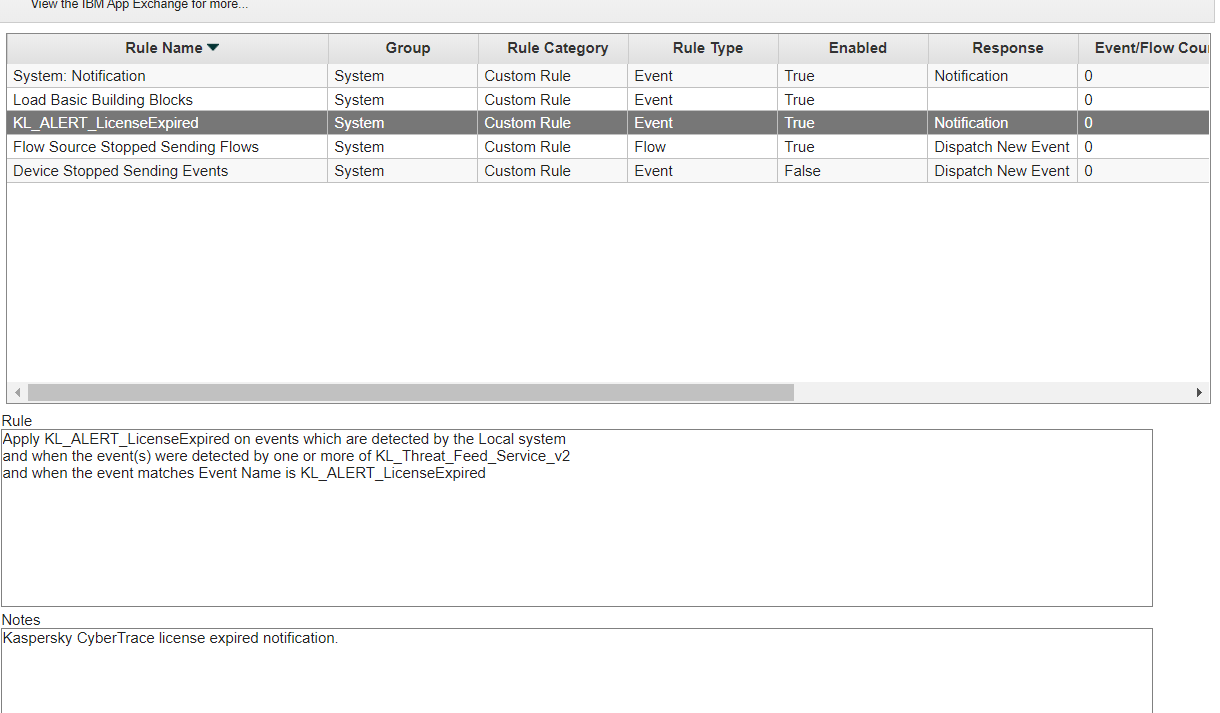
The Rules list
The added rule generates a notification about an incoming service event. You can browse these notifications by clicking the Messages drop-down list. Also, notifications are displayed in QRadar Console as a pop-up message.
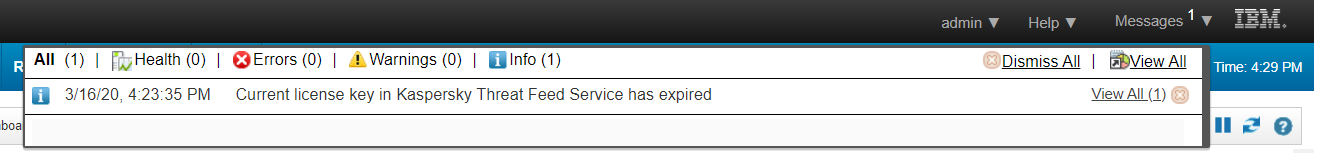
The Messages drop-down list
You can configure displaying of notifications on the Dashboard tab.
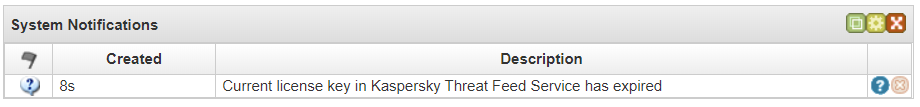
System notifications on the Dashboard tab
To configure displaying of notifications on the Dashboard tab:
- Select the Dashboard tab.
- In the Add Item drop-down list, select System Notifications.
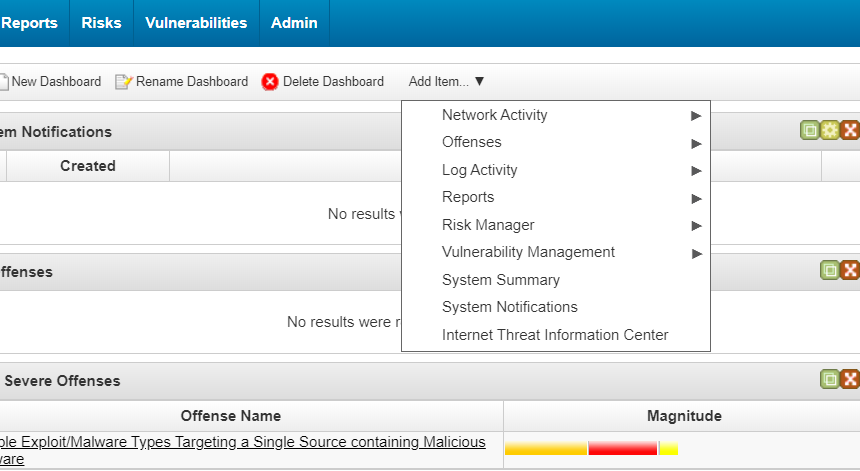
Adding system notifications on the Dashboard tab
Step 9 (optional). Installing Kaspersky Threat Feed App
This section describes how to install Kaspersky Threat Feed App.
Only a user account that has the System Administrator role can manage Kaspersky Threat Feed App.
Getting Kaspersky Threat Feed App
You can get the Kaspersky Threat Feed App installation package from IBM Security App Exchange.
Installing Kaspersky Threat Feed App
To install Kaspersky Threat Feed App:
- In QRadar, select Admin and then Extensions Management.
- In the Extensions Management form, click the Add button.

Extensions Management form
- Select the application file archive.
- Select the Install immediately check box.
- Click Add.
- Click Install.
A list of changes to be made is displayed. In particular, the custom event properties that will be added are displayed.
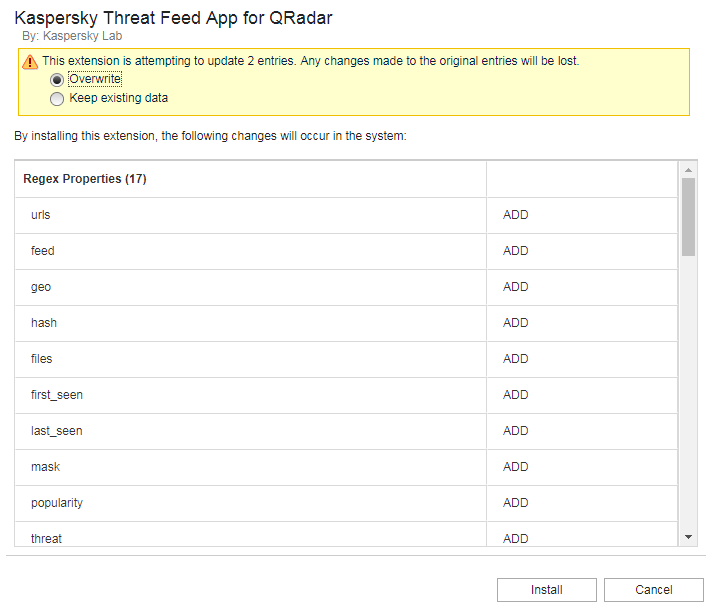
Custom event properties to be added
The following custom event properties are added when the app is installed:
urlsfeedgeohashfilesfirst_seenlast_seenmaskpopularitythreatwhoisURLSHA1 HashSHA256 HashMD5 Hashiprecords_count
You will use these properties to enable the indexes of the added custom event properties and to specify the log source type.
- Click Install again.
Kaspersky Threat Feed App appears in the Extensions Management form after it is installed.
- Refresh the browser window before you use the app.
After Kaspersky Threat Feed Service App is installed, its name will appear as a tab—Kaspersky Data Feeds—in QRadar Console.

Kaspersky Data Feeds tab
- In QRadar Console, select Kaspersky Data Feeds tab.
The Configuration required form will appear.
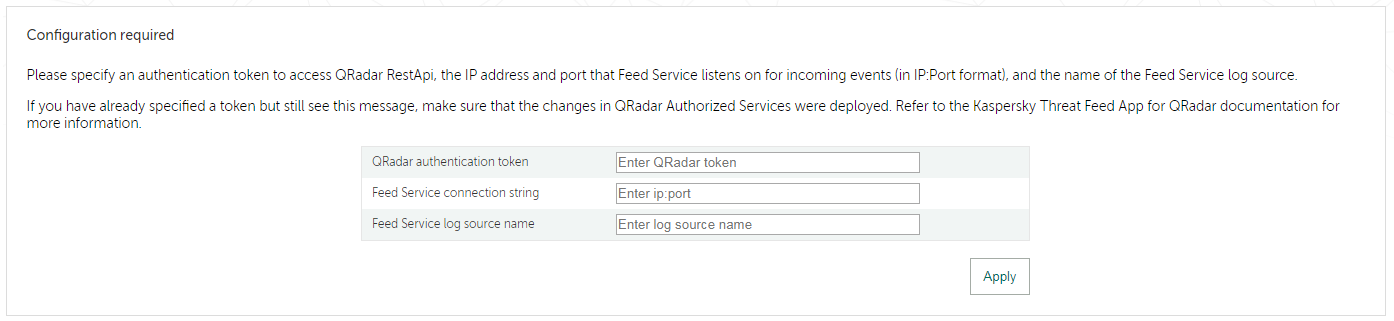
Configuration required form
- In the Configuration required form:
- In the QRadar authentication token field, specify an authentication token to access QRadar REST API.
You can specify an existing token or create a new token.
If the specified token expires, the Configuration required form will appear again the next time you select Kaspersky Data Feeds. In this case, you must specify a new token.
- In the Feed Service connection string field, specify the IP address and port that Feed Service listens on for incoming events.
You cannot specify the
127.0.0.1IP address, even if Kaspersky Threat Feed App is installed on the QRadar computer. Instead, specify the external IP address of the QRadar computer. - In the Feed Service log source name field, specify the log source name of Feed Service as it is registered in QRadar.
This name is displayed in the Name column of the window that opens after Admin > Log Sources is selected in QRadar Console. For example,
KL_Threat_Feed_Service_v2.For more information about specifying log sources, see the section about configuring Kaspersky Threat Feed App.
- In the QRadar authentication token field, specify an authentication token to access QRadar REST API.
Step 10 (optional). Enabling the indexes of the added custom event properties
We recommend that you enable the indexes of the added custom event properties. This will increase the performance of Kaspersky Threat Feed App.
To enable the indexes of the added custom event properties:
- In QRadar, select Admin and under System Configuration select Index Management.
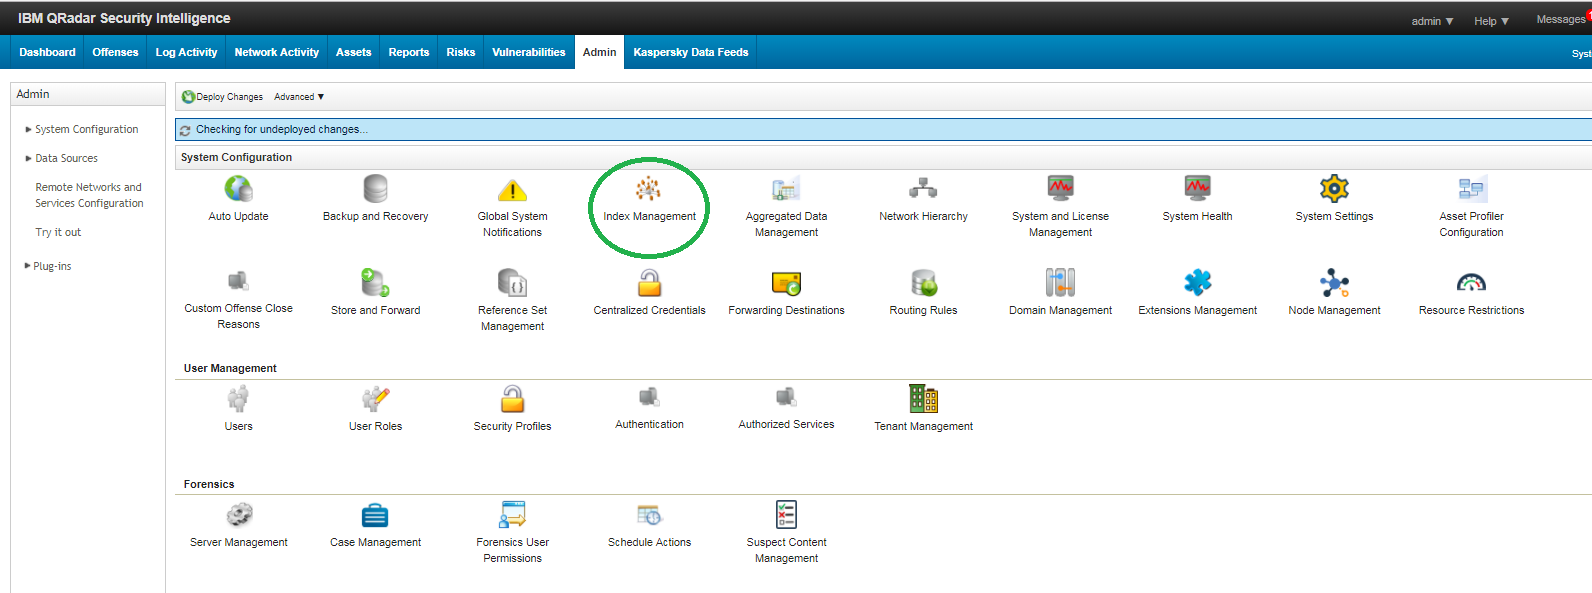
Admin tab of QRadar Console (system configuration tools)
The Index Management window opens.
- Optionally, specify the filter to find the added properties.
- Select one or several table rows, and click Enable Index.
- Click Save.
A message box appears that asks you whether you want to save the changes you made.
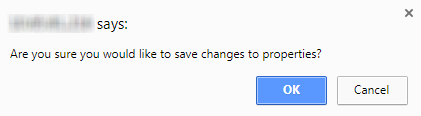
Saving changes to the indexes
- Click OK to save changes to the properties.
Step 11 (optional). Configuring Kaspersky Threat Feed App
You can configure Kaspersky Threat Feed App by selecting the Settings link in QRadar Console.

Settings link
You specify the settings in a form that appears after you select the Settings link.
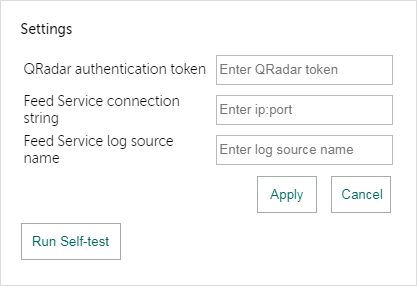
Settings form
The following settings fields are available:
- QRadar authentication token
The authentication token to access QRadar RestApi.
You can specify an existing token or create a new token.
- Feed Service connection string
The IP address and port that Feed Service listens on for incoming events.
If you have installed Kaspersky CyberTrace on the same computer on which QRadar is installed, Kaspersky Threat Feed App will not be able to connect to QRadar because the iptables rules forbid the communication of a Docker container, in which Kaspersky Threat Feed App is running, and the QRadar computer.
To make Kaspersky Threat Feed App work on the QRadar computer, connect to the QRadar computer using the SSH protocol and run the following command:
iptables -I INPUT -i <D_interface> -p tcp --destination-port <FS_port> -j ACCEPTThis command includes:
-
<D_interface>—Interface of the Docker container that contains Kaspersky Threat Feed App for QRadar.To find the
<D_interface>name, perform the following:- Find the identifier of Kaspersky Threat Feed App by running the following command:
psql -U qradar -c "select id, name from installed_application;"A table appears. Find the value for the identifier of Kaspersky Threat Feed App (hereinafter
<app_id>) from theidcolumn. - Find the identifier of the Docker container in which Kaspersky Threat Feed App is contained by running the following command:
docker psIn the output result, find the image with the
.../qapp/<app_id>:x.x.xname, wherex.x.xis the installed version of Kaspersky Threat Feed App, and find itsCONTAINER IDvalue (hereinafter<container_id>). - Find the interface name for the Docker image that contains Kaspersky Threat Feed App, by running the following command:
docker inspect <container_id> | grep NetworkModeThe output result appears, in the format
"NetworkMode": "<D_interface>". Substitute this result for<D_interface>in the command above.
- Find the identifier of Kaspersky Threat Feed App by running the following command:
<FS_port>—Port that Feed Service listens on for incoming events.
If you run the above command, the added rule will be present in iptables only until iptables is restarted, or the QRadar computer is restarted. To add this rule permanently, add it to the
/etc/sysconfig/iptablesfile (the path to the iptables file depends on the environment configuration).Also note that you cannot specify the
127.0.0.1IP address even if Kaspersky Threat Feed App is installed on the QRadar computer. Specify the external IP address of the QRadar computer instead. -
- Feed Service log source name
The log source name of Feed Service as it is registered in QRadar. This name is displayed in the Name column of the window that opens after Admin > Log Sources is selected in QRadar Console.
If the Feed Service log source was added automatically when you sent the initial set of Feed Service events to QRadar, the log source name is
Kaspersky Threat Feed Service @ [id], where[id]is the identifier of Feed Service events. (By default,[id]isKL_Threat_Feed_Service_v2). If you had to add Feed Service to QRadar as a log source manually because you did not have the latest QRadar updates, the log source name is[id];that is,KL_Threat_Feed_Service_v2by default.It takes some time to visualize the requested data after you have changed the log source name or the installed Kaspersky Threat Feed App. While the data is being loaded, a progress bar is displayed. The time required for getting all the data depends on the selected period over which the data is visualized.
After you configure Kaspersky Threat Feed App, you can run the verification test by clicking the Run self-test button.
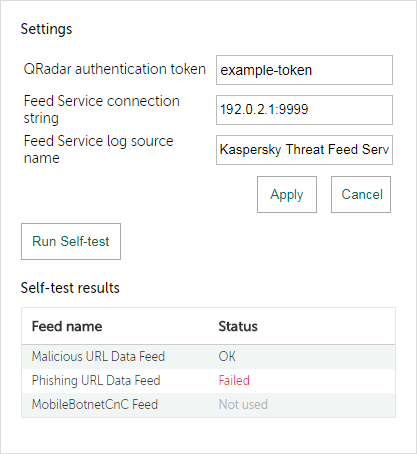
Self-test results
A test result of Failed for any feed means that a tested object is assigned to an incorrect category. The error can originate, for example, in an incorrect configuration file.
Integration with RSA NetWitness
This chapter describes how to integrate Kaspersky CyberTrace with RSA NetWitness.
Integration steps (RSA NetWitness)
This chapter describes how to integrate Kaspersky CyberTrace with RSA NetWitness.
About the integration schemes
The recommended integration scheme for integrating Kaspersky CyberTrace with RSA NetWitness is the standard integration scheme.
How to integrate with RSA NetWitness
Before you start to integrate Kaspersky CyberTrace with RSA NetWitness:
- Before you install Kaspersky CyberTrace, make sure that the RSA NetWitness services meet the software requirements.
- Make sure that you have installed Kaspersky CyberTrace.
To integrate Kaspersky CyberTrace with RSA NetWitness:
- Step 1. Configure RSA NetWitness so that it will forward the received events to Feed Service.
- Step 2. Configure RSA NetWitness to receive events from Feed Service.
- Step 3 (optional). Import a meta group for browsing all fields in RSA NetWitness that are filled by Feed Service.
- Step 4 (optional). Import the Feed Service rules to RSA NetWitness.
- Step 5 (optional). Import a preconfigured report to RSA NetWitness.
This step requires importing Feed Service rules (Step 4).
- Step 6 (optional). Import preconfigured charts and a dashboard to RSA NetWitness.
This step requires importing Feed Service rules (Step 4).
- Step 7. Perform the verification test.
Please make sure you perform the verification test before editing any matching process settings.
Before you begin (RSA NetWitness)
This section describes additional requirements that must be met before you integrate Kaspersky CyberTrace with RSA NetWitness.
Checking software settings (RSA NetWitness)
This section describes the requirements that the RSA NetWitness services must meet.
Check that the following conditions are met:
- The index file (index-concentrator-custom.xml) of the Concentrator which receives Feed Service events must contain the following metafields:
virusnameThis and other metafields (except for
msg) must have theIndexValueslevel. Also, set thedefaultActionvalue of these metafields toOpen.user.srcip.srcactionmsgThis metafield must have the
IndexKeys(the presence of the metafield in an event is indexed) orIndexNone(the metafield is not indexed) level in the index-concentrator-custom.xml file. If you set theIndexValueslevel for this metafield, the hard disk space will be consumed rapidly.event.sourcedevice.ipip.dsturlchecksum
If any of these fields are absent from the index file, add them there and restart the Concentrator, as described in the section about RSA NetWitness troubleshooting.
If you do not have a Concentrator but you use a Log Decoder for storing data from Feed Service, change the index-logdecoder-custom.xml file and restart the Log Decoder as described above.
Update only the index file of a Concentrator (index-concentrator-custom.xml) if the Concentrator receives data from a Log Decoder. For more information, refer to https://community.rsa.com/docs/DOC-41760. Also, update the index file of a Log Decoder (index-logdecoder-custom.xml) if you use the Log Decoder as the source of data in which you search for events or if you use the Log Decoder to create reports or dashboards.
- The table-map-custom.xml configuration file (the configuration file of a Log Decoder) must contain the following metafields:
virusnamec_usernamesaddrdaddrurlchecksummsgevent_sourcehostipaction
The value of the
flagsattribute must beNonefor each of these metafields.If any of these fields are absent from the index files, refer to the section about RSA NetWitness troubleshooting.
Detection events sent by Feed Service contain the context from the feeds in separate fields. You can display and use these fields in RSA NetWitness. (In RSA NetWitness, the names of these fields will have the kl. prefix.)
To display the context fields:
- Add the contents of
%service_dir%/integration/rsa/additional_elements/table-map-custom.xmlto thetable-map-custom.xmlfile of the log decoder to which Feed Service will send detection events. - Add the contents
%service_dir%/integration/rsa/additional_elements/index-concentrator-custom.xmlto theindex-concentrator-custom.xmlfile of the Concentrator that will store the events from Feed Service.
You can specify all the settings described above by using the RSA NetWitness web user interface in the Services (Log Decoder and Concentrator) > Config view.
Restart the log decoder and Concentrator after you have edited the table-map-custom.xml and index-concentrator-custom.xml files.
Page topStandard integration (RSA NetWitness)
This section contains instructions for integrating Kaspersky CyberTrace and RSA NetWitness in the standard integration scheme.
About the standard integration scheme (RSA NetWitness)
This section describes the standard integration scheme for RSA NetWitness and Kaspersky CyberTrace.
About the components of the standard integration scheme
The following components are used in the standard integration scheme for RSA NetWitness:
- Feed Service
This service matches RSA NetWitness events against Kaspersky Threat Data Feeds.
- RSA NetWitness
The SIEM solution used in this integration.
- Security controls
These are sources of events for RSA NetWitness such as firewalls, proxies, intrusion detection systems, and other networking devices.
Security controls can send events to RSA NetWitness by any method supported by RSA NetWitness.
Standard integration scheme
In the standard integration scheme, Feed Service by default is configured to listen for incoming events from RSA NetWitness on 127.0.0.1:9999.
Feed Service sends detection events to IP address 127.0.0.1 and port 514 of the interface defined in RSA configuration. The address of this interface is specified when you install Kaspersky CyberTrace. Security controls also send events to port 514 of the interface defined in the RSA NetWitness configuration.
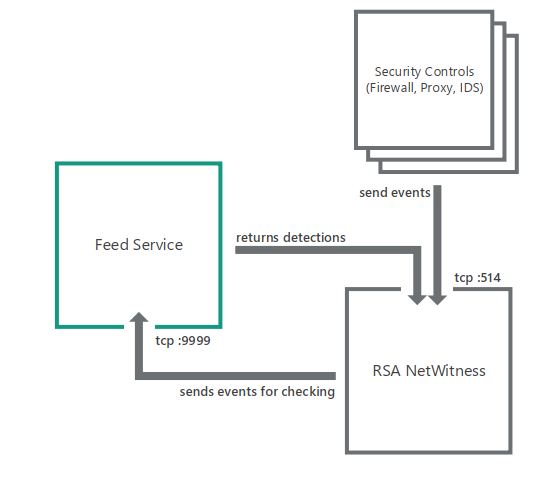
Standard integration scheme for RSA NetWitness
Page topStep 1. Forwarding events from RSA NetWitness
This section describes how to configure RSA NetWitness so that it will forward the received events to Feed Service.
To forward events from RSA NetWitness to Feed Service:
- In the RSA NetWitness main window, select Administration > Services.
- In the Services table, below, select the relevant Log Decoder (the Log Decoder that receives events containing a URL, hash, or IP address).
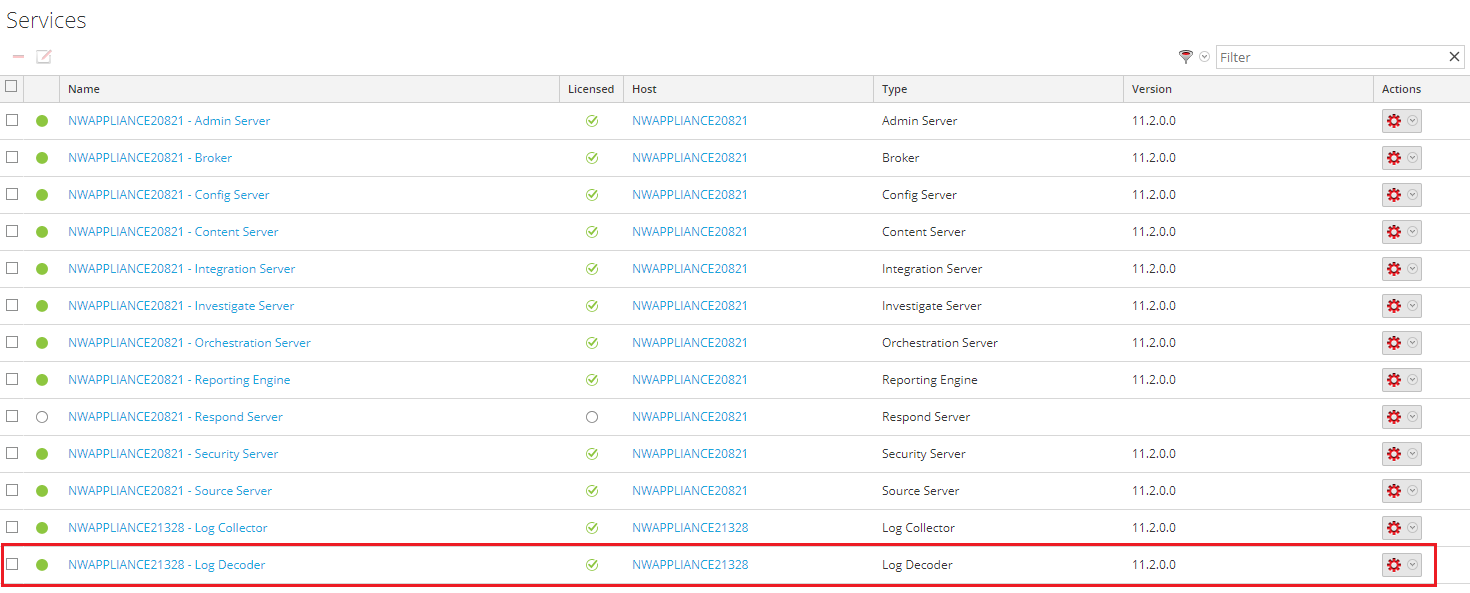
Selecting a Log Decoder
If more than one Log Decoder is used for receiving events, repeat the following steps for each Log Decoder.
- For the selected Log Decoder, in the Actions column, select the Settings split button (
 ) and in the drop-down list select View > Config.
 - Select the App Rules tab and click the Add button (
 ).
).The Rule Editor window opens.
- Specify the following data:
- Rule Name:
cybertrace - Condition:
device.type='%DEVICE_NAME_1%'This is an example of a condition, in which the
%DEVICE_NAME_1%string represents the name of the device whose events must be sent to Feed Service. Following is another example of a condition, according to which events from Cisco ASA and Check Point Firewall must be sent to Feed Service:device.type='ciscoasa' || device.type='checkpointfw1'If an event meets the condition specified here, it will be sent to Feed Service.
- Alert: Selected
- Forward: Selected
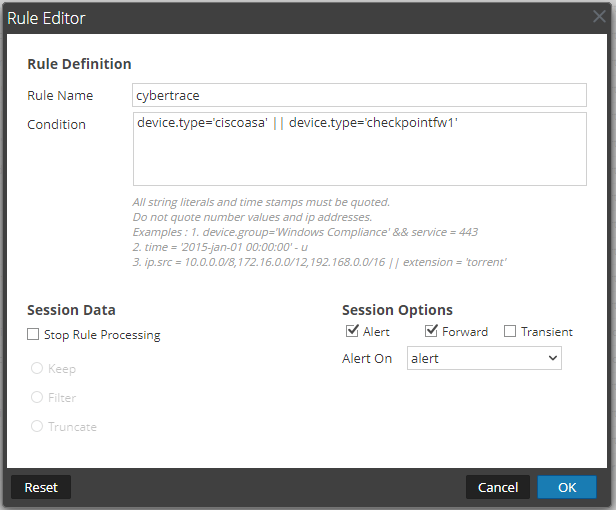
Rule Editor window
For information on how to create rules, refer to https://community.rsa.com/t5/rsa-netwitness-platform-online/configure-application-rules/ta-p/592148.
- Rule Name:
- Click OK.
- Click Apply.
- Next to the Log Decoder name, select Config > Explore.
- Specify the destination:
- For RSA NetWitness versions 11.2 and above:
For the /decoder/config/logs.forwarding.destination parameter, specify the following destination:
cybertrace=tcp:[IP]:[port]:rfc3164Here,
[IP]is the IP address of the computer on which Feed Service is installed, and[port]is the port that Feed Service listens on for events (by default, the port9999is used). The IP address and port are the same as specified on the Settings > Service tab of Kaspersky CyberTrace Web. - For RSA NetWitness versions below 11.2:
- For the /decoder/config/logs.forwarding.destination parameter, specify the following destination:
cybertrace=tcp:[IP]:[port]Here,
[IP]is the IP address of the computer on which Feed Service is installed, and[port]is the port that Feed Service listens on for events (by default, the port9999is used). The IP address and port are the same as specified on the Settings > Service tab of Kaspersky CyberTrace Web. - In the EventDelimeter parameter, in the Feed Service configuration file, specify the
(\<\d+\>)value.
- For the /decoder/config/logs.forwarding.destination parameter, specify the following destination:
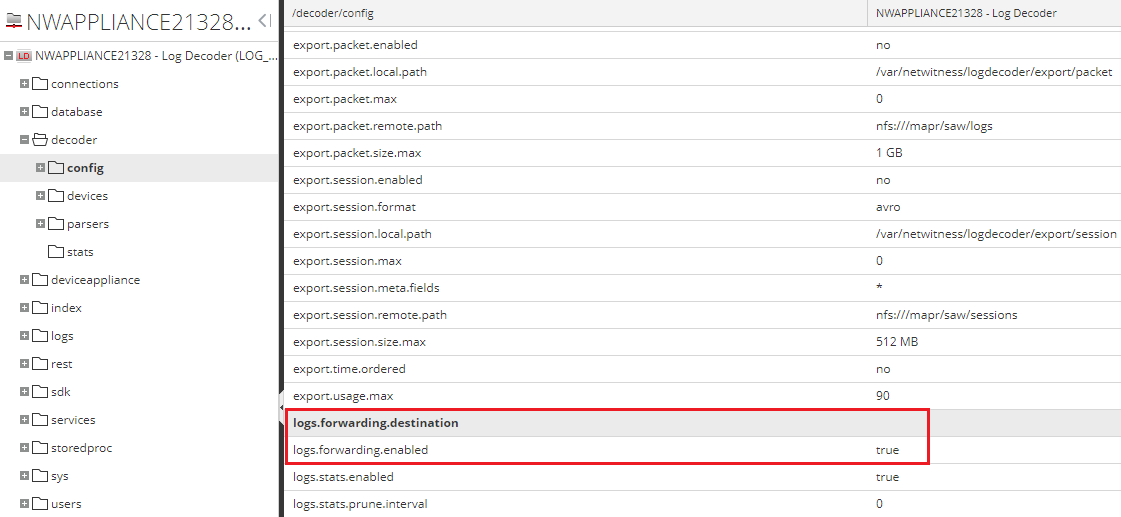
Log events forwarding settings
- For RSA NetWitness versions 11.2 and above:
- In the /decoder/config/logs.forwarding.enabled parameter, specify
true.
After these actions are performed, RSA NetWitness will forward the events that satisfy the cybertrace rule to the address that you specified in the logs.forwarding.destination parameter.
For more information on event forwarding, refer to https://community.rsa.com/t5/rsa-netwitness-platform-online/decoder-configure-syslog-forwarding-to-destination/ta-p/572084.
Page topStep 2. Sending events from Feed Service to RSA NetWitness
This section describes the actions to take so that Feed Service will send events to RSA NetWitness.
Note that Feed Service sends events to a Log Decoder service.
To send events from Feed Service to RSA NetWitness:
- In Kaspersky CyberTrace Web, on the Settings > Service tab, specify the following value for the Service sends events to text box:
[IP]:514Here
[IP]is the IP address of the Log Decoder service to which Feed Service will send events.If there are several Log Decoder services, perform the integration with only one of the Log Decoders.
- In
/etc/netwitness/ng/envision/etc/devicesdirectory of the computer on which Log Decoder runs, create acybertracesubdirectory and copy to the subdirectory the following files from the%service_dir%/integration/rsa/cybertracedirectory:- cybertrace.ini
This is a configuration file that contains declaration of Feed Service for RSA NetWitness.
- v20_cybertracemsg.xml
This is a configuration file that contains parsing rules for events that are sent from Feed Service to RSA NetWitness. See below in this section for a description of the contents.
You can find these files in the
integration/cybertracedirectory of the distribution kit. - cybertrace.ini
- Restart Log Decoder.
For this purpose, in the Services view, for the selected Log Decoder click the Settings split button (
) and from the drop-down list select Restart. - Make sure that the
cybertraceservice parser is turned on in RSA NetWitness.You can do this as follows:
- In the RSA NetWitness menu, select Administration > Services.
- In the Services grid, select the Log Decoder, and from the Actions menu, choose View > Config.
- In the Service Parsers Configuration panel, search for cybertrace, and ensure that the Config Value field in this row is selected.
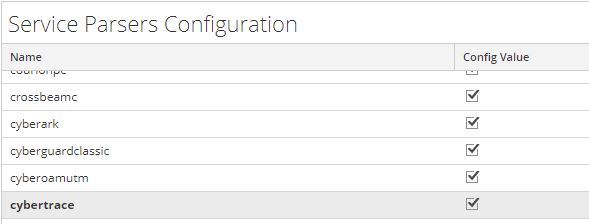
Service Parsers Configuration grid
- Restart Feed Service.
You can restart Feed Service by running the kl_feed_service script as follows:
systemctl restart cybertrace.serviceYou can do this by using Kaspersky CyberTrace Web too.
Contents of integration files
The v20_cybertracemsg.xml file contains the following rule for parsing service events from Feed Service:
alert=<action>,context=<msg> |
The v20_cybertracemsg.xml file contains several rules for parsing detection events from Feed Service:
- MATCH_EVENT:01—For parsing detection events when Botnet CnC URL Data Feed is involved in the detection process.
- MATCH_EVENT:02—For parsing detection events when Malicious URL Data Feed is involved in the detection process.
- MATCH_EVENT:03—For parsing detection events when Mobile Botnet CnC URL Data Feed is involved in the detection process.
- MATCH_EVENT:04—For parsing detection events when Malicious Hash Data Feed is involved in the detection process.
- MATCH_EVENT:05—For parsing detection events when Phishing URL Data Feed is involved in the detection process.
- MATCH_EVENT:06—For parsing detection events when Ransomware URL Data Feed or IoT URL Data Feed are involved in the detection process.
- MATCH_EVENT:07—For parsing detection events when IP Reputation Data Feed is involved in the detection process.
- MATCH_EVENT:08—For parsing detection events when Vulnerability Data Feed is involved in the detection process.
- MATCH_EVENT:09—For parsing detection events when Mobile Malicious Hash Data Feed is involved in the detection process.
- MATCH_EVENT:10—For parsing detection events when APT IP and URL feeds are involved in the detection process.
- MATCH_EVENT:11—For parsing detection events when Industrial Control Systems Data Feed is involved in the detection process.
- MATCH_EVENT:12—For parsing detection events when APT Hash feeds are involved in the detection process.
- MATCH_EVENT—For parsing detection events when other feeds are involved in the detection process.
The fields of the cybertrace.ini file and the v20_cybertracemsg.xml file correspond to the following format of service events and detection events from Feed Service:
<AlertFormat><![CDATA[<232>%CyberTrace:ALERT_EVENT alert=%Alert%,context=%RecordContext%]]></AlertFormat> <EventFormat><![CDATA[<232>%CyberTrace:MATCH_EVENT category=%Category%,detected=%MatchedIndicator%,url=%RE_URL%,hash=%RE_HASH%,dst=%DST_IP%,src=%SRC_IP%,dvc=%DeviceIp%,dev_name=%Device%,dev_action=%DeviceAction%,user=%UserName%,cnf=%Confidence%,actF:%ActionableFields%,context=%RecordContext%]]> </EventFormat> |
In the v20_cybertracemsg.xml file, the format of events from Feed Service is provided in the HEADER/content element and in the MESSAGE/content element. Make sure that the following fields are present in the index files of Log Decoder and Concentrator: virusname, url, checksum, and ip.src, ip.dst. As for the fields other than virusname, url, checksum, and ip.src, ip.dst in the MESSAGE/content element, you may or may not use them in the index files of Log Decoder and Concentrator. Also, make sure that the value of the flags attribute is None for each of these fields in the table-map-custom.xml file. If any of these conditions are not met, refer to the section about RSA NetWitness troubleshooting.
The following tables describe the fields used in the v20_cybertracemsg.xml and kl_feed_service.conf files, and describe how fields in one file correspond to fields in the other. If you want to constantly use some new field in detection events, contant your technical account manager (TAM).
- Fields of service events
Field in kl_feed_service.conf
Field in v20_cybertracemsg.xml
Description
<232>
-
Service string for RSA NetWitness.
%CyberTrace:
%CyberTrace:
Informs RSA NetWitness that an event is sent from Feed Service.
ALERT_EVENT
<messageid>
The event type.
-
<!payload>
Notifies RSA NetWitness that the event has additional information, the format of which is provided in the
MESSAGE/contentelement.%Alert%
<action>
The service event (for example, KL_ALERT_ServiceStarted).
%RecordContext%
<msg>
Context information about the service event.
- Fields of detection events
Field in kl_feed_service.conf
Field in v20_cybertracemsg.xml
Description
<232>
-
Service string for RSA NetWitness.
%CyberTrace:
%CyberTrace:
Informs RSA NetWitness that an event is sent from Feed Service.
MATCH_EVENT
<messageid>
The event type.
-
<!payload>
Notifies RSA NetWitness that the event has additional information, the format of which is provided in the
MESSAGE/contentelement.%Category%
<virusname>
Category of the detected object.
%MatchedIndicator%
<kl_detected_indicator%gt;
The detected indicator.
%RE_URL%
<url>
The URL specified in the event from RSA NetWitness.
%RE_HASH%
<checksum>
The hash specified in the event from RSA NetWitness.
%DST_IP%
<daddr>
The IP address to which the request is sent.
%SRC_IP%
<saddr>
The IP address from which the request is sent.
%DeviceIp%
<hostip>
The IP address from which the event is sent.
%Device%
<event_source>
The name of the device that has sent the event.
%DeviceAction%
<action>
The action that the device has performed.
%UserName%
<c_username>
The name of the user on whose account the action described in the event is performed.
%ActionableFields%
The fields' names are discussed below in this section.
Fields of the feed record involved in the detection process that are displayed apart from the context.
%RecordContext%
<fld1>
Context of the feed record that was involved in the detection process.
To view the contents of this field, open the event in RSA NetWitness and select the View Log tab.
%Confidence%
<kl_confidence>
The level of confidence in the indicators of the feed, in percent.
The following tables describe the actionable fields used in the feeds and in the v20_cybertracemsg.xml file, and describe how fields in a feed correspond to fields in the file:
- Botnet CnC URL Data Feed and Demo Botnet CnC URL Data Feed
Field in the feed
Field in v20_cybertracemsg.xml
mask
kl_mask
first_seen
kl_first_seen
last_seen
kl_last_seen
popularity
kl_popularity
threat
kl_threat
- Malicious Hash Data Feed and Demo Malicious Hash Data Feed
Field in the feed
Field in v20_cybertracemsg.xml
MD5
kl_md5
SHA1
kl_sha1
SHA256
kl_sha256
first_seen
kl_first_seen
last_seen
kl_last_seen
popularity
kl_popularity
file_type
kl_file_type
file_size
kl_file_size
threat
kl_threat
- IP Reputation Data Feed and Demo IP Reputation Data Feed
Field in the feed
Field in v20_cybertracemsg.xml
ip
kl_ip
first_seen
kl_first_seen
last_seen
kl_last_seen
popularity
kl_popularity
threat_score
kl_threat_score
category
kl_category
threat
kl_threat
- Malicious URL Data Feed
Field in the feed
Field in v20_cybertracemsg.xml
mask
kl_mask
first_seen
kl_first_seen
last_seen
kl_last_seen
popularity
kl_popularity
files/threat
kl_threat
category
kl_category
- Mobile Malicious Hash Data Feed
Field in the feed
Field in v20_cybertracemsg.xml
MD5
kl_md5
SHA1
kl_sha1
SHA256
kl_sha256
first_seen
kl_first_seen
last_seen
kl_last_seen
popularity
kl_popularity
threat
kl_threat
file_size
kl_file_size
- Phishing URL Data Feed
Field in the feed
Field in v20_cybertracemsg.xml
mask
kl_mask
first_seen
kl_first_seen
last_seen
kl_last_seen
popularity
kl_popularity
industry
kl_industry
- Vulnerability Data Feed
Field in the feed
Field in v20_cybertracemsg.xml
Date
kl_first_seen
AV Verdict
kl_verdict
When Vulnerability Data Feed is involved in a detection process, the
AV Verdictfield contains one of the following values:warninghighcritical
- Mobile Botnet CnC URL Data Feed
Field in the feed
Field in v20_cybertracemsg.xml
threat
kl_threat
- Ransomware URL Data Feed or IoT URL Data Feed
Field in the feed
Field in v20_cybertracemsg.xml
mask
kl_mask
first_seen
kl_first_seen
last_seen
kl_last_seen
popularity
kl_popularity
- APT IP and URL feeds
Field in the feed
Field in v20_cybertracemsg.xml
detection_date
kl_detect_date
publication_name
kl_pub_name
- APT Hash feeds
Field in the feed
Field in v20_cybertracemsg.xml
detection_date
kl_detect_date
publication_name
kl_pub_name
SHA1
kl_sha1
SHA256
kl_sha256
- Industrial Control Systems Data Feed
Field in the feed
Field in v20_cybertracemsg.xml
first_seen
kl_first_seen
popularity
kl_popularity
Step 3 (optional). Importing a meta group for browsing fields filled by Feed Service
This section describes how you can import the MetaGroups.jsn file. This file contains a meta group that you can use to browse only those fields in RSA NetWitness that are filled by Feed Service.
The Kaspersky CyberTrace distribution kit contains the integration/rsa/additional_elements/MetaGroups.jsn file. This file contains fields named kl.%field_name%. If you have not added the CyberTrace fields to RSA NetWitness (namely, to the table-map-custom.xml and index-concentrator-custom.xml files), we recommend that you import the MetaGroups_without_kl_fields.jsn file instead of MetaGroups.jsn.
To import the MetaGroups.jsn file:
- On the RSA NetWitness menu, select Investigation > Navigate.
- Select Meta > Manage Meta Groups.
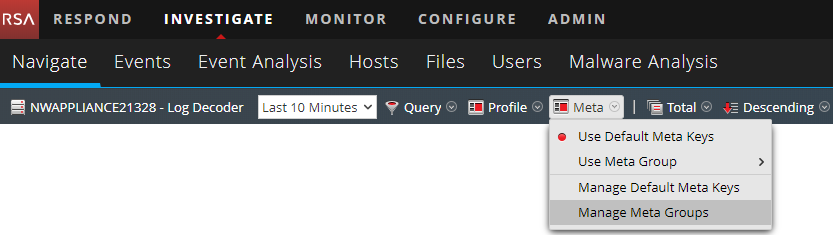
Manage Meta Groups command
- In the Manage Meta Groups window, click the Import button (
 ).
).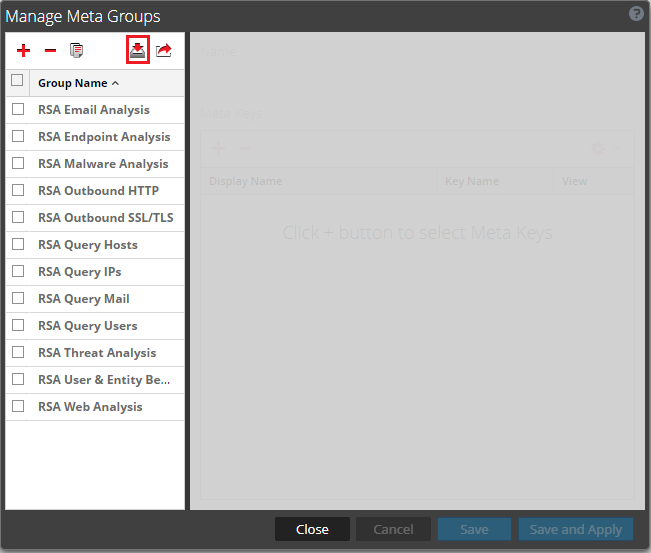
Manage Meta Groups window
- Select the MetaGroups.jsn file and click the Upload button (
 ).
). - Select the
CyberTrace_META_GROUPmeta group and click Save and Apply.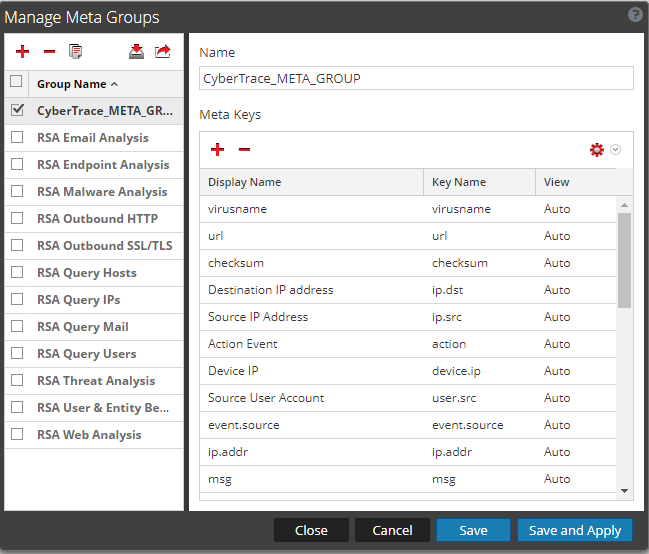
Adding a meta group
Step 4 (optional). Importing Feed Service rules to RSA NetWitness
The Kaspersky CyberTrace distribution kit contains the CyberTrace_Rules.zip file in the integration/rsa/additional_elements directory. This file contains a set of rules, which you can use to create reports, alerts, and dashboards.
To import the Feed Service rules to RSA NetWitness:
- On the RSA NetWitness menu, select Dashboard > Reports.
In RSA NetWitness 11, you select Monitor > Reports instead.
- Click the Settings split button () and select Import.
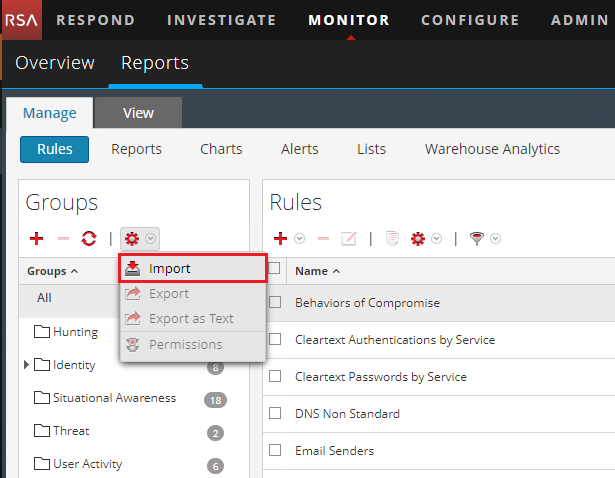
Importing rules
- Choose the CyberTrace_Rules.zip file.
- In the Import Rule window, select the Rule check box and the List check box.
If you import the CyberTrace_Rules.zip file for the first time, you may leave these check boxes cleared.
- Click the Import button.
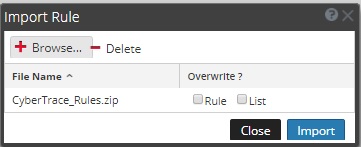
Importing Feed Service rules
The rules imported to RSA NetWitness are listed in the table below.
Rule |
Description |
CyberTrace Detect Botnet |
Selects those detection events from Feed Service that have the Botnet category. The following fields are selected:
|
CyberTrace Detect Malware Hash |
Selects hash detection events from Feed Service. The following fields are selected:
|
CyberTrace Detect Malware IP |
Selects IP address detection events from Feed Service. The following fields are selected:
|
CyberTrace Detect Malware URL |
Selects URL detection events from Feed Service. The following fields are selected:
|
CyberTrace Detect Stat |
Selects all the categories involved in the detection process. The following fields are selected:
|
CyberTrace Service events |
Selects service events from Feed Service. The following fields are selected:
|
CyberTrace Top 10 IP |
Selects Top 10 detected IP addresses. The following fields are selected:
|
CyberTrace Top 10 URL |
Selects Top 10 detected URLs. The following fields are selected:
|
CyberTrace Top 10 Hash |
Selects Top 10 detected hashes. The following fields are selected:
|
CyberTrace Detected users |
Calculates the number of detection events per user. |
Step 5 (optional). Importing a preconfigured report to RSA NetWitness
This section explains how to import a preconfigured report to RSA NetWitness. To learn how to create a report manually, see the section about creating and viewing reports in RSA NetWitness.
This step requires the importing Feed Service rules step to be completed.
The distribution kit contains the CyberTrace_Reports.zip file. This file contains a preconfigured report, CyberTrace Report.
The CyberTrace Report report contains the following data:
- Detection statistics during the last 24 hours
- Statistics on users who issued detection events during the last 24 hours
- Top 10 URLs, Top 10 IP addresses, and Top 10 Hashes during the last 24 hours
You can import this file in the same way that you import the CyberTrace_Rules.zip file (which contains rules). After the report is imported, you must specify the data source.
To specify the data source for the "CyberTrace Report" report:
- On the RSA NetWitness menu, select Dashboard > Reports. (In RSA NetWitness 11, select Monitor > Reports.)
The Manage tab is displayed.
- Click Reports.
The Reports view is displayed.
- In the Reports view, in the Actions column, click the Settings split button () for the
CyberTrace Reportreport, and then select Schedule Report.The Schedule Report form appears.
- In the Schedule Report form, specify the following data:
- Schedule name
- Data source (database from the NetWitness DB drop-down list)
Select either the Concentrator that receives events from Feed Service or the Log Decoder that stores events from Feed Service.
- Click the Schedule button.
Step 6 (optional). Importing preconfigured charts and a dashboard to RSA NetWitness
This section describes how you can import preconfigured charts and a dashboard to RSA NetWitness.
This step requires importing Feed Service rules step to be completed.
Importing preconfigured charts
The distribution kit contains the CyberTrace_Charts.zip file. The CyberTrace_Charts.zip file contains preconfigured charts. These charts are used in a preconfigured dashboard.
You can import the CyberTrace_Charts.zip file in the same way as CyberTrace_Rules.zip, which contains rules.
After the CyberTrace_Charts.zip file is imported, specify the data source for each chart (specify either the Concentrator that receives events from Feed Service or the Log Decoder that stores events from Feed Service). To do this, for each chart click the Actions split button () and select Edit. Then in the Data Source field specify the data source and click Save.
Also, enable each chart: select the check boxes next to the chart names (or you can select the check box next to the Enabled column heading) and then click the Enable button ( ).
).
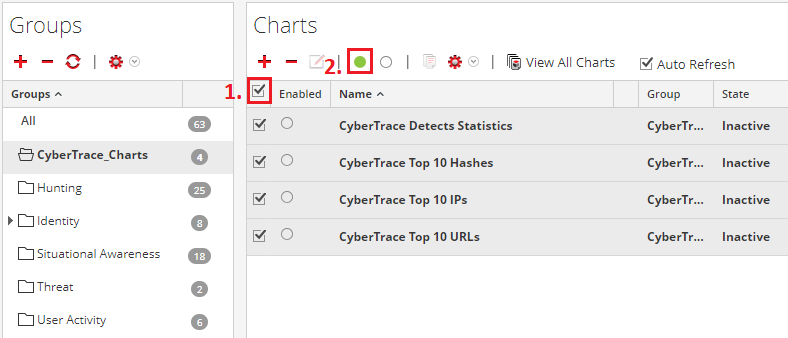
Enabling charts
Importing the Kaspersky CyberTrace dashboard
The distribution kit also contains the Kaspersky+CyberTrace.cfg file. This file contains a preconfigured dashboard, Kaspersky CyberTrace.
You can import the Kaspersky+CyberTrace.cfg file by clicking the Settings split button () in the Dashboard form and selecting Import. A dashlet form appears in the Dashboard form. After the CFG file is imported, configure the following dashlets: CyberTrace Detects Statistic, CyberTrace Top 10 URL, CyberTrace Top 10 Hash, and CyberTrace Top 10 IP.
The import instructions above are relevant for RSA NetWitness version 10.6. To import the Kaspersky CyberTrace.zip file in RSA NetWitness version 11.0, click the Import dashboard button ( ).
).
Step 7. Performing the verification test (RSA NetWitness)
After you configure Kaspersky CyberTrace and RSA NetWitness, you can test their performance.
Please make sure you perform the verification test before editing any filtering rules in the Feed Utility configuration file.
To check whether Kaspersky CyberTrace is correctly integrated with RSA NetWitness:
- Configure Log Scanner to send events to the IP address and port that Feed Service listens on.
For this purpose, in the
Connectionelement of the Log Scanner configuration file, specify the IP address and port that are set for outbound events on the Settings > Service tab of Kaspersky CyberTrace Web. - Send the
kl_verification_test_cef.txtfile from the verification directory to Feed Service by using Log Scanner.For this purpose, run the following command:
In Linux:
./log_scanner -p ../verification/kl_verification_test_cef.txtIn Windows:
log_scanner.exe -p ..\verification\kl_verification_test_cef.txtDo not specify the
-rflag in this command: send the test results to the SIEM solution by using the parameters for outbound events specified on the Settings > Service tab of Kaspersky CyberTrace. - Make sure that you obtain the test results according to the table below.
You can view the test results in the same way as when browsing Feed Service events in RSA NetWitness.
Verification test results
The verification test results depends on the feeds you use. The verification test results are listed in the following table.
Verification test results
Feed used |
Detected objects |
Malicious URL Data Feed |
http://fakess123.nu http://badb86360457963b90faac9ae17578ed.com |
Phishing URL Data Feed |
http://fakess123ap.nu http://e77716a952f640b42e4371759a661663.com |
Botnet CnC URL Data Feed |
http://fakess123bn.nu http://a7396d61caffe18a4cffbb3b428c9b60.com |
IP Reputation Data Feed |
192.0.2.0 192.0.2.3 |
Malicious Hash Data Feed |
FEAF2058298C1E174C2B79AFFC7CF4DF 44D88612FEA8A8F36DE82E1278ABB02F (stands for EICAR Standard Anti-Virus Test File) C912705B4BBB14EC7E78FA8B370532C9 |
Mobile Malicious Hash Data Feed |
60300A92E1D0A55C7FDD360EE40A9DC1 |
Mobile Botnet CnC URL Data Feed |
001F6251169E6916C455495050A3FB8D (MD5 hash) sdfed7233dsfg93acvbhl.su/steallallsms.php (URL mask) |
Ransomware URL Data Feed |
http://fakess123r.nu http://fa7830b4811fbef1b187913665e6733c.com |
Vulnerability Data Feed |
D8C1F5B4AD32296649FF46027177C594 |
APT URL Data Feed |
http://b046f5b25458638f6705d53539c79f62.com |
APT Hash Data Feed |
7A2E65A0F70EE0615EC0CA34240CF082 |
APT IP Data Feed |
192.0.2.4 |
IoT URL Data Feed |
http://e593461621ee0f9134c632d00bf108fd.com/.i |
Demo Botnet CnC URL Data Feed |
http://5a015004f9fc05290d87e86d69c4b237.com http://fakess123bn.nu |
Demo IP Reputation Data Feed |
192.0.2.1 192.0.2.3 |
Demo Malicious Hash Data Feed |
776735A8CA96DB15B422879DA599F474 FEAF2058298C1E174C2B79AFFC7CF4DF 44D88612FEA8A8F36DE82E1278ABB02F |
ICS Hash Data Feed |
7A8F30B40C6564EFF95E678F7C43346C |
Integration with LogRhythm
This chapter describes how to integrate Kaspersky CyberTrace with LogRhythm.
The actions described in these sections must be performed in LogRhythm Console under a user account that has administrator privileges.
To integrate LogRhythm with Kaspersky CyberTrace:
- Add the Kaspersky CyberTrace log source type to LogRhythm.
- Import files with Kaspersky CyberTrace rules.
- Optionally, add Kaspersky CyberTrace events to LogRhythm.
- Optionally, add Kaspersky CyberTrace rules to LogRhythm.
- Add a Kaspersky CyberTrace policy to LogRhythm.
- Accept the Kaspersky CyberTrace log source in LogRhythm.
- Configure LogRhythm to forward logs to Kaspersky CyberTrace.
- Optionally, perform the verification test.
- Optionally, create alerts about incoming Kaspersky CyberTrace service events.
- Optionally, configure LogRhythm to display alert events.
Step 1. Adding a Custom Log Source type
This section describes how you can add the Kaspersky CyberTrace log source type to LogRhythm.
To add the Kaspersky CyberTrace log source type to LogRhythm:
- Run LogRhythm Console.
- Select Deployment Manager > Tools > Knowledge > Log Source Type Manager.
The Log Source Type Manager window opens.
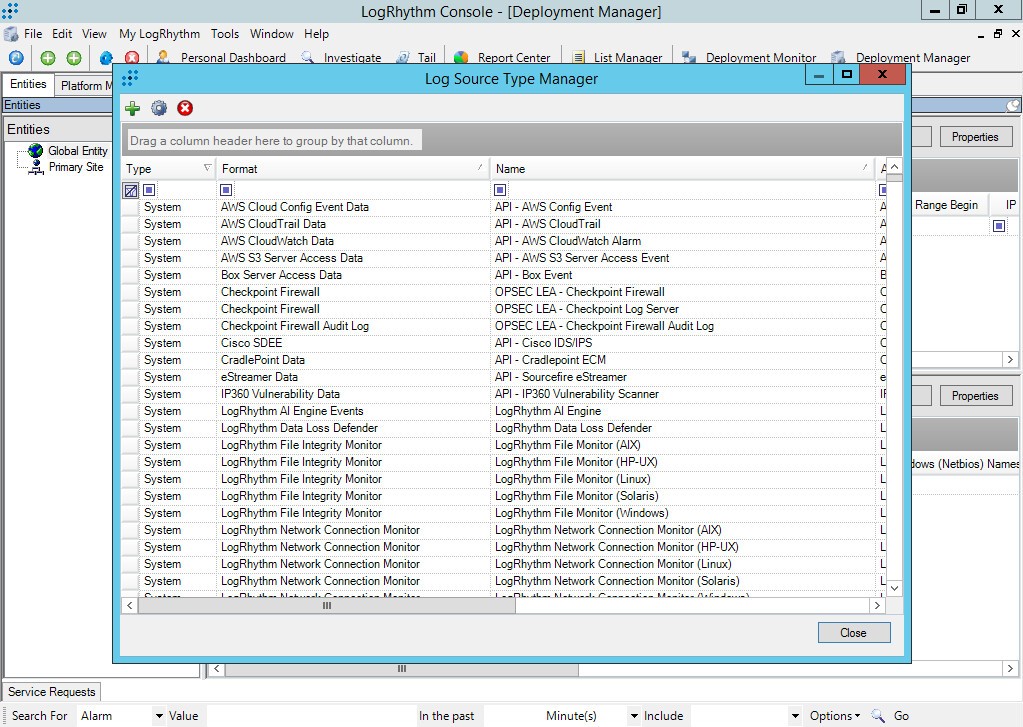
Log Source Type Manager window
- Click the New button (
 ).
). - In the Log Source Type Properties window that opens, enter the following data:
Field
Data
Name
Kaspersky CyberTrace
Full Name
Kaspersky CyberTrace
Abbreviation
CyberTrace
Log Format
Syslog
Brief Description
Kaspersky CyberTrace is an application set that allows you to check URLs, IP addresses, and hashes of files contained in events that arrive in a SIEM software product.
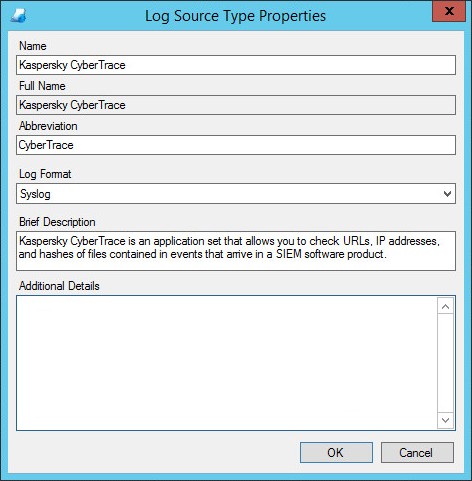
Log Source Type Properties window
We recommend specifying a source name as well as in the Name field from the table above. Otherwise, importing Kaspersky CyberTrace rules and events will be performed incorrectly. In this case, you must add Kaspersky CyberTrace events and corresponding MPE rules manually, as described in step 3 and step 4 (make sure to specify the log source name similar to the name that you entered in the Log Source Type Properties window).
- Click OK.
The new log source type will appear in the Log Source Type Manager window.
- Make a note of the value in the Log Source Type ID column. You will need it further in step 2 for importing Kaspersky CyberTrace rules and events.
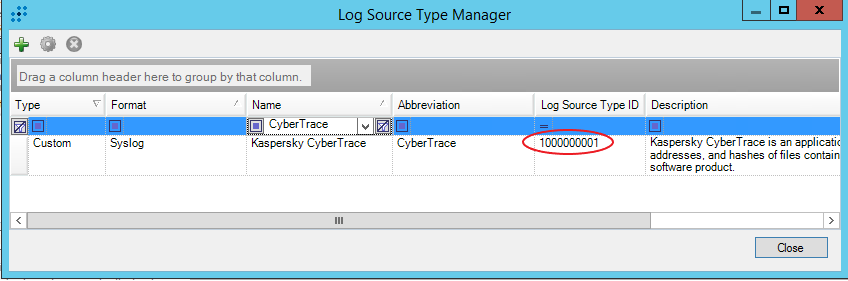
Kaspersky CyberTrace log source type
Step 2. Importing Kaspersky CyberTrace rules and events
This section describes how you can import files that contain Kaspersky CyberTrace rules and events to LogRhythm.
If for any reason the import fails, you can configure adding Kaspersky CyberTrace events and Kaspersky CyberTrace rules manually.
To import files with Kaspersky CyberTrace rules to LogRhythm:
- For each file of the
mperule_%event_name%.xmlformat from theintegration/logrhythm/events/directory, perform the following actions:- Open the file in a text editor.
- Replace the values of both the
MPERuleToMST > MsgSourceTypeIDand theMsgSourceType > MsgSourceTypeIDelements with the log source type ID, you have made a note of in the previous step.For example,
<MsgSourceTypeID>1000000001</MsgSourceTypeID>must change to<MsgSourceTypeID>%CYBERTRACE_ID%</MsgSourceTypeID>, where%CYBERTRACE_ID%stands for the log source type ID of Kaspersky CyberTrace. - Save the file.
- Open LogRhythm Console.
- Select Deployment Manager > Tools > Knowledge > MPE Rule Builder.
The Rule Builder form opens.
- For each file edited in step 1 above, perform the following actions:
- Select File > Import.
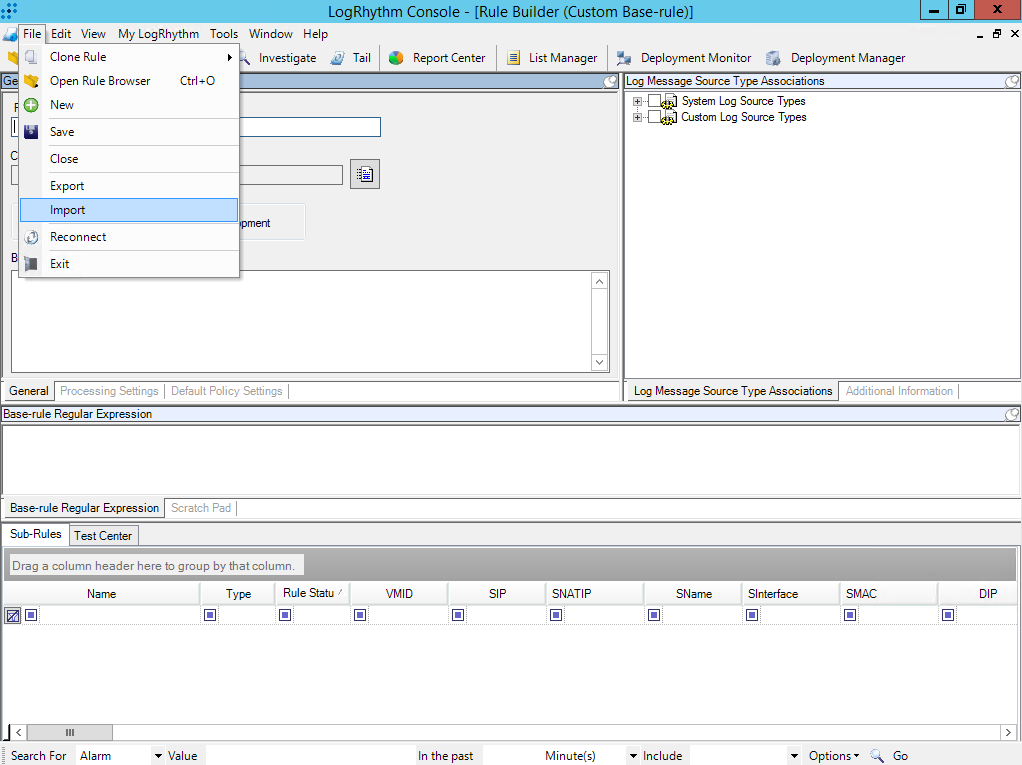
- In the Import Actions window, click Yes.
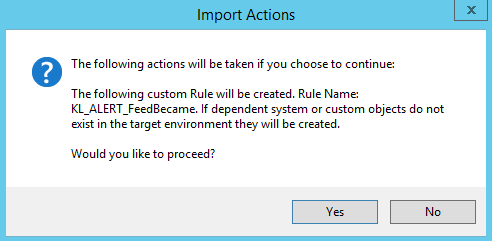
If the import succeeds, the Rule Import Status window opens.
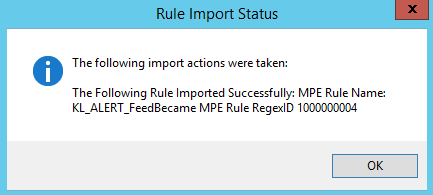
- On the toolbar of the Rule Builder form, click the Open rule library (
 ) button.
The Rule Browser window opens.
- Double-click the event that was imported in step b.
A window with rule settings opens.
Note that the imported rule arrives in LogRhythm in the
Developmentstatus and may not appear in the list of all rules. You can configure display in the Rule Browser window that opens by selecting View > Show Development rules.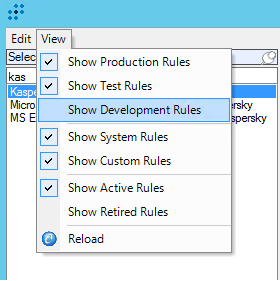
- In the General settings window that opens, in the Rule Status section, select Production or Test.
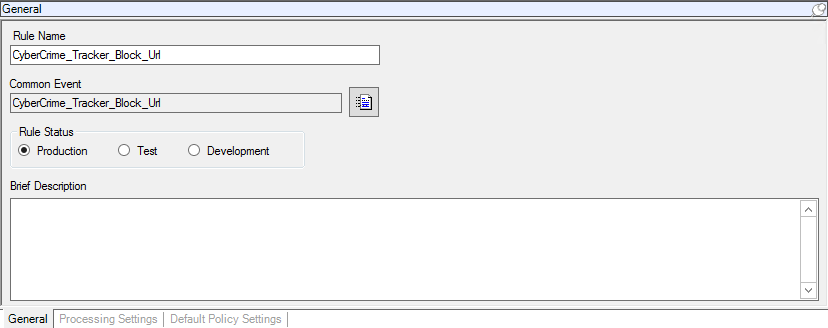
- Click Save.
The corresponding common events and MPE Rules will be added to LogRhythm for all events. The full list of the events is described in the section about adding Kaspersky CyberTrace events. The full list of MPE rules and their settings is described in the section about adding Kaspersky CyberTrace rules.
- Select File > Import.
Some of the imported Kaspersky CyberTrace events might have a low Risk Rating according to the LogRhythm classification. Depending on the filters configuration, LogRhythm might ignore such events. Please check the classification and make sure that the Risk Rating of imported events allows LogRhythm to accept and process them correctly.
Page topStep 3 (optional). Adding Kaspersky CyberTrace events
This section describes how you can add Kaspersky CyberTrace events to LogRhythm manually.
Skip this step, if the importing of Kaspersky CyberTrace rules and events succeeds.
To add Kaspersky CyberTrace events to LogRhythm:
- Run LogRhythm Console.
- Select Deployment Manager > Tools > Knowledge > Common Event Manager.
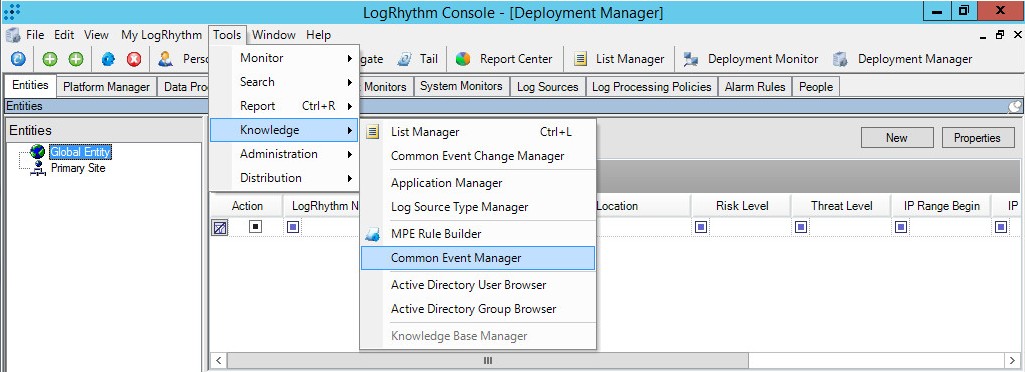
Common Event Manager menu item
The Common Event Manager window opens.
- Add the events provided in the tables below. If you do not use all commercial and OSINT feeds, some of the events might not be necessary.
- Events of the
"Security : Compromise"classification
Event
Description
KL_APT_Hash_MD5
Hash of a malicious file used in an APT campaign is detected by Kaspersky CyberTrace.
KL_APT_Hash_SHA1
Hash of a malicious file used in an APT campaign is detected by Kaspersky CyberTrace.
KL_APT_Hash_SHA256
Hash of a malicious file used in an APT campaign is detected by Kaspersky CyberTrace.
KL_APT_IP
IP address used in an APT campaign is detected by Kaspersky CyberTrace.
KL_APT_URL
URL used in an APT campaign is detected by Kaspersky CyberTrace.
KL_BotnetCnC_Hash_MD5
Botnet hash is detected by Kaspersky CyberTrace.
KL_BotnetCnC_Hash_SHA1
Botnet hash is detected by Kaspersky CyberTrace.
KL_BotnetCnC_Hash_SHA256
Botnet hash is detected by Kaspersky CyberTrace.
KL_BotnetCnC_URL
Botnet C&C URL is detected by Kaspersky CyberTrace.
KL_Exploit_Hash_MD5
Hash of exploit is detected by Kaspersky CyberTrace.
KL_Exploit_Hash_SHA1
Hash of exploit is detected by Kaspersky CyberTrace.
KL_Exploit_Hash_SHA256
Hash of exploit is detected by Kaspersky CyberTrace.
KL_ICS_Hash_MD5
ICS hash is detected by Kaspersky CyberTrace.
KL_ICS_Hash_SHA1
ICS hash is detected by Kaspersky CyberTrace.
KL_ICS_Hash_SHA256
ICS hash is detected by Kaspersky CyberTrace.
KL_InternalTI_URL
URL of the InternalTI list of Kaspersky CyberTrace.
KL_InternalTI_IP
IP of the InternalTI list of Kaspersky CyberTrace.
KL_InternalTI_Hash_MD5
Hash of the InternalTI list of Kaspersky CyberTrace.
KL_InternalTI_Hash_SHA1
Hash of the InternalTI list of Kaspersky CyberTrace.
KL_InternalTI_Hash_SHA256
Hash of the InternalTI list of Kaspersky CyberTrace.
KL_IoT_Hash_MD5
Hash of IoT is detected by Kaspersky CyberTrace.
KL_IoT_Hash_SHA1
Hash of IoT is detected by Kaspersky CyberTrace.
KL_IoT_Hash_SHA256
Hash of IoT is detected by Kaspersky CyberTrace.
KL_IoT_URL
URL that infects Internet of Things-enabled (IoT) devices is detected by Kaspersky CyberTrace.
KL_IP_Reputation
Malicious or suspicious IP address is detected by Kaspersky CyberTrace.
KL_IP_Reputation_Hash_MD5
Hash of a file hosted on a malicious or suspicious IP address is detected by Kaspersky CyberTrace.
KL_IP_Reputation_Hash_SHA1
Hash of a file hosted on a malicious or suspicious IP address is detected by Kaspersky CyberTrace.
KL_IP_Reputation_Hash_SHA256
Hash of a file hosted on a malicious or suspicious IP address is detected by Kaspersky CyberTrace.
KL_Malicious_URL
Malicious URL is detected by Kaspersky CyberTrace.
KL_Malicious_URL_Hash_MD5
Hash of a file hosted on a malicious URL is detected by Kaspersky CyberTrace.
KL_Malicious_URL_Hash_SHA1
Hash of a file hosted on a malicious URL is detected by Kaspersky CyberTrace.
KL_Malicious_URL_Hash_SHA256
Hash of a file hosted on a malicious URL is detected by Kaspersky CyberTrace.
KL_Malicious_Hash_MD5
Malicious hash is detected by Kaspersky CyberTrace.
KL_Malicious_Hash_SHA1
Malicious hash is detected by Kaspersky CyberTrace.
KL_Malicious_Hash_SHA256
Malicious hash is detected by Kaspersky CyberTrace.
KL_Mobile_Malicious_Hash_MD5
Mobile malicious hash is detected by Kaspersky CyberTrace.
KL_Mobile_Malicious_Hash_SHA1
Mobile malicious hash is detected by Kaspersky CyberTrace.
KL_Mobile_Malicious_Hash_SHA256
Mobile malicious hash is detected by Kaspersky CyberTrace.
KL_Mobile_BotnetCnC_Hash_MD5
Mobile botnet C&C hash is detected by Kaspersky CyberTrace.
KL_Mobile_BotnetCnC_Hash_SHA1
Mobile botnet C&C hash is detected by Kaspersky CyberTrace.
KL_Mobile_BotnetCnC_Hash_SHA256
Mobile botnet C&C hash is detected by Kaspersky CyberTrace.
KL_Mobile_BotnetCnC_URL
Mobile botnet C&C URL is detected by Kaspersky CyberTrace.
KL_Phishing_URL
Phishing URL is detected by Kaspersky CyberTrace.
KL_Ransomware_URL
URL that hosts ransomware is detected by Kaspersky CyberTrace.
KL_Ransomware_URL_Hash_MD5
Hash of ransomware is detected by Kaspersky CyberTrace.
KL_Ransomware_URL_Hash_SHA1
Hash of ransomware is detected by Kaspersky CyberTrace.
KL_Ransomware_URL_Hash_SHA256
Hash of ransomware is detected by Kaspersky CyberTrace.
KL_Vulnerable_File_Hash_MD5
Hash of vulnerable software and related exploits is detected by Kaspersky CyberTrace.
KL_Vulnerable_File_Hash_SHA1
Hash of vulnerable software and related exploits is detected by Kaspersky CyberTrace.
KL_Vulnerable_File_Hash_SHA256
Hash of vulnerable software and related exploits is detected by Kaspersky CyberTrace.
AbuseCh_Feodo_Block_IP
IP address from the Abuse.Ch_Feodo_Block_IP feed is detected by Kaspersky CyberTrace.
AbuseCh_Ransomware_Block_URL
URL from the Abuse.Ch_Ransomware_Block_URL feed is detected by Kaspersky CyberTrace.
AbuseCh_Ransomware_Block_Domain
Domain from the Abuse.Ch_Ransomware_Block_Domain feed is detected by Kaspersky CyberTrace.
AbuseCh_Ransomware_Block_IP
IP address from the Abuse.Ch_Ransomware_Block_IP feed is detected by Kaspersky CyberTrace.
AbuseCh_Ransomware_Common_URL
URL from the Abuse.Ch_Ransomware_Common_URL feed is detected by Kaspersky CyberTrace.
AbuseCh_SSL_Certificate_Block_IP
IP address from the AbuseCh_SSL_Certificate_Block_IP feed is detected by Kaspersky CyberTrace.
AbuseCh_SSL_Certificate_Hash_SHA1
Hash from the AbuseCh_SSL_Certificate_Hash_SHA1 feed is detected by Kaspersky CyberTrace.
BlocklistDe_Block_IP
IP from the BlocklistDe_Block_IP feed is detected by Kaspersky CyberTrace.
CyberCrime_Tracker_Block_Url
URL from the CyberCrime_Tracker_Block_Url feed is detected by Kaspersky CyberTrace.
EmergingThreats_Block_IP
IP address from the EmergingThreats_Block_IP feed is detected by Kaspersky CyberTrace.
EmergingThreats_Compromised_IP
IP address from the EmergingThreats_Compromised_IP feed is detected by Kaspersky CyberTrace.
- Alert events:
Event
Description
Classification
KL_ALERT_ConfigurationUpdated
This event is generated if Feed Service has reloaded the configuration file.
Audit : Configuration
KL_ALERT_FeedBecameAvailable
This event is generated if a feed that can be used with the current certificate has become available.
Audit : Other Audit Success
KL_ALERT_FeedBecameUnavailable
This event is generated if a feed that is being used with the current certificate has become unavailable.
Audit : Other Audit Failure
KL_ALERT_OutdatedFeed
This event is generated if a feed has not been updated during the specified period.
Audit : Other Audit Failure
KL_ALERT_ServiceUnavailable
This event is generated when the watchdog module has detected that Feed Service has crashed or frozen.
Audit : Other Audit Failure
KL_ALERT_ServiceStopped
This event is generated when Feed Service is stopped successfully.
Audit : Startup and Shutdown
KL_ALERT_ServiceStarted
This event is generated when Feed Service is started successfully.
Audit : Startup and Shutdown
KL_ALERT_UpdatedFeed
This event is generated when a feed is updated and loaded by Feed Service.
Audit : Other Audit Success
KL_ALERT_FailedToUpdateFeed
This event is generated when Feed Service fails to load a new feed (for example, due to the limitation on the number of indicators that is imposed by the license key) and continues using an old feed.
Audit : Other Audit Failure
KL_ALERT_LicenseExpires
This event is generated to inform you that the license key that is being used will expire in less than 30 days.
Audit : Policy
KL_ALERT_LicenseExpired
This event is generated when your license key has expired.
Audit : Policy
KL_ALERT_EPSLimitExceeded
This event is generated when the limit on the number of processed events per second (EPS) imposed by the licensed key or licensing level has been exceeded.
Audit : Policy
KL_ALERT_EPSHardLimit
This event is generated when Feed Service limits the number of events processed per second (EPS) to the maximum number of events for the current license key or licensing level. The limit applies regardless of the number of incoming events.
Audit : Policy
KL_ALERT_LicenseChanged
This event is generated when Kaspersky CyberTrace starts to use another license key or licensing level.
Audit : Configuration
KL_ALERT_RetroScanError
This event is generated when the retrospective scan task failed.
Audit : Other Audit Failure
KL_ALERT_RetroScanCompleted
This event is generated when the retrospective scan task succeeded.
Audit : Other Audit Success
KL_ALERT_RetroScanStorageExceeded
This event is generated when the limit on the size of the saved events has been exceeded.
Audit : Policy
KL_ALERT_IndicatorsStoreLimitExceeded
This event is generated when the limit on the size of the saved indicators has been exceeded.
Audit : Policy
KL_ALERT_IndicatorsStoreHardLimit
This event is generated when Kaspersky CyberTrace limits adding and updating of indicators.
Audit : Policy
KL_ALERT_FreeSpaceEnds
This event is generated when the available disk space becomes low.
Audit : Policy
Alert events may contain context fields, as described in the section about the alert events of Kaspersky CyberTrace.
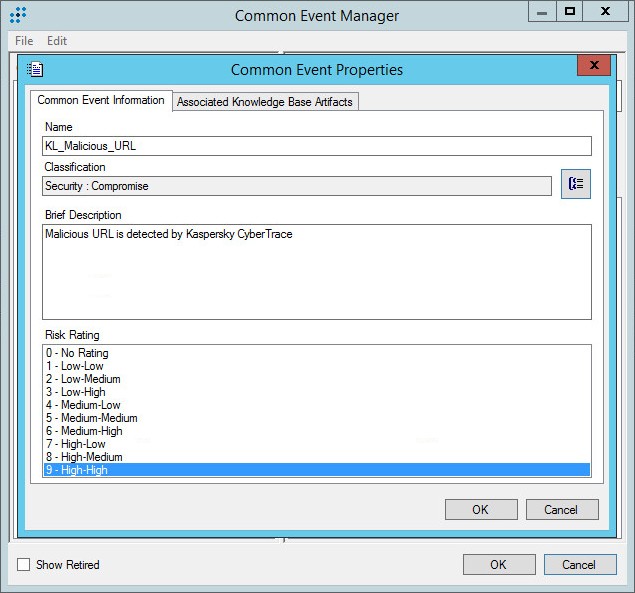
Common Event Properties window
- Events of the
After the events are added, the Common Event Manager window must contain the events as shown in the figure below.
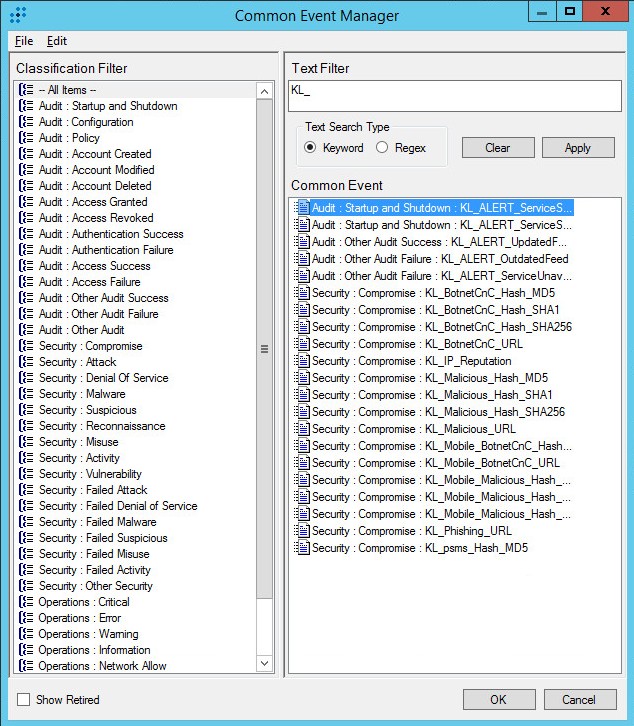
Added events
Page topStep 4 (optional). Adding Kaspersky CyberTrace rules
This section describes how you can add Kaspersky CyberTrace rules to LogRhythm manually.
Skip this step, if importing Kaspersky CyberTrace rules and events succeeds.
To add Kaspersky CyberTrace rules to LogRhythm:
- Run LogRhythm Console.
- Select Deployment Manager > Tools > Knowledge > MPE Rule Builder.
The Rule Builder form opens.
- For every event, add a rule by clicking the Create a new rule button (
 ).
).For every rule do the following:
- In the General section, click the button next to the Common Event box and select the required event.
The event will be displayed in the box.
- In the Log Message Source Type Associations section, specify
Kaspersky CyberTraceas the log source type. - To set the rule status, select the Production or Test radio button.
When creating regular expressions (in the Base-rule Regular Expressions section), follow the instructions provided in the LogRhythm Help section "Use MPE Rule Builder - Parsing Fields and Tags".
We recommend that you use the regular expressions provided in the table below.
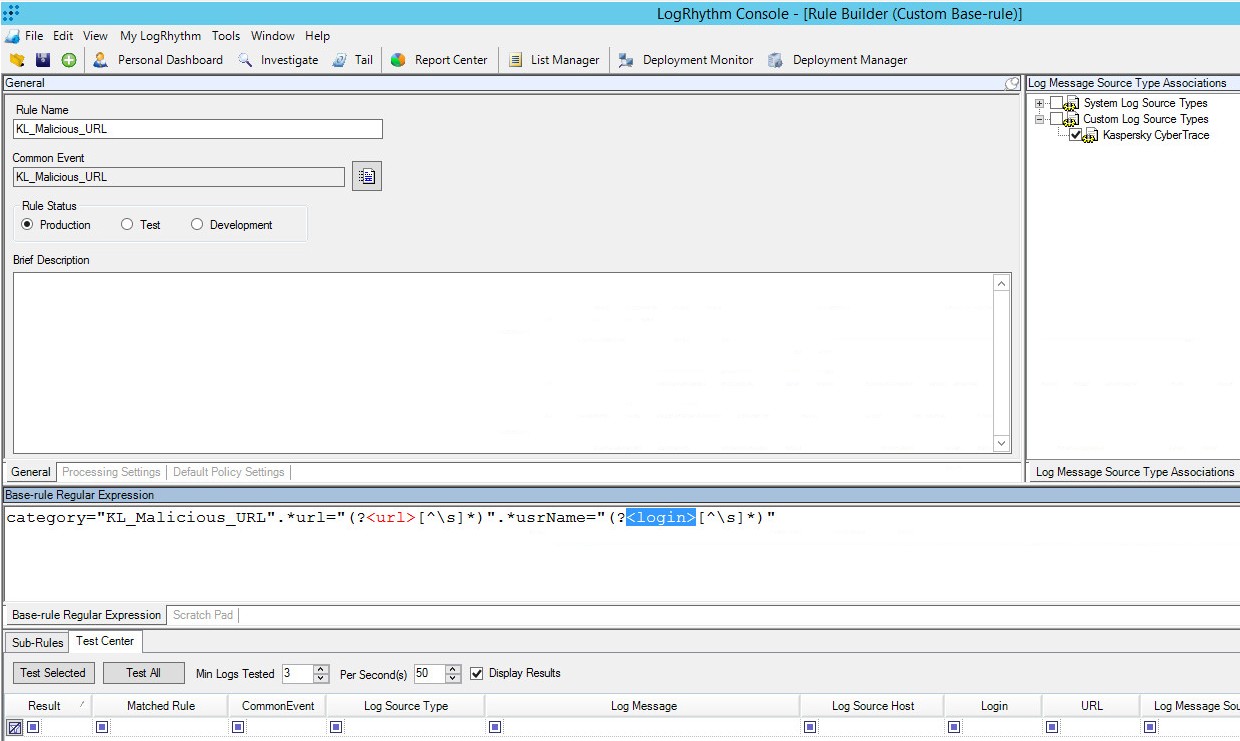
Rule Builder form
- In the General section, click the button next to the Common Event box and select the required event.
The following list contains regular expressions for each event. If you want to use other regular expressions, use the example events from the second column of the table to check the regular expressions of your choice.
- AbuseCh_Feodo_Block_IP
Regular expression
Event example for checking regular expressions
category=AbuseCh_Feodo_Block_IP.*ip=(?<object>[^\s]*).*usrName=(?<login>[^\s]*)May 2 16:41:40 category=AbuseCh_Feodo_Block_IP matchedIndicator=103.11.83.52 url=- src=- ip=103.11.83.52 md5=- sha1=- sha256=- usrName=VerifTestUserName ip=103.11.83.52 source=https://feodotracker.abuse.ch/downloads/ipblocklist.txt - AbuseCh_Ransomware_Block_URL
Regular expression
Event example for checking regular expressions
category=AbuseCh_Ransomware_Block_URL.*url=(?<url>[^\s]*).*usrName=(?<login>[^\s]*)May 2 16:41:40 category=AbuseCh_Ransomware_Block_URL matchedIndicator=00005ik.rcomhost.com/7fg3g url=00005ik.rcomhost.com/7fg3g src=- ip=- md5=- sha1=- sha256=- usrName=- source=https://ransomwaretracker.abuse.ch/downloads/RW_URLBL.txt url=00005ik.rcomhost.com/7fg3g - AbuseCh_Ransomware_Block_Domain
Regular expression
Event example for checking regular expressions
category=AbuseCh_Ransomware_Block_Domain.*url=(?<url>[^\s]*).*usrName=(?<login>[^\s]*)May 2 16:41:40 category=AbuseCh_Ransomware_Block_Domain matchedIndicator=pagaldaily.com url=pagaldaily.com src=- ip=- md5=- sha1=- sha256=- usrName=- domain=pagaldaily.com source=https://ransomwaretracker.abuse.ch/downloads/RW_DOMBL.txt - AbuseCh_Ransomware_Block_IP
Regular expression
Event example for checking regular expressions
category=AbuseCh_Ransomware_Block_IP.*ip=(?<object>[^\s]*).*usrName=(?<login>[^\s]*)May 2 16:41:40 category=AbuseCh_Ransomware_Block_IP matchedIndicator=83.217.11.193 url=- src=- ip=83.217.11.193 md5=- sha1=- sha256=- usrName=VerifTestUserName ip=83.217.11.193 source=https://ransomwaretracker.abuse.ch/downloads/RW_IPBL.txt - AbuseCh_Ransomware_Common_URL
Regular expression
Event example for checking regular expressions
category=AbuseCh_Ransomware_Common_URL.*url=(?<url>[^\s]*).*usrName=(?<login>[^\s]*)May 2 16:41:40 category=AbuseCh_Ransomware_Common_URL matchedIndicator=83.217.11.193/linuxsucks.php url=83.217.11.193/linuxsucks.php src=- ip=- md5=- sha1=- sha256=- usrName=- ASN=199669 IPList=[{ ip=83.217.11.193}] country=RU domain=83.217.11.193 first_seen=12.08.2018 00:46 malware=Locky registar= source=https://ransomwaretracker.abuse.ch/feeds/csv/ status=offline threat=C2 url=83.217.11.193/linuxsucks.php - AbuseCh_SSL_Certificate_Block_IP
Regular expression
Event example for checking regular expressions
category=AbuseCh_SSL_Certificate_Block_IP.*ip=(?<object>[^\s]*).*usrName=(?<login>[^\s]*)May 2 16:41:40 category=AbuseCh_SSL_Certificate_Block_IP matchedIndicator=83.217.11.193 url=- src=- ip=83.217.11.193 md5=- sha1=- sha256=- usrName=VerifTestUserName ip=83.217.11.193 source=https://sslbl.abuse.ch/blacklist/sslblacklist.csv - AbuseCh_SSL_Certificate_Hash_SHA1
Regular expression
Event example for checking regular expressions
category=AbuseCh_SSL_Certificate_Hash_SHA1.*sha1=(?<object>[^\s]*).*usrName=(?<login>[^\s]*)May 2 16:41:40 category=AbuseCh_SSL_Certificate_Hash_SHA1 matchedIndicator=3395856ce81f2b7382dee72602f798b642f14140 url=- src=- ip=- md5=- sha1=3395856ce81f2b7382dee72602f798b642f14140 sha256=- usrName=VerifTestUserName MD5=86255ec982e822f6b57855d3866618ae data_added=2015-09-22 - BlocklistDe_Block_IP
Regular expression
Event example for checking regular expressions
category=BlocklistDe_Block_IP.*ip=(?<object>[^\s]*).*usrName=(?<login>[^\s]*)May 2 16:41:40 category=BlocklistDe_Block_IP matchedIndicator=83.217.11.193 url=- src=- ip=83.217.11.193 md5=- sha1=- sha256=- usrName=VerifTestUserName ip=83.217.11.193 - CyberCrime_Tracker_Block_Url
Regular expression
Event example for checking regular expressions
category= CyberCrime_Tracker_Block_Url.*url=(?<url>[^\s]*).*usrName=(?<login>[^\s]*)May 2 16:41:40 category=CyberCrime_Tracker_Block_Url matchedIndicator=83.217.11.193/linuxsucks.php url=83.217.11.193/linuxsucks.php src=- ip=- md5=- sha1=- sha256=- usrName=- ASN=199669 IPList=[{ ip=83.217.11.193}] country=RU domain=83.217.11.193 first_seen=12.08.2018 00:46 malware=Locky status=offline threat=C2 url=83.217.11.193/linuxsucks.php - EmergingThreats_Block_IP
Regular expression
Event example for checking regular expressions
category=EmergingThreats_Block_IP.*ip=(?<object>[^\s]*).*usrName=(?<login>[^\s]*)May 2 16:41:40 category=EmergingThreats_Block_IP matchedIndicator=101.200.81.187 url=- src=- ip=101.200.81.187 md5=- sha1=- sha256=- usrName=VerifTestUserName ip=101.200.81.187 source=https://rules.emergingthreats.net/fwrules/emerging-Block-IPs.txt - EmergingThreats_Compromised_IP
Regular expression
Event example for checking regular expressions
category=EmergingThreats_Compromised_IP.*ip=(?<object>[^\s]*).*usrName=(?<login>[^\s]*)May 2 16:41:40 category=EmergingThreats_Compromised_IP matchedIndicator=100.24.121.249 url=- src=- ip=100.24.121.249 md5=- sha1=- sha256=- usrName=VerifTestUserName ip=100.24.121.249 source=https://rules.emergingthreats.net/blockrules/compromised-ips.txt - KL_ALERT_FeedBecameAvailable
Regular expression
Event example for checking regular expressions
alert=KL_ALERT_FeedBecameAvailable.*feed=(?<object>[^\s]*)May 2 16:41:40 alert=KL_ALERT_FeedBecameAvailable feed=Botnet_CnC_URL_Data_Feed.json - KL_ALERT_FeedBecameUnavailable
Regular expression
Event example for checking regular expressions
alert=KL_ALERT_FeedBecameUnavailable.*feed=(?<object>[^\s]*)May 2 16:41:40 alert=KL_ALERT_FeedBecameUnavailable feed=Botnet_CnC_URL_Data_Feed.json - KL_ALERT_OutdatedFeed
Regular expression
Event example for checking regular expressions
alert=KL_ALERT_OutdatedFeed.*feed=(?<object>[^\s]*)May 2 16:41:40 alert=KL_ALERT_OutdatedFeed feed=Botnet_CnC_URL_Data_Feed.json - KL_ALERT_ServiceStarted
Regular expression
Event example for checking regular expressions
alert=KL_ALERT_ServiceStartedMay 2 16:41:40 alert=KL_ALERT_ServiceStarted - KL_ALERT_ServiceStopped
Regular expression
Event example for checking regular expressions
alert=KL_ALERT_ServiceStoppedMay 2 16:41:40 alert=KL_ALERT_ServiceStopped - KL_ALERT_ServiceUnavailable
Regular expression
Event example for checking regular expressions
alert=KL_ALERT_ServiceUnavailableMay 2 16:41:40 alert=KL_ALERT_ServiceUnavailable - KL_ALERT_UpdatedFeed
Regular expression
Event example for checking regular expressions
alert=KL_ALERT_UpdatedFeed.*feed=(?<object>[^\s]*).*records=(?<quantity>[^\s]*)May 2 16:41:40 alert=KL_ALERT_UpdatedFeed feed=Botnet_CnC_URL_Data_Feed.json records=23 - KL_ALERT_FailedToUpdateFeed
Regular expression
Event example for checking regular expressions
alert=KL_ALERT_FailedToUpdateFeed.*feed=(?<object>[^\s]*)May 2 16:41:40 alert=KL_ALERT_FailedToUpdateFeed feed=Botnet_CnC_URL_Data_Feed.json - KL_ALERT_LicenseExpires
Regular expression
Event example for checking regular expressions
alert=KL_ALERT_LicenseExpires.*license_name=(?<object>[^\s]*)May 2 16:41:40 alert=KL_ALERT_LicenseExpires expiration_date=23.02.2020 license_name=kl_license - KL_ALERT_LicenseExpired
Regular expression
Event example for checking regular expressions
alert=KL_ALERT_LicenseExpired.*license_name=(?<object>[^\s]*)May 2 16:41:40 alert=KL_ALERT_LicenseExpired expiration_date=23.02.2020 license_name=kl_license - KL_ALERT_EPSLimitExceeded
Regular expression
Event example for checking regular expressions
alert=KL_ALERT_EPSLimitExceeded.*current_eps=(?<quantity>[^\s]*)May 2 16:41:40 alert=KL_ALERT_EPSLimitExceeded current_eps=6500 license_limit_eps=5000 - KL_ALERT_EPSHardLimit
Regular expression
Event example for checking regular expressions
alert=KL_ALERT_EPSHardLimit.*license_limit_eps=(?<quantity>[^\s]*)May 2 16:41:40 alert=KL_ALERT_EPSHardLimit license_limit_eps=5000 - KL_ALERT_LicenseChanged
Regular expression
Event example for checking regular expressions
alert=KL_ALERT_LicenseChanged.*license_name=(?<object>[^\s]*)May 2 16:41:40 alert=KL_ALERT_LicenseChanged expiration_date=23.02.2020 license_name=kl_license license_level=EnterpriseTIP - KL_ALERT_ConfigurationUpdated
Regular expression
Event example for checking regular expressions
alert=KL_ALERT_ConfigurationUpdatedMay 2 16:41:40 alert=KL_ALERT_ConfigurationUpdated - KL_ALERT_RetroScanError
Regular expression
Event example for checking regular expressions
alert=KL_ALERT_RetroScanError.*error=(?<object>[^\s]*)May 2 16:41:40 alert=KL_ALERT_RetroScanError error=Service is unavailable - KL_ALERT_RetroScanCompleted
Regular expression
Event example for checking regular expressions
alert=KL_ALERT_RetroScanCompleted.*iocs_rescaned=(?<object>[^\s]*).*iocs_detected=(?<quantity>[^\s]*).*retroscan_report=(?<url>[^\s]*)May 2 16:41:40 alert=KL_ALERT_RetroScanCompleted iocs_rescaned=1998 iocs_detected=82 retroscan_report=https://127.0.0.1:443/retroscan/81650945-f186-437b-8945-9f31715d32da - KL_ALERT_RetroScanStorageExceeded
Regular expression
Event example for checking regular expressions
alert=KL_ALERT_RetroScanStorageExceeded.*storage_size_limit=(?<object>[^\s]*)May 2 16:41:40 alert=KL_ALERT_RetroScanStorageExceeded storage_size_limit=9876 - KL_ALERT_IndicatorsStoreLimitExceeded
Regular expression
Event example for checking regular expressions
alert=KL_ALERT_IndicatorsStoreLimitExceeded.*current_indicators_count=(?<object>[^\s]*).*license_limit_indicators=(?<quantity>[^\s]*)May 2 16:41:40 alert=KL_ALERT_IndicatorsStoreLimitExceeded current_indicators_count=489002001 license_limit_indicator=5000000 - KL_ALERT_IndicatorsStoreHardLimit
Regular expression
Event example for checking regular expressions
alert=KL_ALERT_IndicatorsStoreHardLimit.*license_limit_indicators=(?<quantity>[^\s]*).*msg=(?<object>[^\s]*)May 2 16:41:40 alert=KL_ALERT_IndicatorsStoreHardLimit license_limit_indicators=5000000 msg=Indicators store limit exceeded - KL_ALERT_FreeSpaceEnds
Regular expression
Event example for checking regular expressions
alert=KL_ALERT_FreeSpaceEnds.*msg=Free space left: (?<object>[^\s]*) MbMay 2 16:41:40 alert=KL_ALERT_FreeSpaceEnds msg=Free space left: 7322 Mb - KL_APT_Hash_MD5
Regular expression
Event example for checking regular expressions
category=KL_APT_Hash_MD5.*matchedIndicator=(?<object>[^\s]*).*usrName=(?<login>[^\s]*)May 2 16:41:40 category=KL_APT_Hash_MD5 matchedIndicator=7A2E65A0F70EE0615EC0CA34240CF082 url=- src=192.168.0.0 ip=- md5=7A2E65A0F70EE0615EC0CA34240CF082 sha1=- sha256=- usrName=VerifTestUserName MD5=7A2E65A0F70EE0615EC0CA34240CF082 detection_date=01.06.2018 00:00 publication_name=TestRecordMb - KL_APT_Hash_SHA1
Regular expression
Event example for checking regular expressions
category=KL_APT_Hash_SHA1.*sha1=(?<object>[^\s]*).*usrName=(?<login>[^\s]*)May 2 16:41:40 category=KL_APT_Hash_SHA1 matchedIndicator=7A2EE06E65A0F70EE0615EC0CA342470EE0CF082 url=- src=192.168.0.0 ip=- md5=- sha1=7A2EE06E65A0F70EE0615EC0CA342470EE0CF082 sha256=- usrName=VerifTestUserName MD5=7A2E65A0F70EE0615EC0CA34240CF082 SHA1=EA2EE06E65A0F70EE0615EC0CA342470EE0CF082 SHA256=2EE072EEA2EE615EC006E65A0CF0F70EA342E0615EC0F70ECA342470EE0CF082 detection_date=01.06.2018 00:00 publication_name=TestRecord - KL_APT_Hash_SHA256
Regular expression
Event example for checking regular expressions
category=KL_APT_Hash_SHA256.*sha256=(?<object>[^\s]*).*usrName=(?<login>[^\s]*)May 2 16:41:40 category=KL_APT_Hash_SHA256 matchedIndicator=2EE072EEA2EE615EC006E65A0CF0F70EA342E0615EC0F70ECA342470EE0CF082 url=- src=192.168.0.0 ip=- md5=- sha1=- sha256=2EE072EEA2EE615EC006E65A0CF0F70EA342E0615EC0F70ECA342470EE0CF082 usrName=VerifTestUserName MD5=7A2E65A0F70EE0615EC0CA34240CF082 SHA1=EA2EE06E65A0F70EE0615EC0CA342470EE0CF082 SHA256=2EE072EEA2EE615EC006E65A0CF0F70EA342E0615EC0F70ECA342470EE0CF082 detection_date=01.06.2018 00:00 publication_name=TestRecord - KL_APT_IP
Regular expression
Event example for checking regular expressions
category=KL_APT_IP.*matchedIndicator=(?<object>[^\s]*).*usrName=(?<login>[^\s]*)May 2 16:41:40 category=KL_APT_IP matchedIndicator=192.0.2.4 url=- src=192.168.0.0 ip=192.0.2.4 md5=- sha1=- sha256=- usrName=VerifTestUserName detection_date=01.06.2018 00:00 ip=192.0.2.4 publication_name=TestRecord - KL_APT_URL
Regular expression
Event example for checking regular expressions
category=KL_APT_URL.*matchedIndicator=(?<url>[^\s]*).*usrName=(?<login>[^\s]*)May 2 16:41:40 category=KL_APT_URL matchedIndicator=b046f5b25458638f6705d53539c79f62.com url=b046f5b25458638f6705d53539c79f62.com src=192.168.0.0 ip=- md5=- sha1=- sha256=- usrName=VerifTestUserName detection_date=01.06.2018 00:00 id=0 mask=b046f5b25458638f6705d53539c79f62.com publication_name=TestRecord type=1 - KL_BotnetCnC_Hash_MD5
Regular expression
Event example for checking regular expressions
category=KL_BotnetCnC_Hash_MD5.*md5=(?<object>[^\s]*).*usrName=(?<login>[^\s]*).*mask=(?<url>[^\s]*).*threat=(?<objectname>[^\s]*)May 2 16:41:40 category=KL_BotnetCnC_Hash_MD5 url=- md5=E013C01AB3E27BE6FBA4E23EE88B100F sha1=- sha256=- ip=- usrName=VerifTestUserName IP=118.142.224.213, 160.16.120.71, 61.19.201.7 files=[{MD5=E013C01AB3E27BE6FBA4E23EE88B100F SHA256=C00269AA2BCF375D0CF870C36F737C27EBB04F69F5B6912F860D8A1F5F1D9DF6}] first_seen=08.07.2015 23:39 geo=jp, hk, tw, au, th, cn, my, ph, vn, in id=9189405 last_seen=29.10.2015 15:59 mask=172.117.45.14/pid=1000/botnet_setup_3.exe popularity=5 threat=Trojan-Banker.AndroidOS.Wroba type=3 - KL_BotnetCnC_Hash_SHA1
Regular expression
Event example for checking regular expressions
category=KL_BotnetCnC_Hash_SHA1.*sha1=(?<object>[^\s]*).*usrName=(?<login>[^\s]*).*mask=(?<url>[^\s]*).*threat=(?<objectname>[^\s]*)May 2 16:41:40 category=KL_BotnetCnC_Hash_SHA1 url=- md5=- sha1=FE61DED0504013D9ED6691F6C5BB69DCD8C8DD60 sha256=- ip=- usrName=VerifTestUserName IP=78.47.151.188 files=[{SHA1=FE61DED0504013D9ED6691F6C5BB69DCD8C8DD60 SHA256=B6AEF9CBFA21B0A9E6D03364F5476B81C4A5D8EF212DFB35E3EF96003CADCB0B}] first_seen=21.07.2015 12:19 geo=it, es, de, fr, gb id=9320249 last_seen=14.01.2016 12:55 mask=botnet_domain_4.com/get.php?p=4&id=2 popularity=4 threat=Trojan-SMS.AndroidOS.Opfake type=4 - KL_BotnetCnC_Hash_SHA256
Regular expression
Event example for checking regular expressions
category=KL_BotnetCnC_Hash_SHA256.*sha256=(?<object>[^\s]*).*usrName=(?<login>[^\s]*).*mask=(?<url>[^\s]*).*threat=(?<objectname>[^\s]*)May 2 16:41:40 category=KL_BotnetCnC_Hash_SHA256 url=- md5=- sha1=- sha256=AFDD5508B48B8270C1DBAF32121A00951E450A56791275D8E7C413EF8380A809 ip=- usrName=VerifTestUserName IP=46.4.114.61, 95.213.186.51, 95.213.192.71, 176.9.82.215, 178.63.12.207, 109.206.186.164, 176.9.48.86, 213.163.70.170, 95.213.192.83, 173.45.161.113 files=[{MD5=55B8D137C80AE5E995EC355524594F3B SHA1=BEA6B860C719F1C886461C8A3FF4935471D2FA64 SHA256=AFDD5508B48B8270C1DBAF32121A00951E450A56791275D8E7C413EF8380A809}] first_seen=15.04.2015 13:18 geo=vn, in, tr, mx, ir, bd, id, dz, ph, th id=9230458 last_seen=14.01.2016 12:55 mask=*.subbotnet_domain_19.botnet_domain.com popularity=5 threat=Trojan.Win32.Agent type=19 - KL_BotnetCnC_URL
Regular expression
Event example for checking regular expressions
category=KL_BotnetCnC_URL.*url=(?<url>[^\s]*).*usrName=(?<login>[^\s]*)May 2 16:41:40 category=KL_BotnetCnC_URL url=http://d.subphishing_domain.phishing_domain_19.com md5=- sha1=- sha256=- ip=- usrName=VerifTestUserName IP=104.168.159.146, 138.201.0.229, 138.201.0.231, 138.201.0.230, 78.46.185.21, 78.46.185.23, 78.46.185.12, 78.46.185.3, 78.46.185.16, 78.46.185.28 first_seen=12.01.2016 12:50 geo=br, pt, us id=9508721 last_seen=14.01.2016 13:36 mask=*.subphishing_domain.phishing_domain_19.com popularity=5 type=19 - KL_ICS_Hash_MD5
Regular expression
Event example for checking regular expressions
category=KL_ICS_Hash_MD5.*md5=(?<object>[^\s]*).*usrName=(?<login>[^\s]*).*threat=(?<objectname>[^\s]*)May 2 16:41:40 category=KL_ICS_Hash_MD5 matchedIndicator=7A8F30B40C6564EFF95E678F7C43346C url=- src=- ip=- md5=7A8F30B40C6564EFF95E678F7C43346C sha1=- sha256=- usrName=VerifTestUserName MD5=7A8F30B40C6564EFF95E678F7C43346C SHA1=E51B1A1FDA2CAF10623A83A1476585AC6E10D569 SHA256=EF6CDD46DB5513F7247789E559A1520F6C1DCD17235C395EDCA3E5043988B54B file_size=1989 first_seen=10.07.2015 23:53 last_seen=12.10.2019 18:44 popularity=1 threat=HEUR:Trojan.Win32.Generic - KL_ICS_Hash_SHA1
Regular expression
Event example for checking regular expressions
category=KL_ICS_Hash_SHA1.*sha1=(?<object>[^\s]*).*usrName=(?<login>[^\s]*).*threat=(?<objectname>[^\s]*)May 2 16:41:40 category=KL_ICS_Hash_SHA1 matchedIndicator=E51B1A1FDA2CAF10623A83A1476585AC6E10D569 url=- src=- ip=- md5=- sha1=E51B1A1FDA2CAF10623A83A1476585AC6E10D569 sha256=- usrName=VerifTestUserName MD5=7A8F30B40C6564EFF95E678F7C43346C SHA1=E51B1A1FDA2CAF10623A83A1476585AC6E10D569 SHA256=EF6CDD46DB5513F7247789E559A1520F6C1DCD17235C395EDCA3E5043988B54B file_size=1989 first_seen=10.07.2015 23:53 last_seen=12.10.2019 18:44 popularity=1 threat=HEUR:Trojan.Win32.Generic - KL_ICS_Hash_SHA256
Regular expression
Event example for checking regular expressions
category=KL_ICS_Hash_SHA256.*sha256=(?<object>[^\s]*).*usrName=(?<login>[^\s]*).*threat=(?<objectname>[^\s]*)May 2 16:41:40 category=KL_ICS_Hash_SHA256 matchedIndicator=EF6CDD46DB5513F7247789E559A1520F6C1DCD17235C395EDCA3E5043988B54B url=- src=- ip=- md5=- sha1=- sha256=EF6CDD46DB5513F7247789E559A1520F6C1DCD17235C395EDCA3E5043988B54B usrName=VerifTestUserName MD5=7A8F30B40C6564EFF95E678F7C43346C SHA1=E51B1A1FDA2CAF10623A83A1476585AC6E10D569 SHA256=EF6CDD46DB5513F7247789E559A1520F6C1DCD17235C395EDCA3E5043988B54B file_size=1989 first_seen=10.07.2015 23:53 last_seen=12.10.2019 18:44 popularity=1 threat=HEUR:Trojan.Win32.Generic - KL_InternalTI_URL
Regular expression
Event example for checking regular expressions
category=KL_InternalTI_URL.*url=(?<object>[^\s]*).*usrName=(?<login>[^\s]*)May 2 16:41:40 category=KL_InternalTI_URL matchedIndicator=fakess123.nu url=fakess123.nu src=- ip=- md5=- sha1=- sha256=- usrName=VerifTestUser URL=fakess123.nu - KL_InternalTI_IP
Regular expression
Event example for checking regular expressions
category=KL_InternalTI_IP.*ip=(?<object>[^\s]*).*usrName=(?<login>[^\s]*)May 2 16:41:40 category=KL_InternalTI_IP matchedIndicator=192.0.2.0 url=- src=- ip=192.0.2.0 md5=- sha1=- sha256=- usrName=VerifTestUser IP=192.0.2.0 - KL_InternalTI_Hash_MD5
Regular expression
Event example for checking regular expressions
category=KL_InternalTI_MD5.*md5=(?<object>[^\s]*).*usrName=(?<login>[^\s]*)May 2 16:41:40 category=KL_InternalTI_MD5 matchedIndicator=44D88612FEA8A8F36DE82E1278ABB02F url=- src=- ip=- md5=44D88612FEA8A8F36DE82E1278ABB02F sha1=- sha256=- usrName=VerifTestUser MD5=44D88612FEA8A8F36DE82E1278ABB02F - KL_InternalTI_Hash_SHA1
Regular expression
Event example for checking regular expressions
category=KL_InternalTI_SHA1.*sha1=(?<object>[^\s]*).*usrName=(?<login>[^\s]*)May 2 16:41:40 category=KL_InternalTI_SHA1 matchedIndicator=3395856CE81F2B7382DEE72602F798B642F14140 url=- src=- ip=- md5=- sha1=3395856CE81F2B7382DEE72602F798B642F14140 sha256=- usrName=VerifTestUser SHA1=3395856CE81F2B7382DEE72602F798B642F14140 - KL_InternalTI_Hash_SHA256
Regular expression
Event example for checking regular expressions
category=KL_InternalTI_SHA256.*sha256=(?<object>[^\s]*).*usrName=(?<login>[^\s]*)May 2 16:41:40 category=KL_InternalTI_SHA256 matchedIndicator=762B2BE1D22B737A287D0D6D4FBAF983FD214BBA1497C0A3A2C58C7819303C0C url=- src=- ip=- md5=- sha1=- sha256=762B2BE1D22B737A287D0D6D4FBAF983FD214BBA1497C0A3A2C58C7819303C0C usrName=VerifTestUser SHA256=762B2BE1D22B737A287D0D6D4FBAF983FD214BBA1497C0A3A2C58C7819303C0C - KL_IP_Reputation
Regular expression
Event example for checking regular expressions
category=KL_IP_Reputation.*ip=(?<object>[^\s]*).*usrName=(?<login>[^\s]*).*category=(?<process>[^\s]*).*threat_score=(?<severity>[^\s]*)May 2 16:41:40 category=KL_IP_Reputation url=- md5=- sha1=- sha256=- ip=18.50.1.47 usrName=VerifiTestUserName category=spam first_seen=21.01.2015 00:00 ip=18.50.1.47 ip_geo=us last_seen=17.05.2016 03:16 popularity=1 threat_score=100 - KL_IP_Reputation_Hash_MD5
Regular expression
Event example for checking regular expressions
category=KL_IP_Reputation_Hash_MD5.*matchedIndicator=(?<object>[^\s]*).*usrName=(?<login>[^\s]*)May 2 16:41:40 category=KL_IP_Reputation_Hash_MD5 matchedIndicator=61200D253ADD14C91CD64F2CB1F221CB url=- src=- ip=- md5=61200D253ADD14C91CD64F2CB1F221CB sha1=- sha256=- usrName=- category=malware domains=k4d7ppv9.humanpchelp.pw, mwi49i2b.backbonecomputer.top, 9uq5mmw7.overseascomputer.pw, 9tqnii2s.motivationcomputer.pw, 4iaag9ng.luxurypchelp.pw, kxol25kx.pcserviceline.top, 7ifiye96.phoenixcomputerhelp.pw, tnv5yyvj.pcservicecatch.pw, y4ki19os.computercoral.top, pmayaidy.rankpcservice.top files=[{ MD5=61200D253ADD14C91CD64F2CB1F221CB SHA1=E23B0F6ECEFF56870908B2EC704F62ACB4E005AD SHA256=7FC582451A8D9EAF112A3CFC7EFF8EBC8A5FCB8480E42A8D2B5A4E0E3C12D793 threat=HEUR:Trojan.Script.Generic},{ MD5=06A2E41E9CDA9C19AF5FB29483687A56 SHA1=37ED2076FCC0365BA02210E18BBAB162D7338180 SHA256=9570F5C81FF906CD52EE42B5D24359B8A7CA4EC225C532A811699F1089847252 threat=HEUR:Trojan.Script.Generic},{ MD5=AA909F4A33A0D305C0ADF7FCD6DC95E5 SHA1=0A88A71A3C43F02075B7B3CB1A6ED1A603CC666E SHA256=96467635B09D64B29DEAF2A7923ADCD63C2E7F9308B80DDF46F251EBDB2E6A66 threat=HEUR:Trojan.Script.Generic},{ MD5=1D02D52FE17A040A2C7D7C4EE7020E6A SHA1=036D8147D00334824073A22C3D7016EE27643CBD SHA256=737117D867D8CC777AF09F635126C6867ADD08C47C74EDCF5636A84F3F14911B threat=HEUR:Trojan.Script.Generic},{ MD5=393F797A732D5FF35B6102B298349C65 SHA1=760C99F3FB4330BA7B9EB76780718E3023C345EE SHA256=5E86FE0A4DA6A1394DBC6BD2D0F7BD2791BCC1099F83B04282B0508005212FCB threat=HEUR:Trojan.Script.Generic},{ MD5=5A90DDAAEA8646E84927E5DD7BAAA3E2 SHA1=CA2EEF839CF649E42EB4F7E618BD491B40340462 SHA256=1A73D4EA89E89C22B3B03E1A841882A59FCC1ED18299D6914DF4BC2E5CF05A44 threat=HEUR:Trojan.Script.Generic}] first_seen=21.02.2019 23:57 ip=93.115.27.83 ip_geo=lt ip_whois={ asn=16125 country=LT created=01.12.2016 net_name=CHERRYSERVERS-LT-DEDICATED net_range=93.115.27.0 - 93.115.27.255 updated=01.12.2016} last_seen=22.05.2019 19:18 popularity=5 threat_score=94 users_geo=de, jp, fr, it, ch, at, be, pl, es, dz - KL_IP_Reputation_Hash_SHA1
Regular expression
Event example for checking regular expressions
category=KL_IP_Reputation_Hash_SHA1.*matchedIndicator=(?<object>[^\s]*).*usrName=(?<login>[^\s]*)May 2 16:41:40 category=KL_IP_Reputation_Hash_SHA1 matchedIndicator=E23B0F6ECEFF56870908B2EC704F62ACB4E005AD url=- src=- ip=- md5=- sha1=E23B0F6ECEFF56870908B2EC704F62ACB4E005AD sha256=- usrName=- category=malware domains=k4d7ppv9.humanpchelp.pw, mwi49i2b.backbonecomputer.top, 9uq5mmw7.overseascomputer.pw, 9tqnii2s.motivationcomputer.pw, 4iaag9ng.luxurypchelp.pw, kxol25kx.pcserviceline.top, 7ifiye96.phoenixcomputerhelp.pw, tnv5yyvj.pcservicecatch.pw, y4ki19os.computercoral.top, pmayaidy.rankpcservice.top files=[{ MD5=61200D253ADD14C91CD64F2CB1F221CB SHA1=E23B0F6ECEFF56870908B2EC704F62ACB4E005AD SHA256=7FC582451A8D9EAF112A3CFC7EFF8EBC8A5FCB8480E42A8D2B5A4E0E3C12D793 threat=HEUR:Trojan.Script.Generic},{ MD5=06A2E41E9CDA9C19AF5FB29483687A56 SHA1=37ED2076FCC0365BA02210E18BBAB162D7338180 SHA256=9570F5C81FF906CD52EE42B5D24359B8A7CA4EC225C532A811699F1089847252 threat=HEUR:Trojan.Script.Generic},{ MD5=AA909F4A33A0D305C0ADF7FCD6DC95E5 SHA1=0A88A71A3C43F02075B7B3CB1A6ED1A603CC666E SHA256=96467635B09D64B29DEAF2A7923ADCD63C2E7F9308B80DDF46F251EBDB2E6A66 threat=HEUR:Trojan.Script.Generic},{ MD5=1D02D52FE17A040A2C7D7C4EE7020E6A SHA1=036D8147D00334824073A22C3D7016EE27643CBD SHA256=737117D867D8CC777AF09F635126C6867ADD08C47C74EDCF5636A84F3F14911B threat=HEUR:Trojan.Script.Generic},{ MD5=393F797A732D5FF35B6102B298349C65 SHA1=760C99F3FB4330BA7B9EB76780718E3023C345EE SHA256=5E86FE0A4DA6A1394DBC6BD2D0F7BD2791BCC1099F83B04282B0508005212FCB threat=HEUR:Trojan.Script.Generic},{ MD5=5A90DDAAEA8646E84927E5DD7BAAA3E2 SHA1=CA2EEF839CF649E42EB4F7E618BD491B40340462 SHA256=1A73D4EA89E89C22B3B03E1A841882A59FCC1ED18299D6914DF4BC2E5CF05A44 threat=HEUR:Trojan.Script.Generic}] first_seen=21.02.2019 23:57 ip=93.115.27.83 ip_geo=lt ip_whois={ asn=16125 country=LT created=01.12.2016 net_name=CHERRYSERVERS-LT-DEDICATED net_range=93.115.27.0 - 93.115.27.255 updated=01.12.2016} last_seen=22.05.2019 19:18 popularity=5 threat_score=94 users_geo=de, jp, fr, it, ch, at, be, pl, es, dz - KL_IP_Reputation_Hash_SHA256
Regular expression
Event example for checking regular expressions
category=KL_IP_Reputation_Hash_SHA256.*matchedIndicator=(?<object>[^\s]*).*usrName=(?<login>[^\s]*)May 2 16:41:40 category=KL_IP_Reputation_Hash_SHA256 matchedIndicator=7FC582451A8D9EAF112A3CFC7EFF8EBC8A5FCB8480E42A8D2B5A4E0E3C12D793 url=- src=- ip=- md5=- sha1=- sha256=7FC582451A8D9EAF112A3CFC7EFF8EBC8A5FCB8480E42A8D2B5A4E0E3C12D793 usrName=- category=malware domains=k4d7ppv9.humanpchelp.pw, mwi49i2b.backbonecomputer.top, 9uq5mmw7.overseascomputer.pw, 9tqnii2s.motivationcomputer.pw, 4iaag9ng.luxurypchelp.pw, kxol25kx.pcserviceline.top, 7ifiye96.phoenixcomputerhelp.pw, tnv5yyvj.pcservicecatch.pw, y4ki19os.computercoral.top, pmayaidy.rankpcservice.top files=[{ MD5=61200D253ADD14C91CD64F2CB1F221CB SHA1=E23B0F6ECEFF56870908B2EC704F62ACB4E005AD SHA256=7FC582451A8D9EAF112A3CFC7EFF8EBC8A5FCB8480E42A8D2B5A4E0E3C12D793 threat=HEUR:Trojan.Script.Generic},{ MD5=06A2E41E9CDA9C19AF5FB29483687A56 SHA1=37ED2076FCC0365BA02210E18BBAB162D7338180 SHA256=9570F5C81FF906CD52EE42B5D24359B8A7CA4EC225C532A811699F1089847252 threat=HEUR:Trojan.Script.Generic},{ MD5=AA909F4A33A0D305C0ADF7FCD6DC95E5 SHA1=0A88A71A3C43F02075B7B3CB1A6ED1A603CC666E SHA256=96467635B09D64B29DEAF2A7923ADCD63C2E7F9308B80DDF46F251EBDB2E6A66 threat=HEUR:Trojan.Script.Generic},{ MD5=1D02D52FE17A040A2C7D7C4EE7020E6A SHA1=036D8147D00334824073A22C3D7016EE27643CBD SHA256=737117D867D8CC777AF09F635126C6867ADD08C47C74EDCF5636A84F3F14911B threat=HEUR:Trojan.Script.Generic},{ MD5=393F797A732D5FF35B6102B298349C65 SHA1=760C99F3FB4330BA7B9EB76780718E3023C345EE SHA256=5E86FE0A4DA6A1394DBC6BD2D0F7BD2791BCC1099F83B04282B0508005212FCB threat=HEUR:Trojan.Script.Generic},{ MD5=5A90DDAAEA8646E84927E5DD7BAAA3E2 SHA1=CA2EEF839CF649E42EB4F7E618BD491B40340462 SHA256=1A73D4EA89E89C22B3B03E1A841882A59FCC1ED18299D6914DF4BC2E5CF05A44 threat=HEUR:Trojan.Script.Generic}] first_seen=21.02.2019 23:57 ip=93.115.27.83 ip_geo=lt ip_whois={ asn=16125 country=LT created=01.12.2016 net_name=CHERRYSERVERS-LT-DEDICATED net_range=93.115.27.0 - 93.115.27.255 updated=01.12.2016} last_seen=22.05.2019 19:18 popularity=5 threat_score=94 users_geo=de, jp, fr, it, ch, at, be, pl, es, dz - KL_Malicious_Hash_MD5
Regular expression
Event example for checking regular expressions
category=KL_Malicious_Hash_MD5.*md5=(?<object>[^\s]*).*usrName=(?<login>[^\s]*).*file_size=(?<size>[^\s]*).*threat=(?<objectname>[^\s]*)May 2 16:41:40 category=KL_Malicious_Hash_MD5 url=- md5=0F1DCBB2A888B99FAE72144087CAE565 sha1=- sha256=- ip=- usrName=VerifTestUserName MD5=0F1DCBB2A888B99FAE72144087CAE565 file_size=105472 file_type=PE first_seen=26.11.2015 13:06 geo=ru, ro, ua, tj, us, cz, kz, gb last_seen=14.01.2016 12:29 popularity=5 threat=UDS:DangerousObject.Multi.Generic - KL_Malicious_Hash_SHA1
Regular expression
Event example for checking regular expressions
category=KL_Malicious_Hash_SHA1.*sha1=(?<object>[^\s]*).*usrName=(?<login>[^\s]*).*file_size=(?<size>[^\s]*).*threat=(?<objectname>[^\s]*)May 2 16:41:40 category=KL_Malicious_Hash_SHA1 url=- md5=- sha1=6665856CE81F2B7382DEE72602F798B642F14140 sha256=- ip=- usrName=VerifTestUserName MD5=55D88612FEA8A8F36DE82E1278ABB02F SHA1=6665856CE81F2B7382DEE72602F798B642F14140 SHA256=275A021BBFB6489E54D471899F7DB9D1663FC695EC2FE2A2C4777AABF651FD0F file_size=68 first_seen=02.04.2010 22:07 last_seen=14.01.2016 13:41 popularity=5 threat=EICAR-Test-File - KL_Malicious_Hash_SHA256
Regular expression
Event example for checking regular expressions
category=KL_Malicious_Hash_SHA256.*sha256=(?<object>[^\s]*).*usrName=(?<login>[^\s]*).*file_size=(?<size>[^\s]*).*threat=(?<objectname>[^\s]*)May 2 16:41:40 category=KL_Malicious_Hash_SHA256 url=- md5=- sha1=- sha256=EC1D5E24A9F866F21118914445AB0A00A60F791B51478F3D0DD375A6BD45897D ip=- usrName=VerifTestUserName SHA1=C365DC5128FF0A607D78BFBAB36E08263DC66B18 SHA256=EC1D5E24A9F866F21118914445AB0A00A60F791B51478F3D0DD375A6BD45897D file_size=1696256 file_type=PE first_seen=15.07.2015 11:50 geo=ru, ua, by, dz, ir, eg, kz, mx, in, tr last_seen=14.01.2016 12:29 popularity=5 threat=HackTool.Win32.KRT.bw - KL_Malicious_URL
Regular expression
Event example for checking regular expressions
category=KL_Malicious_URL.*url=(?<url>[^\s]*).*usrName=(?<login>[^\s]*)May 2 16:41:40 category=KL_Malicious_URL url=http://sub1.submalicious_domain.malicious_domain_19.com md5=- sha1=- sha256=- ip=- usrName=VerifTestUserName IP=217.23.14.223 first_seen=14.01.2016 02:42 geo=ru, kz, ro, ua, by, cz id=9524476 last_seen=14.01.2016 13:36 mask=*.submalicious_domain.malicious_domain_19.com popularity=5 type=19 - KL_Malicious_URL_Hash_MD5
Regular expression
Event example for checking regular expressions
category=KL_Malicious_URL_Hash_MD5.*matchedIndicator=(?<object>[^\s]*).*usrName=(?<login>[^\s]*)May 2 16:41:40 category=KL_Malicious_URL_Hash_MD5 matchedIndicator=C735608E2DDE63857C3877AE438EBF78 url=- src=- ip=- md5=C735608E2DDE63857C3877AE438EBF78 sha1=- sha256=- usrName=- IP=104.27.160.251, 104.27.161.251, 145.239.252.74, 46.35.111.137, 207.244.89.108, 54.37.87.37, 207.244.89.90, 77.111.246.8, 131.173.16.52 category=Malware files=[{ MD5=C735608E2DDE63857C3877AE438EBF78 SHA1=9FB04AB8756742E9903A9A77566938DC9D83138C SHA256=127E83998D65FD80328D89B87B9C4CB5756C57FCC03189FAC5B7D77D4FB48FC5 threat=HEUR:Trojan.Script.Miner.gen}] first_seen=15.03.2019 14:27 geo=es, de, it, ru, ve, pl, pt, jp, kz, mx id=29703667 last_seen=23.05.2019 14:12 mask=tercabilis.info popularity=4 type=1 whois={ NS=art.ns.cloudflare.com, olga.ns.cloudflare.com NS_ips=173.245.58.137, 173.245.59.102 country=FR created=02.10.2018 domain=tercabilis.info expires=02.10.2019 org=NETIM registrar_name=NETIM SARL updated=01.12.2018} - KL_Malicious_URL_Hash_SHA1
Regular expression
Event example for checking regular expressions
category=KL_Malicious_URL_Hash_SHA1.*matchedIndicator=(?<object>[^\s]*).*usrName=(?<login>[^\s]*)May 2 16:41:40 category=KL_Malicious_URL_Hash_SHA1 matchedIndicator=9FB04AB8756742E9903A9A77566938DC9D83138C url=- src=- ip=- md5=- sha1=9FB04AB8756742E9903A9A77566938DC9D83138C sha256=- usrName=- IP=163.172.129.78, 212.47.250.90 category=Malware files=[{ MD5=9096549542B5A4E711BF04732416AA97 SHA1=4616FF9FBFF692535C6F0D9BD347CC0593A1F6B8 threat=HEUR:Trojan.Script.Miner.gen},{ MD5=6CBF2B0ADC72F64913EDE949A3F93B2D SHA1=5BB602A5A3AE5C685F0EB9CF2BFE9546DFC5832A SHA256=E804F6ADF2B7C99A8E0B158E880DF3172131CFAD7D796A75CBC2E46606371D2E threat=HEUR:Trojan.Script.Miner.gen},{ MD5=C735608E2DDE63857C3877AE438EBF78 SHA1=9FB04AB8756742E9903A9A77566938DC9D83138C SHA256=127E83998D65FD80328D89B87B9C4CB5756C57FCC03189FAC5B7D77D4FB48FC5 threat=HEUR:Trojan.Script.Miner.gen}] first_seen=29.05.2018 15:54 geo=ru, kz, by, ua id=23128232 last_seen=23.03.2019 12:07 mask=play.on.animeteatr.ru popularity=3 type=2 - KL_Malicious_URL_Hash_SHA256
Regular expression
Event example for checking regular expressions
category=KL_Malicious_URL_Hash_SHA256.*matchedIndicator=(?<object>[^\s]*).*usrName=(?<login>[^\s]*)May 2 16:41:40 category=KL_Malicious_URL_Hash_SHA256 matchedIndicator=127E83998D65FD80328D89B87B9C4CB5756C57FCC03189FAC5B7D77D4FB48FC5 url=- src=- ip=- md5=- sha1=- sha256=127E83998D65FD80328D89B87B9C4CB5756C57FCC03189FAC5B7D77D4FB48FC5 usrName=- IP=163.172.129.78, 212.47.250.90, 173.192.191.169, 167.99.216.96, 89.238.177.226 category=Malware files=[{ MD5=C735608E2DDE63857C3877AE438EBF78 SHA1=9FB04AB8756742E9903A9A77566938DC9D83138C SHA256=127E83998D65FD80328D89B87B9C4CB5756C57FCC03189FAC5B7D77D4FB48FC5 threat=HEUR:Trojan.Script.Miner.gen},{ MD5=978E8C1CB071387ABBB4A673FF918BB9 SHA1=AFAEEE65BB483994FAC36A6B97F10B2BAA51F832 SHA256=3CFAACB2E8EE3E7CC5685DEDDFED7E34BF7595015307FEE64DD3C196C1D4ED93 threat=HEUR:Trojan.Script.Miner.gen},{ MD5=9096549542B5A4E711BF04732416AA97 SHA1=4616FF9FBFF692535C6F0D9BD347CC0593A1F6B8 threat=HEUR:Trojan.Script.Miner.gen},{ MD5=3FF0CF473B1E8FEB3BC018AF999DF4F5 SHA1=6813E9BB538F4AE1290411DD6AC48D615B5A4F21 threat=HEUR:Trojan.Script.Miner.gen},{ MD5=6CBF2B0ADC72F64913EDE949A3F93B2D SHA1=5BB602A5A3AE5C685F0EB9CF2BFE9546DFC5832A SHA256=E804F6ADF2B7C99A8E0B158E880DF3172131CFAD7D796A75CBC2E46606371D2E threat=HEUR:Trojan.Script.Miner.gen},{ MD5=44A27780FD4ABF64BF4EBB5584857160 SHA1=C9552F0DBF8A213556F3CC0CBD98CBFD157362F9 SHA256=EB703A25657D70CD85059A1AFD4720DF5273C4775EE05C6A2B1D3FBFD84D767C threat=HEUR:Trojan.Script.Miner.gen}] first_seen=29.05.2018 15:54 geo=de, gr, it, gb, pl, dz, hu, at, br, ch id=23128262 last_seen=07.04.2019 20:16 mask=play.play1.videos.vidto.me popularity=4 type=2 whois={ MX=mail.vidto.me, mail2.vidto.me MX_ips=158.69.116.96 NS=pns1.cloudns.net, pns2.cloudns.net, pns3.cloudns.net, pns4.cloudns.net NS_ips=185.136.96.111, 185.136.97.111, 185.136.98.111, 185.136.99.111 country=SE created=21.06.2012 domain=vidto.me expires=21.06.2021 org=Shield Whois registrar_name=AB NameISP updated=23.11.2018} - KL_Mobile_BotnetCnC_Hash_MD5
Regular expression
Event example for checking regular expressions
category=KL_Mobile_BotnetCnC_Hash_MD5.*url=(?<url>[^\s]*).*usrName=(?<login>[^\s]*).*Mask=(?<object>[^\s{}]*).*verdict=(?<objectname>[^\s]*)May 2 16:41:40 category=KL_Mobile_BotnetCnC_Hash_MD5 url=- md5=12B8D137C80AE5E995EC355524594F3B sha1=- sha256=- ip=- usrName=VerifTestUserName Behaviour=Get Location, Collect phone info, Read SMS, Get Accounts, Read Contacts Details=[{Mask=*.subdbotnet_domain_19.dbotnet_domain.com}] MD5=12B8D137C80AE5E995EC355524594F3B verdict=Evaluation-CnC.AndroidOS - KL_Mobile_BotnetCnC_Hash_SHA1
Regular expression
Event example for checking regular expressions
category=KL_Mobile_BotnetCnC_Hash_SHA1.*sha1=(?<object>[^\s]*).*usrName=(?<login>[^\s]*).*verdict=(?<objectname>[^\s]*)May 2 16:41:40 category=KL_Mobile_BotnetCnC_Hash_SHA1 url=- md5=- sha1=AFAEEE65BB483994FAC36A6B97F10B2BAA51F832 sha256=- ip=- usrName=VerifTestUserName Behaviour=Get Location, Collect phone info, Read SMS, Get Accounts, Read Contacts - KL_Mobile_BotnetCnC_Hash_SHA256
Regular expression
Event example for checking regular expressions
category=KL_Mobile_BotnetCnC_Hash_SHA256.*sha256=(?<object>[^\s]*).*usrName=(?<login>[^\s]*).*verdict=(?<objectname>[^\s]*)May 2 16:41:40 category=KL_Mobile_BotnetCnC_Hash_SHA256 url=- md5=- sha1=- sha256=E804F6ADF2B7C99A8E0B158E880DF3172131CFAD7D796A75CBC2E46606371D2E ip=- usrName=VerifTestUserName Behaviour=Get Location, Collect phone info, Read SMS, Get Accounts, Read Contacts - KL_Mobile_BotnetCnC_URL
Regular expression
Event example for checking regular expressions
category=KL_Mobile_BotnetCnC_URL.*url=(?<url>[^\s]*).*usrName=(?<login>[^\s]*).*Mask=(?<object>[^\s{}]*).*verdict=(?<objectname>[^\s]*)May 2 16:41:40 category=KL_Mobile_BotnetCnC_URL url=baddomain.subdbotnet_domain_19.dbotnet_domain.com md5=- sha1=- sha256=- ip=- usrName=VerifTestUserName Behaviour=Get Location, Collect phone info, Read SMS, Get Accounts, Read Contacts Details=[{Mask=*.subdbotnet_domain_19.dbotnet_domain.com}] MD5=12B8D137C80AE5E995EC355524594F3B verdict=Evaluation-CnC.AndroidOS - KL_Mobile_Malicious_Hash_MD5
Regular expression
Event example for checking regular expressions
category=KL_Mobile_Malicious_Hash_MD5.*md5=(?<object>[^\s]*).*usrName=(?<login>[^\s]*).*file_size=(?<size>[^\s]*).*threat=(?<objectname>[^\s]*)May 2 16:41:40 category=KL_Mobile_Malicious_Hash_MD5 url=- md5=A0D02A618E0FB400EDC0E210DD975E21 sha1=- sha256=- ip=- usrName=VerifTestUserName MD5=A0D02A618E0FB400EDC0E210DD975E21 SHA1=AB04F1F9CFE33EADB7ECC75EDF7A79EE1E22AEE6 SHA256=5E658421AE871ED9EA85A352050B7F27525821649EA0A6863B62BA7BDED2C074 file_size=378980 first_seen=10.09.2015 06:47 geo=ru, in, id, ir, my, bd, ua, br, dz, ro last_seen=14.01.2016 13:18 popularity=5 threat=HEUR:Trojan.AndroidOS.Guerrilla.b - KL_Mobile_Malicious_Hash_SHA1
Regular expression
Event example for checking regular expressions
category=KL_Mobile_Malicious_Hash_SHA1.*sha1=(?<object>[^\s]*).*usrName=(?<login>[^\s]*).*file_size=(?<size>[^\s]*).*threat=(?<objectname>[^\s]*)May 2 16:41:40 category=KL_Mobile_Malicious_Hash_SHA1 url=- md5=- sha1=9DA11F40D00E37D27A7B41EE7C741F4CF0E52AE6 sha256=- ip=- usrName=VerifTestUserName MD5=F9E8AB7B3E0B23203B678772AFD4CDD1 SHA1=9DA11F40D00E37D27A7B41EE7C741F4CF0E52AE6 SHA256=111319613DA28D6D59282EBC2730E0448717CD55B36050B9142167936070F9EE file_size=236096 first_seen=15.12.2015 20:59 geo=ru, ua, in, tr, id, dz, mx, kz, by, ro last_seen=14.01.2016 13:23 popularity=5 threat=HEUR:Trojan.AndroidOS.Ztorg.a - KL_Mobile_Malicious_Hash_SHA256
Regular expression
Event example for checking regular expressions
category=KL_Mobile_Malicious_Hash_SHA256.*sha256=(?<object>[^\s]*).*usrName=(?<login>[^\s]*).*file_size=(?<size>[^\s]*).*threat=(?<objectname>[^\s]*)May 2 16:41:40 category=KL_Mobile_Malicious_Hash_SHA256 url=- md5=- sha1=- sha256=3F52BBBA93A3C757D781ED4D8D526632995FD2F712788D24C528B2F5DB6E3C42 ip=- usrName=VerifTestUserName MD5=A8315A5D4C8ACB982372C16B83BAEAAA SHA1=ABBB5A760C3203CB460D60279269F5568D89F848 SHA256=3F52BBBA93A3C757D781ED4D8D526632995FD2F712788D24C528B2F5DB6E3C42 file_size=444408 first_seen=01.08.2015 00:08 geo=ru, ua, kz, ro, by, cn, tj, uz, az, md last_seen=14.01.2016 13:18 popularity=5 threat=HEUR:Trojan-SMS.AndroidOS.Podec.a - KL_Phishing_URL
Regular expression
Event example for checking regular expressions
category=KL_Phishing_URL.*url=(?<url>[^\s]*).*usrName=(?<login>[^\s]*)May 2 16:41:40 category=KL_Phishing_URL url=http://d.subphishing_domain.phishing_domain_19.com md5=- sha1=- sha256=- ip=- usrName=VerifTestUserName IP=104.168.159.146, 138.201.0.229, 138.201.0.231, 138.201.0.230, 78.46.185.21, 78.46.185.23, 78.46.185.12, 78.46.185.3, 78.46.185.16, 78.46.185.28 first_seen=12.01.2016 12:50 geo=br, pt, us id=9508721 last_seen=14.01.2016 13:36 mask=*.subphishing_domain.phishing_domain_19.com popularity=5 type=19 - KL_Ransomware_URL
Regular expression
Event example for checking regular expressions
category=KL_Ransomware_URL.*url=(?<url>[^\s]*).*usrName=(?<login>[^\s]*)May 2 16:41:40 category=KL_Ransomware_URL matchedIndicator=fakess123r.nu url=fakess123r.nu src=192.168.0.0 ip=- md5=- sha1=- sha256=- usrName=VerifTestUserName first_seen=10.08.2016 14:18 id=0 last_seen=22.12.2017 15:12 mask=fakess123r.nu popularity=1 type=1 - KL_Ransomware_URL_Hash_MD5
Regular expression
Event example for checking regular expressions
category=KL_Ransomware_URL_Hash_MD5.*md5=(?<object>[^\s]*).*usrName=(?<login>[^\s]*)May 2 16:41:40 category=KL_Ransomware_URL_Hash_MD5 matchedIndicator=DAFECEDABFE0F3AB372A7C83B84CEFF6 url=- src=- ip=- md5=DAFECEDABFE0F3AB372A7C83B84CEFF6 sha1=- sha256=- usrName=- IP=104.27.174.162, 104.27.175.162, 188.166.67.166, 193.176.84.67, 185.232.23.3, 5.182.27.20, 178.128.153.190, 78.24.218.108, 158.58.172.76, 2.59.214.27 files=[{ MD5=DAFECEDABFE0F3AB372A7C83B84CEFF6 SHA1=0D68EE713180A5BF73F7C74CE00F067D2BE5CF7C SHA256=7DD78D2CBFF85A80954558C5C01986FC5D9099C87ECE796A374626EB76BE037D threat=HEUR:Trojan.Win32.Generic}] first_seen=01.04.2019 18:17 geo=ru, kz, ua, by, de, lt, ro, pl, md, it id=30341045 last_seen=23.05.2019 14:19 mask=sama-berli.info popularity=5 type=1 whois={ NS=dora.ns.cloudflare.com, zod.ns.cloudflare.com NS_ips=173.245.58.108, 173.245.59.250 country=UA created=24.01.2019 domain=sama-berli.info expires=24.01.2020 org=ZAO Sigva registrar_email=abuse@reg.ru registrar_name=Limited Liability Company "Registrar of domain names REG.RU" updated=29.03.2019} - KL_Ransomware_URL_Hash_SHA1
Regular expression
Event example for checking regular expressions
category=KL_Ransomware_URL_Hash_SHA1.*matchedIndicator=(?<object>[^\s]*).*usrName=(?<login>[^\s]*)May 2 16:41:40 category=KL_Ransomware_URL_Hash_SHA1 matchedIndicator=0D68EE713180A5BF73F7C74CE00F067D2BE5CF7C url=- src=- ip=- md5=- sha1=0D68EE713180A5BF73F7C74CE00F067D2BE5CF7C sha256=- usrName=- IP=104.27.174.162, 104.27.175.162, 188.166.67.166, 193.176.84.67, 185.232.23.3, 5.182.27.20, 178.128.153.190, 78.24.218.108, 158.58.172.76, 2.59.214.27 files=[{ MD5=DAFECEDABFE0F3AB372A7C83B84CEFF6 SHA1=0D68EE713180A5BF73F7C74CE00F067D2BE5CF7C SHA256=7DD78D2CBFF85A80954558C5C01986FC5D9099C87ECE796A374626EB76BE037D threat=HEUR:Trojan.Win32.Generic}] first_seen=01.04.2019 18:17 geo=ru, kz, ua, by, de, lt, ro, pl, md, it id=30341045 last_seen=23.05.2019 14:19 mask=sama-berli.info popularity=5 type=1 whois={ NS=dora.ns.cloudflare.com, zod.ns.cloudflare.com NS_ips=173.245.58.108, 173.245.59.250 country=UA created=24.01.2019 domain=sama-berli.info expires=24.01.2020 org=ZAO Sigva registrar_email=abuse@reg.ru registrar_name=Limited Liability Company "Registrar of domain names REG.RU" updated=29.03.2019} - KL_Ransomware_URL_Hash_SHA256
Regular expression
Event example for checking regular expressions
category=KL_Ransomware_URL_Hash_SHA256.*matchedIndicator=(?<object>[^\s]*).*usrName=(?<login>[^\s]*)May 2 16:41:40 category=KL_Ransomware_URL_Hash_SHA256 matchedIndicator=7DD78D2CBFF85A80954558C5C01986FC5D9099C87ECE796A374626EB76BE037D url=- src=- ip=- md5=- sha1=- sha256=7DD78D2CBFF85A80954558C5C01986FC5D9099C87ECE796A374626EB76BE037D usrName=- IP=104.27.174.162, 104.27.175.162, 188.166.67.166, 193.176.84.67, 185.232.23.3, 5.182.27.20, 178.128.153.190, 78.24.218.108, 158.58.172.76, 2.59.214.27 files=[{ MD5=DAFECEDABFE0F3AB372A7C83B84CEFF6 SHA1=0D68EE713180A5BF73F7C74CE00F067D2BE5CF7C SHA256=7DD78D2CBFF85A80954558C5C01986FC5D9099C87ECE796A374626EB76BE037D threat=HEUR:Trojan.Win32.Generic}] first_seen=01.04.2019 18:17 geo=ru, kz, ua, by, de, lt, ro, pl, md, it id=30341045 last_seen=23.05.2019 14:19 mask=sama-berli.info popularity=5 type=1 whois={ NS=dora.ns.cloudflare.com, zod.ns.cloudflare.com NS_ips=173.245.58.108, 173.245.59.250 country=UA created=24.01.2019 domain=sama-berli.info expires=24.01.2020 org=ZAO Sigva registrar_email=abuse@reg.ru registrar_name=Limited Liability Company "Registrar of domain names REG.RU" updated=29.03.2019} - KL_Exploit_Hash_MD5
Regular expression
Event example for checking regular expressions
category=KL_Exploit_Hash_MD5.*md5=(?<object>[^\s]*).*usrName=(?<login>[^\s]*)May 2 16:41:40 category=KL_Exploit_Hash_MD5 matchedIndicator=DAFECEDABFE0F3AB372A7C83B84CEFF6 url=- src=- ip=- md5=DAFECEDABFE0F3AB372A7C83B84CEFF6 sha1=- sha256=- usrName=- IP=104.27.174.162, 104.27.175.162, 188.166.67.166, 193.176.84.67, 185.232.23.3, 5.182.27.20, 178.128.153.190, 78.24.218.108, 158.58.172.76, 2.59.214.27 files=[{ MD5=DAFECEDABFE0F3AB372A7C83B84CEFF6 SHA1=0D68EE713180A5BF73F7C74CE00F067D2BE5CF7C SHA256=7DD78D2CBFF85A80954558C5C01986FC5D9099C87ECE796A374626EB76BE037D threat=HEUR:Trojan.Win32.Generic}] first_seen=01.04.2019 18:17 geo=ru, kz, ua, by, de, lt, ro, pl, md, it id=30341045 last_seen=23.05.2019 14:19 mask=sama-berli.info popularity=5 type=1 whois={ NS=dora.ns.cloudflare.com, zod.ns.cloudflare.com NS_ips=173.245.58.108, 173.245.59.250 country=UA created=24.01.2019 domain=sama-berli.info expires=24.01.2020 org=ZAO Sigva registrar_email=abuse@reg.ru registrar_name=Limited Liability Company "Registrar of domain names REG.RU" updated=29.03.2019} - KL_Exploit_Hash_SHA1
Regular expression
Event example for checking regular expressions
category=KL_Exploit_Hash_SHA1.*sha1=(?<object>[^\s]*).*usrName=(?<login>[^\s]*)May 2 16:41:40 category=KL_Exploit_Hash_SHA1 matchedIndicator=0D68EE713180A5BF73F7C74CE00F067D2BE5CF7C url=- src=- ip=- md5=- sha1=0D68EE713180A5BF73F7C74CE00F067D2BE5CF7C sha256=- usrName=- IP=104.27.174.162, 104.27.175.162, 188.166.67.166, 193.176.84.67, 185.232.23.3, 5.182.27.20, 178.128.153.190, 78.24.218.108, 158.58.172.76, 2.59.214.27 files=[{ MD5=DAFECEDABFE0F3AB372A7C83B84CEFF6 SHA1=0D68EE713180A5BF73F7C74CE00F067D2BE5CF7C SHA256=7DD78D2CBFF85A80954558C5C01986FC5D9099C87ECE796A374626EB76BE037D threat=HEUR:Trojan.Win32.Generic}] first_seen=01.04.2019 18:17 geo=ru, kz, ua, by, de, lt, ro, pl, md, it id=30341045 last_seen=23.05.2019 14:19 mask=sama-berli.info popularity=5 type=1 whois={ NS=dora.ns.cloudflare.com, zod.ns.cloudflare.com NS_ips=173.245.58.108, 173.245.59.250 country=UA created=24.01.2019 domain=sama-berli.info expires=24.01.2020 org=ZAO Sigva registrar_email=abuse@reg.ru registrar_name=Limited Liability Company "Registrar of domain names REG.RU" updated=29.03.2019} - KL_Exploit_Hash_SHA256
Regular expression
Event example for checking regular expressions
category=KL_Exploit_Hash_SHA256.*sha256=(?<object>[^\s]*).*usrName=(?<login>[^\s]*)May 2 16:41:40 category=KL_Exploit_Hash_SHA256 matchedIndicator=7DD78D2CBFF85A80954558C5C01986FC5D9099C87ECE796A374626EB76BE037D url=- src=- ip=- md5=- sha1=- sha256=7DD78D2CBFF85A80954558C5C01986FC5D9099C87ECE796A374626EB76BE037D usrName=- IP=104.27.174.162, 104.27.175.162, 188.166.67.166, 193.176.84.67, 185.232.23.3, 5.182.27.20, 178.128.153.190, 78.24.218.108, 158.58.172.76, 2.59.214.27 files=[{ MD5=DAFECEDABFE0F3AB372A7C83B84CEFF6 SHA1=0D68EE713180A5BF73F7C74CE00F067D2BE5CF7C SHA256=7DD78D2CBFF85A80954558C5C01986FC5D9099C87ECE796A374626EB76BE037D threat=HEUR:Trojan.Win32.Generic}] first_seen=01.04.2019 18:17 geo=ru, kz, ua, by, de, lt, ro, pl, md, it id=30341045 last_seen=23.05.2019 14:19 mask=sama-berli.info popularity=5 type=1 whois={ NS=dora.ns.cloudflare.com, zod.ns.cloudflare.com NS_ips=173.245.58.108, 173.245.59.250 country=UA created=24.01.2019 domain=sama-berli.info expires=24.01.2020 org=ZAO Sigva registrar_email=abuse@reg.ru registrar_name=Limited Liability Company "Registrar of domain names REG.RU" updated=29.03.2019} - KL_IoT_Hash_MD5
Regular expression
Event example for checking regular expressions
category=KL_IoT_Hash_MD5.*md5=(?<object>[^\s]*).*usrName=(?<login>[^\s]*)May 2 16:41:40 category=KL_IoT_Hash_MD5 matchedIndicator=DAFECEDABFE0F3AB372A7C83B84CEFF6 url=- src=- ip=- md5=DAFECEDABFE0F3AB372A7C83B84CEFF6 sha1=- sha256=- usrName=- IP=104.27.174.162, 104.27.175.162, 188.166.67.166, 193.176.84.67, 185.232.23.3, 5.182.27.20, 178.128.153.190, 78.24.218.108, 158.58.172.76, 2.59.214.27 files=[{ MD5=DAFECEDABFE0F3AB372A7C83B84CEFF6 SHA1=0D68EE713180A5BF73F7C74CE00F067D2BE5CF7C SHA256=7DD78D2CBFF85A80954558C5C01986FC5D9099C87ECE796A374626EB76BE037D threat=HEUR:Trojan.Win32.Generic}] first_seen=01.04.2019 18:17 geo=ru, kz, ua, by, de, lt, ro, pl, md, it id=30341045 last_seen=23.05.2019 14:19 mask=sama-berli.info popularity=5 type=1 whois={ NS=dora.ns.cloudflare.com, zod.ns.cloudflare.com NS_ips=173.245.58.108, 173.245.59.250 country=UA created=24.01.2019 domain=sama-berli.info expires=24.01.2020 org=ZAO Sigva registrar_email=abuse@reg.ru registrar_name=Limited Liability Company "Registrar of domain names REG.RU" updated=29.03.2019} - KL_IoT_Hash_SHA1
Regular expression
Event example for checking regular expressions
category=KL_IoT_Hash_SHA1.*sha1=(?<object>[^\s]*).*usrName=(?<login>[^\s]*)May 2 16:41:40 category=KL_IoT_Hash_MD5 matchedIndicator=0D68EE713180A5BF73F7C74CE00F067D2BE5CF7C url=- src=- ip=- md5=- sha1=0D68EE713180A5BF73F7C74CE00F067D2BE5CF7C sha256=- usrName=- IP=104.27.174.162, 104.27.175.162, 188.166.67.166, 193.176.84.67, 185.232.23.3, 5.182.27.20, 178.128.153.190, 78.24.218.108, 158.58.172.76, 2.59.214.27 files=[{ MD5=DAFECEDABFE0F3AB372A7C83B84CEFF6 SHA1=0D68EE713180A5BF73F7C74CE00F067D2BE5CF7C SHA256=7DD78D2CBFF85A80954558C5C01986FC5D9099C87ECE796A374626EB76BE037D threat=HEUR:Trojan.Win32.Generic}] first_seen=01.04.2019 18:17 geo=ru, kz, ua, by, de, lt, ro, pl, md, it id=30341045 last_seen=23.05.2019 14:19 mask=sama-berli.info popularity=5 type=1 whois={ NS=dora.ns.cloudflare.com, zod.ns.cloudflare.com NS_ips=173.245.58.108, 173.245.59.250 country=UA created=24.01.2019 domain=sama-berli.info expires=24.01.2020 org=ZAO Sigva registrar_email=abuse@reg.ru registrar_name=Limited Liability Company "Registrar of domain names REG.RU" updated=29.03.2019} - KL_IoT_Hash_SHA256
Regular expression
Event example for checking regular expressions
category=KL_IoT_URL.*url=(?<url>[^\s]*).*usrName=(?<login>[^\s]*)May 2 16:41:40 category=KL_IoT_Hash_SHA256 matchedIndicator=7DD78D2CBFF85A80954558C5C01986FC5D9099C87ECE796A374626EB76BE037D url=- src=- ip=- md5=- sha1=- sha256=7DD78D2CBFF85A80954558C5C01986FC5D9099C87ECE796A374626EB76BE037D usrName=- IP=104.27.174.162, 104.27.175.162, 188.166.67.166, 193.176.84.67, 185.232.23.3, 5.182.27.20, 178.128.153.190, 78.24.218.108, 158.58.172.76, 2.59.214.27 files=[{ MD5=DAFECEDABFE0F3AB372A7C83B84CEFF6 SHA1=0D68EE713180A5BF73F7C74CE00F067D2BE5CF7C SHA256=7DD78D2CBFF85A80954558C5C01986FC5D9099C87ECE796A374626EB76BE037D threat=HEUR:Trojan.Win32.Generic}] first_seen=01.04.2019 18:17 geo=ru, kz, ua, by, de, lt, ro, pl, md, it id=30341045 last_seen=23.05.2019 14:19 mask=sama-berli.info popularity=5 type=1 whois={ NS=dora.ns.cloudflare.com, zod.ns.cloudflare.com NS_ips=173.245.58.108, 173.245.59.250 country=UA created=24.01.2019 domain=sama-berli.info expires=24.01.2020 org=ZAO Sigva registrar_email=abuse@reg.ru registrar_name=Limited Liability Company "Registrar of domain names REG.RU" updated=29.03.2019} - KL_IoT_URL
Regular expression
Event example for checking regular expressions
category=KL_IoT_Hash_SHA256.*sha256=(?<object>[^\s]*).*usrName=(?<login>[^\s]*)May 2 16:41:40 category=KL_IoT_URL matchedIndicator=fakess123r.nu url=fakess123r.nu src=192.168.0.0 ip=- md5=- sha1=- sha256=- usrName=VerifTestUserName first_seen=10.08.2016 14:18 id=0 last_seen=22.12.2017 15:12 mask=fakess123r.nu popularity=1 type=1 - KL_Vulnerable_File_Hash_MD5
Regular expression
Event example for checking regular expressions
category=KL_Vulnerable_File_Hash_MD5.*md5=(?<object>[^\s]*).*usrName=(?<login>[^\s]*)May 2 16:41:40 category=KL_Vulnerable_File_Hash_MD5 matchedIndicator=DAFECEDABFE0F3AB372A7C83B84CEFF6 url=- src=- ip=- md5=DAFECEDABFE0F3AB372A7C83B84CEFF6 sha1=- sha256=- usrName=- IP=104.27.174.162, 104.27.175.162, 188.166.67.166, 193.176.84.67, 185.232.23.3, 5.182.27.20, 178.128.153.190, 78.24.218.108, 158.58.172.76, 2.59.214.27 files=[{ MD5=DAFECEDABFE0F3AB372A7C83B84CEFF6 SHA1=0D68EE713180A5BF73F7C74CE00F067D2BE5CF7C SHA256=7DD78D2CBFF85A80954558C5C01986FC5D9099C87ECE796A374626EB76BE037D threat=HEUR:Trojan.Win32.Generic}] first_seen=01.04.2019 18:17 geo=ru, kz, ua, by, de, lt, ro, pl, md, it id=30341045 last_seen=23.05.2019 14:19 mask=sama-berli.info popularity=5 type=1 whois={ NS=dora.ns.cloudflare.com, zod.ns.cloudflare.com NS_ips=173.245.58.108, 173.245.59.250 country=UA created=24.01.2019 domain=sama-berli.info expires=24.01.2020 org=ZAO Sigva registrar_email=abuse@reg.ru registrar_name=Limited Liability Company "Registrar of domain names REG.RU" updated=29.03.2019} - KL_Vulnerable_File_Hash_SHA1
Regular expression
Event example for checking regular expressions
category=KL_Vulnerable_File_Hash_SHA1.*sha1=(?<object>[^\s]*).*usrName=(?<login>[^\s]*)May 2 16:41:40 category=KL_Vulnerable_File_Hash_SHA1 matchedIndicator=0D68EE713180A5BF73F7C74CE00F067D2BE5CF7C url=- src=- ip=- md5=- sha1=0D68EE713180A5BF73F7C74CE00F067D2BE5CF7C sha256=- usrName=- IP=104.27.174.162, 104.27.175.162, 188.166.67.166, 193.176.84.67, 185.232.23.3, 5.182.27.20, 178.128.153.190, 78.24.218.108, 158.58.172.76, 2.59.214.27 files=[{ MD5=DAFECEDABFE0F3AB372A7C83B84CEFF6 SHA1=0D68EE713180A5BF73F7C74CE00F067D2BE5CF7C SHA256=7DD78D2CBFF85A80954558C5C01986FC5D9099C87ECE796A374626EB76BE037D threat=HEUR:Trojan.Win32.Generic}] first_seen=01.04.2019 18:17 geo=ru, kz, ua, by, de, lt, ro, pl, md, it id=30341045 last_seen=23.05.2019 14:19 mask=sama-berli.info popularity=5 type=1 whois={ NS=dora.ns.cloudflare.com, zod.ns.cloudflare.com NS_ips=173.245.58.108, 173.245.59.250 country=UA created=24.01.2019 domain=sama-berli.info expires=24.01.2020 org=ZAO Sigva registrar_email=abuse@reg.ru registrar_name=Limited Liability Company "Registrar of domain names REG.RU" updated=29.03.2019} - KL_Vulnerable_File_Hash_SHA256
Regular expression
Event example for checking regular expressions
category=KL_Vulnerable_File_Hash_SHA256.*sha256=(?<object>[^\s]*).*usrName=(?<login>[^\s]*)May 2 16:41:40 category= KL_Vulnerable_File_Hash_SHA256 matchedIndicator=7DD78D2CBFF85A80954558C5C01986FC5D9099C87ECE796A374626EB76BE037D url=- src=- ip=- md5=- sha1=- sha256=7DD78D2CBFF85A80954558C5C01986FC5D9099C87ECE796A374626EB76BE037D usrName=- IP=104.27.174.162, 104.27.175.162, 188.166.67.166, 193.176.84.67, 185.232.23.3, 5.182.27.20, 178.128.153.190, 78.24.218.108, 158.58.172.76, 2.59.214.27 files=[{ MD5=DAFECEDABFE0F3AB372A7C83B84CEFF6 SHA1=0D68EE713180A5BF73F7C74CE00F067D2BE5CF7C SHA256=7DD78D2CBFF85A80954558C5C01986FC5D9099C87ECE796A374626EB76BE037D threat=HEUR:Trojan.Win32.Generic}] first_seen=01.04.2019 18:17 geo=ru, kz, ua, by, de, lt, ro, pl, md, it id=30341045 last_seen=23.05.2019 14:19 mask=sama-berli.info popularity=5 type=1 whois={ NS=dora.ns.cloudflare.com, zod.ns.cloudflare.com NS_ips=173.245.58.108, 173.245.59.250 country=UA created=24.01.2019 domain=sama-berli.info expires=24.01.2020 org=ZAO Sigva registrar_email=abuse@reg.ru registrar_name=Limited Liability Company "Registrar of domain names REG.RU" updated=29.03.2019}
Step 5. Adding Kaspersky CyberTrace policy
This section describes how you can add a Kaspersky CyberTrace policy to LogRhythm.
To add a Kaspersky CyberTrace policy to LogRhythm:
- Run LogRhythm Console.
- Select Deployment Manager > Log Processing Policies.
- Click the New button ().
The Log Source Type Selector window opens.
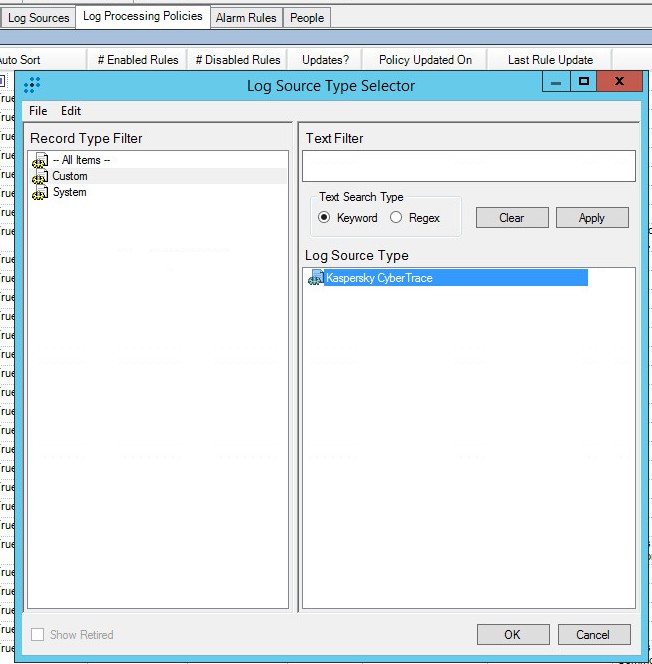
Log Source Type Selector window
- In the Log Source Type list, select Kaspersky CyberTrace.
- Click OK.
- In the MPE Policy Editor window that opens, in the Name field, type the policy name (
CyberTrace Policy).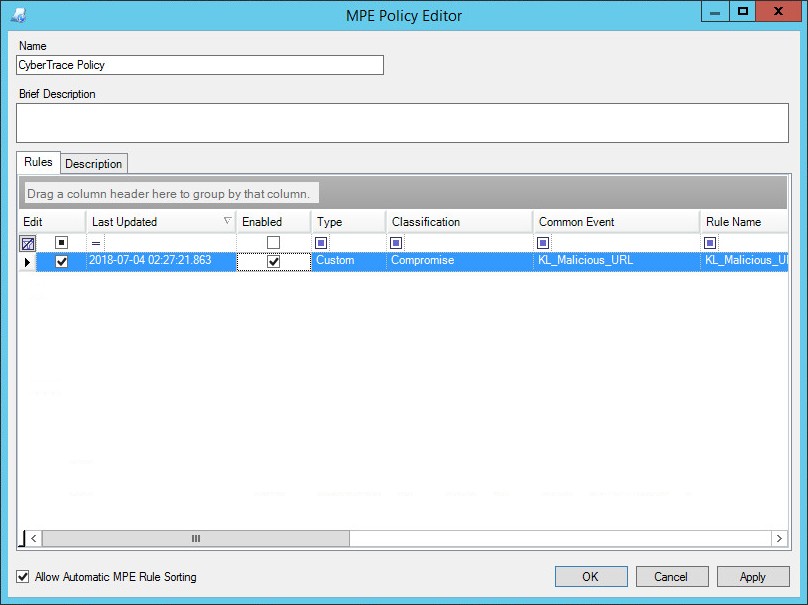
MPE Policy Editor window
- On the Rules tab, edit the properties of the Kaspersky CyberTrace events:
- Select all the check boxes for every event.
- Right-click in the table and select Properties.
The MPE Policy Rule Editor window opens.
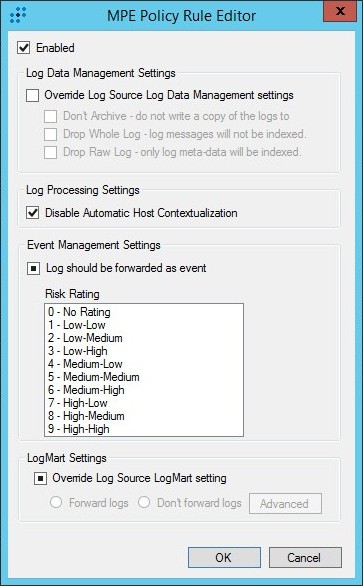
MPE Policy Rule Editor window
- In the MPE Policy Rule Editor window, select the Enabled check box but make no changes to the other check boxes.
- Click OK.
Step 6. Adding a log source to System Monitor Agent
This section describes the actions to perform so that a new log source pertaining to Kaspersky CyberTrace will appear in LogRhythm. If LogRhythm is already configured properly, you do not need to take action, as the new log source will appear in LogRhythm and you only have to check that everything is as you specified.
To create conditions for a log source pertaining to Kaspersky CyberTrace to be added to LogRhythm:
- Run LogRhythm Console.
- Select Deployment Manager > System Monitors > Agent > Properties.
The System Monitor Agent Properties window opens.
- Select the Syslog and Flow Settings tab.
- Select the Enable Syslog Server checkbox.
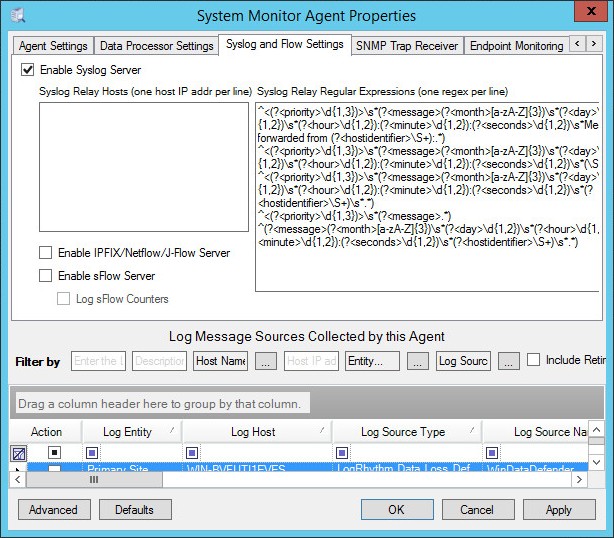
System Monitor Agent Properties window
- Click OK.
- Turn off Windows Firewall or add exclusions to it so that incoming SYSLOG events can arrive.
- Select Deployment Manager > Data Processors > Properties > Advanced.
The Data Processor Advanced Properties window opens.
- In the table, select the following items. Property names are in the Name column and the Value column contains the checkboxes to be selected:
- AutomaticLogSourceConfigurationNetFlow
- AutomaticLogSourceConfigurationsFlow
- AutomaticLogSourceConfigurationSNMPTrap
- AutomaticLogSourceConfigurationSyslog
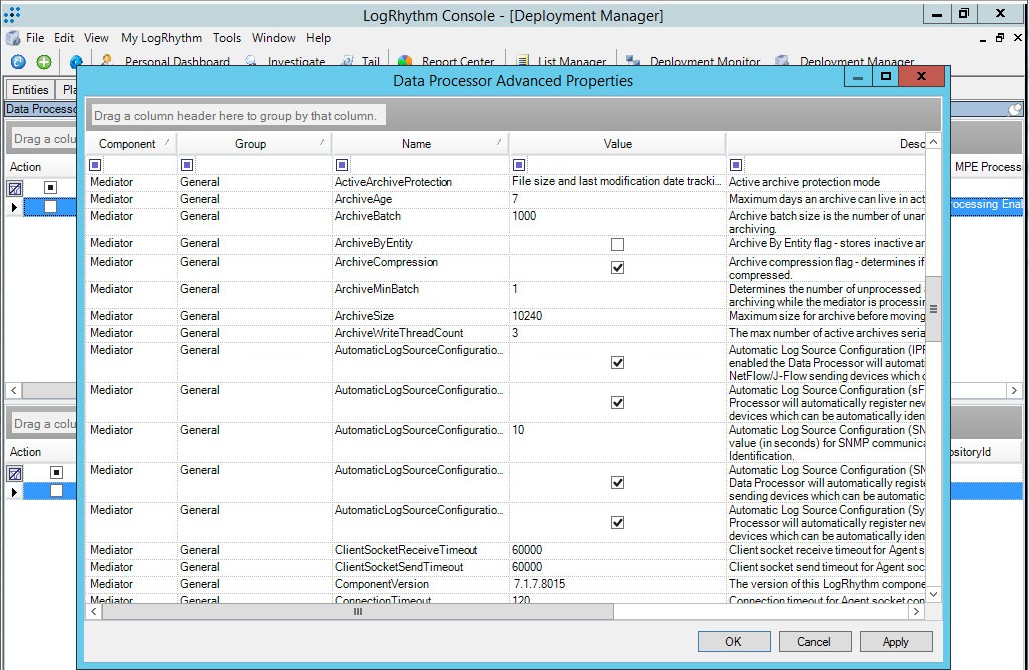
Data Processor Advanced Properties window
- Click OK.
- Restart LogRhythm if necessary.
LogRhythm will inform you whether a restart is required.
After Kaspersky CyberTrace sends an event, a new item appears on the Log Sources tab.
To accept the new log source:
- Right-click the new item, and then select Actions > Resolve Log Source Hosts.
- Double-click the new item.
The Log Source Acceptance Properties window opens.
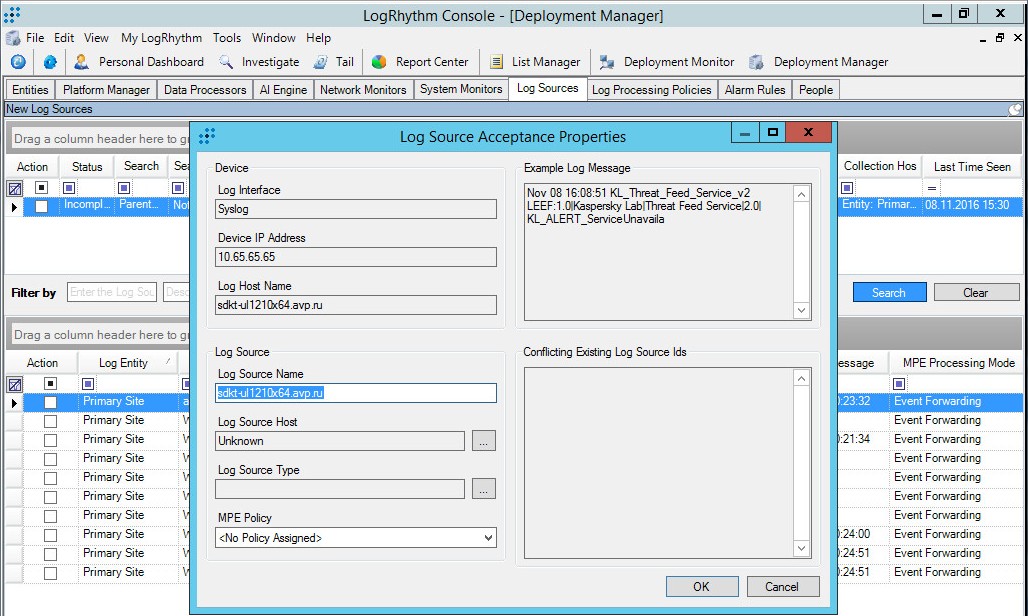
Log Source Acceptance Properties window
- Edit the properties:
- Specify the log source host.
- Specify
Kaspersky CyberTraceas the log source type. - Specify the MPE policy that you added in step 4.
- Click OK.
- If an error message appears saying that you cannot use an unknown log source host, add a new entity as follows:
- In LogRhythm Console, select the Entities tab.
- Click the New Child Entity toolbar button.
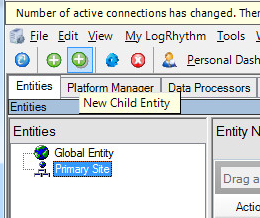
- In the Entity Properties window that opens, specify the entity properties.
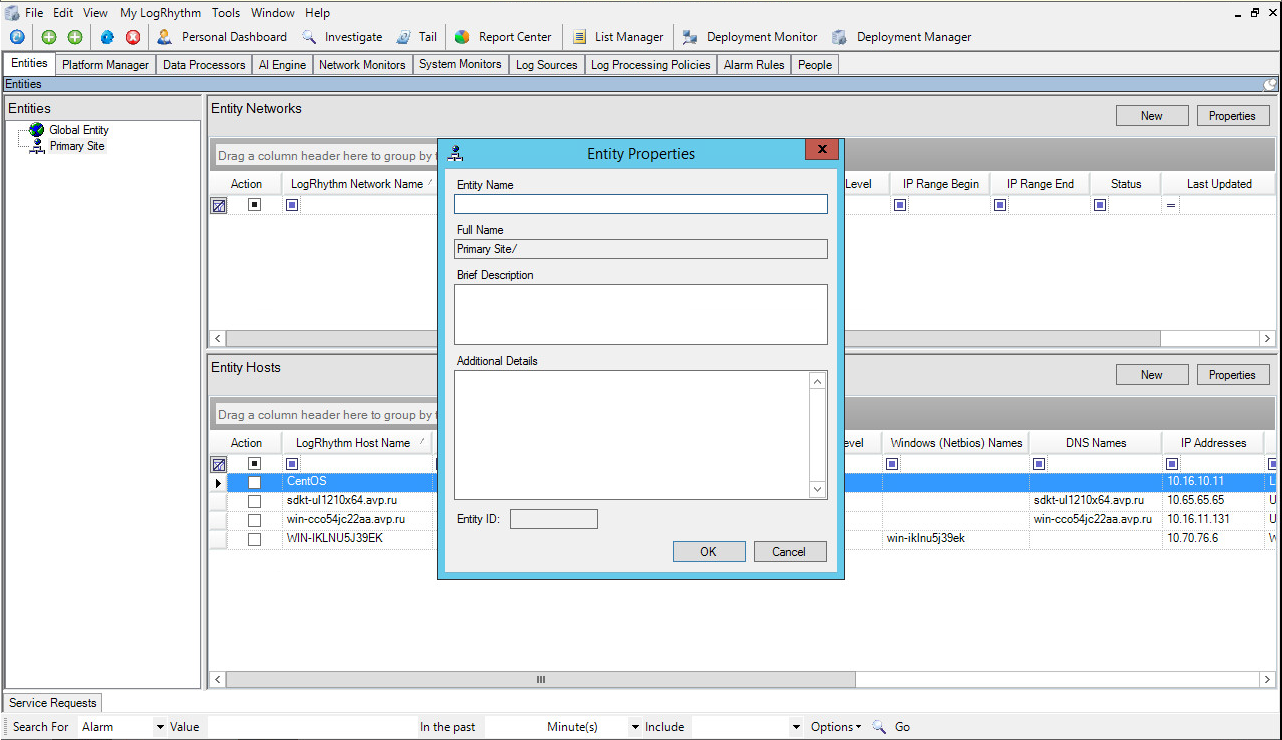
The entity name must be unique and non-empty. Other entity properties can be arbitrary.
- Click OK.
- Repeat the action in step 3 by using the created entity as the log source host.
- Select the Action checkbox.
- Right-click the log source, and then select Actions > Accept > Defaults.
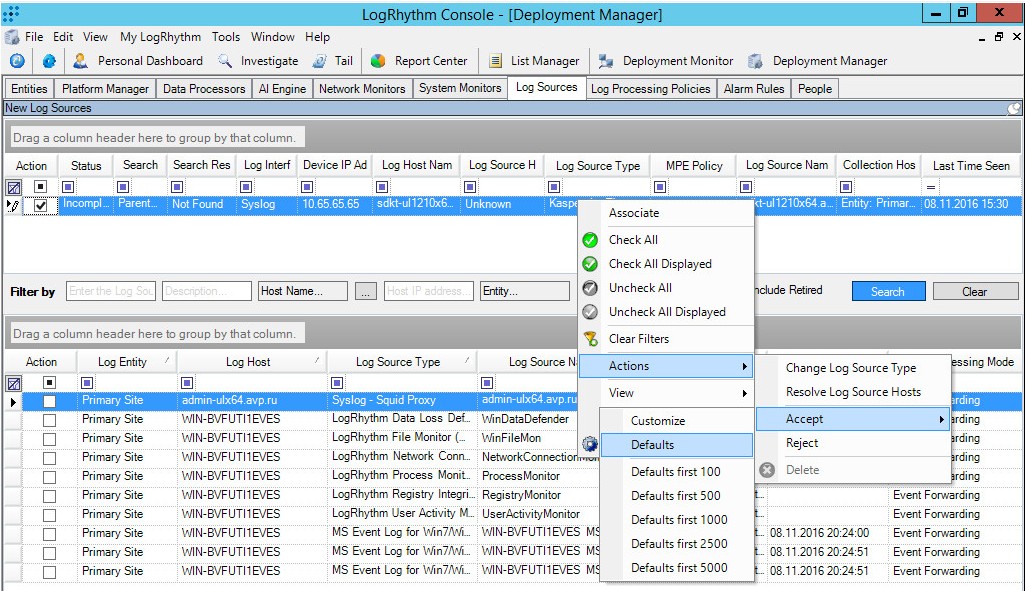
Log source context menu
The new log source now appears in the lower table in LogRhythm Console.
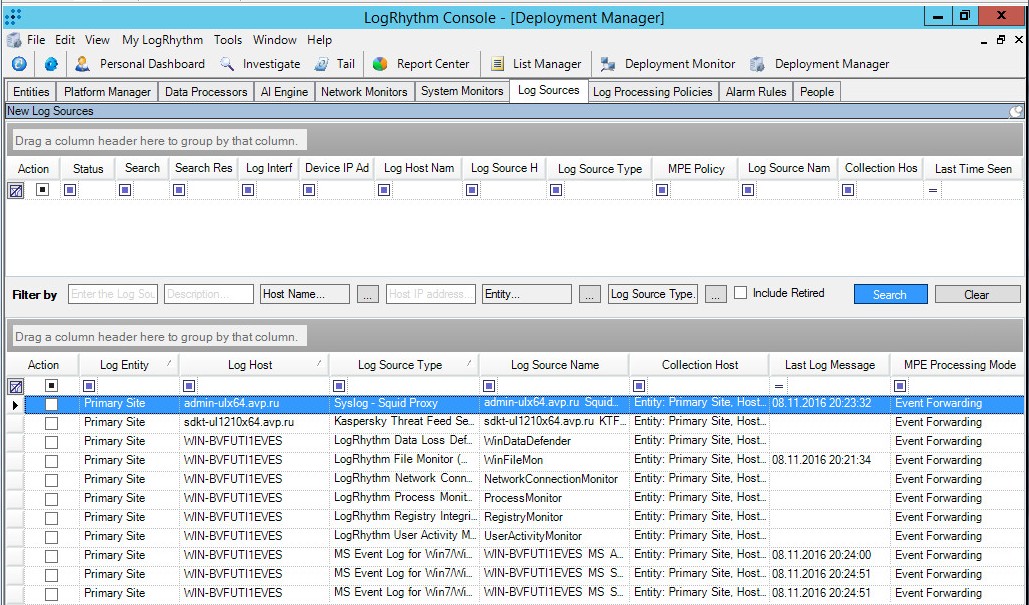
New log source
Disabling log forwarding for the events received from Kaspersky CyberTrace
You may need to disable log forwarding for the events received from Kaspersky CyberTrace, to avoid the looping of events, which is forwarding the received events back to Kaspersky CyberTrace.
To disable log forwarding for the events received from Kaspersky CyberTrace:
- On the Log Sources tab, select the checkbox of the log source associated with Kaspersky CyberTrace.
- Right-click the log source, and then select Actions > Edit properties.
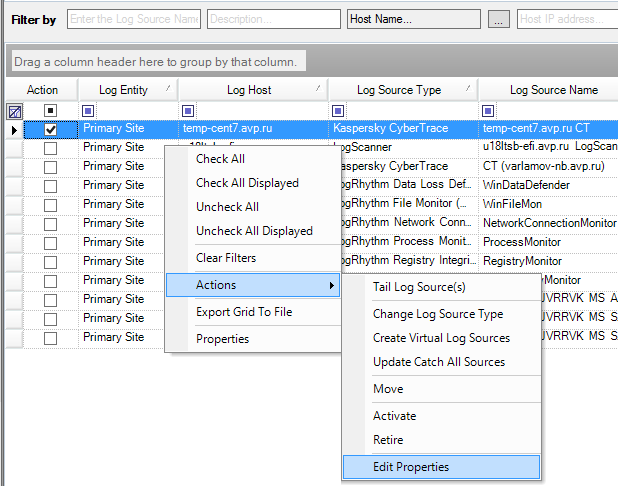
Editing the properties of the Kaspersky CyberTrace log source
- The Log Message Source Properties window opens. In the Log Message Processing Mode drop-down list, select MPE Processing Enabled, Event Forwarding Disabled, and then click OK.
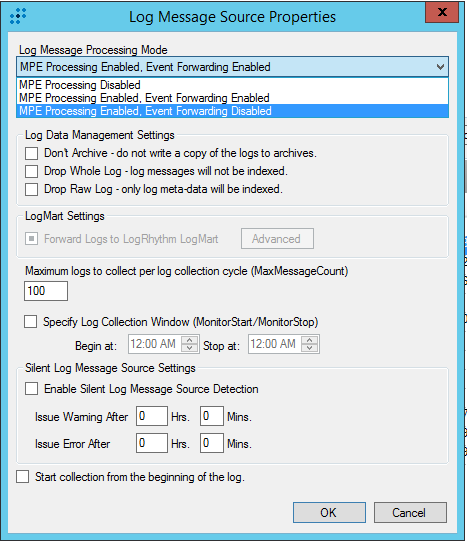
Specifying the log message processing mode
In the MPE Processing Mode column, No Event Forwarding will be displayed for the selected log source.
The MPE Processing Mode column
Page topStep 7. Configuring log forwarding to Kaspersky CyberTrace
This section explains how to configure LogRhythm to forward logs to Kaspersky CyberTrace. Configuring LogRhythm includes adding a log receiver and adding a log distribution pollicy.
Adding a log receiver
In LogRhythm, create a new log receiver. This log receiver will represent Kaspersky CyberTrace.
To add a log receiver to LogRhythm:
- Run LogRhythm Console.
- Select Deployment Manager > Tools > Distribution > Log Distribution Services > Receiver Manager.
The Log Distribution Receiver Manager window opens.
- Select File > New.
- Fill in the fields of the Syslog Receiver Properties window that opens:
- Specify the IP address of the remote host on which Kaspersky CyberTrace is installed (the IP address specified in the
InputSettings > ConnectionStringelement of the Feed Service configuration file). - Specify the remote port that Kaspersky CyberTrace listens on for events (the port specified in the
InputSettings > ConnectionStringelement of the Feed Service configuration file). - Change Network Protocol to TCP.
- Specify the IP address of the remote host on which Kaspersky CyberTrace is installed (the IP address specified in the
- Click OK.
- After a new row appears in the table, right-click the row and select Enabled.
Adding a log distribution policy
After the log receiver is added, set the conditions by adding a log distribution policy for events to be forwarded to Kaspersky CyberTrace.
To add a log distribution policy:
- Select Deployment Manager > Tools > Distribution > Log Distribution Services > Policy Manager.
- In the Log Distribution Policy Manager window that opens, select File > New.
The Log Distribution Policy Wizard starts.
- Follow the instructions of the Wizard.
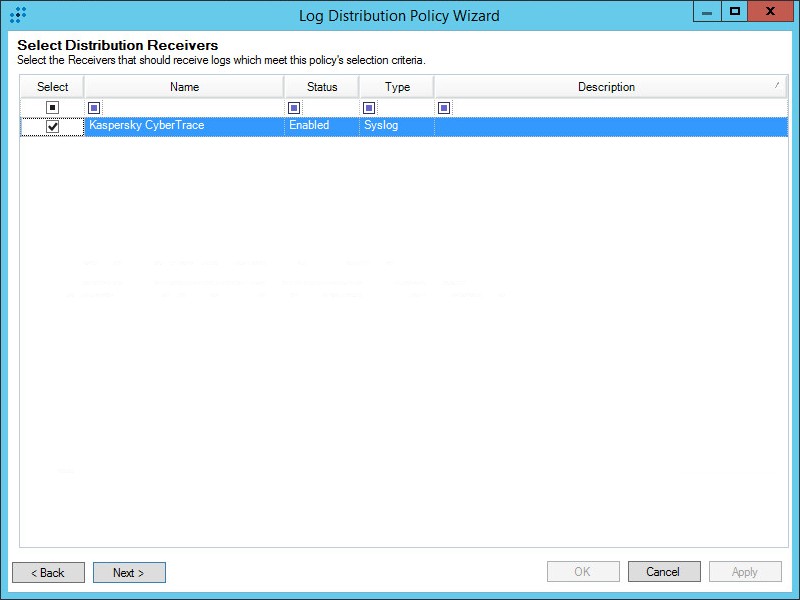
Log Distribution Policy Wizard
- In the Select Distribution Receivers table, select the
Kaspersky CyberTraceitem that was created previously. - Select the log sources that can send URLs, hashes, and IP addresses.
After the Log Distribution Policy Wizard finishes, the new row appears in the table.
- In the Select Distribution Receivers table, select the
- Right-click the new row in the table and select Enabled.
The computer on which Kaspersky CyberTrace is installed will now receive logs. You can check this by using the netcat utility.
Displaying detection events in LogRhythm
As a result of the above actions, LogRhythm will receive and display detection events. Also, the events will appear in the web console, which is available at https://<logrhythmIP>:8443 or at https://<logrhythmIP>:80.
Step 8 (optional). Performing the verification test
This section explains how to verify that Kaspersky CyberTrace has been integrated with LogRhythm correctly by performing the verification test.
To create the conditions for performing the verification test:
- Create a custom log source type, as described in section "Step 1. Adding a Custom Log Source type", with the following parameters:
Field
Data
Name
Kaspersky LogScanner
Full Name
Kaspersky LogScanner
Abbreviation
LogScanner
Log Format
Syslog
Brief Description
Kaspersky LogScanner is a command-line application that allows you to send data to Feed Service for checking against feeds.
- Add a new common event, as described in section "Step 3 (optional). Adding Kaspersky CyberTrace events", with the following parameters:
Field
Data
Name
LogScanner_event
Classification
Audit : Other Audit
Brief Description
LogScanner event for verification purposes
Risk Rating
Low-Low
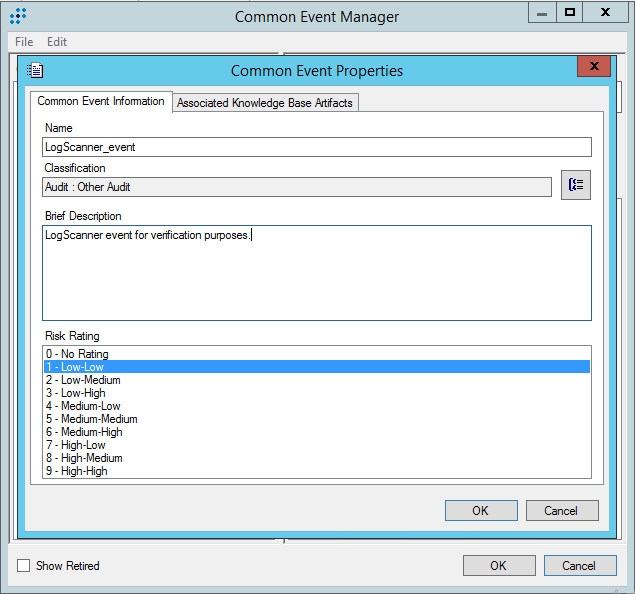
Common Event Properties window
- Add an MPE rule for Log Scanner, as described in section "Step 4 (optional). Adding Kaspersky CyberTrace rules", using the following parameters:
- In the Log Message Source Type Associations tree pane, select Kaspersky LogScanner.
- Specify
LogScanner_eventas the Rule Name. - In the Common Event drop-down list, select LogScanner_event.
- In Rule Status, select Production.
- In Base-Rule Regular Expression, type '
.*'.
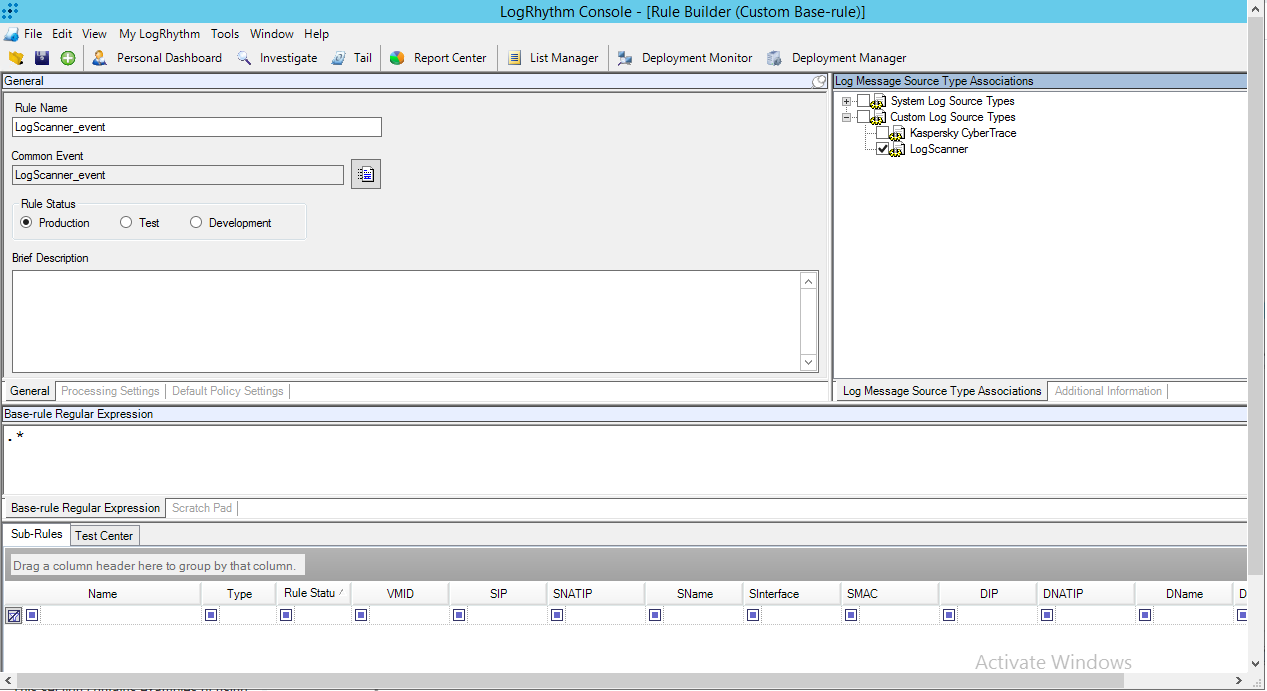
Rule builder form
- Create a new policy for Kaspersky Log Scanner, as described in section "Step 5. Adding Kaspersky CyberTrace policy".
In the Log Source Type list, select Kaspersky LogScanner. Specify all other parameters, as described in section "Step 5. Adding Kaspersky CyberTrace policy".
- Add a log source to System Monitor Agent:
- In the Log Scanner configuration file, specify the IP address of the computer on which LogRhythm runs and port
514. - Send the
%service_dir%/verification/kl_verification_test_cef.txtfile to LogRhythm.- For this purpose, run the following command (in Linux):
./log_scanner -p ../verification/kl_verification_test_cef.txt - For this purpose, run the following command (in Windows):
log_scanner.exe -p ..\verification\kl_verification_test_cef.txt
- For this purpose, run the following command (in Linux):
- In the Log Scanner configuration file, specify the IP address of the computer on which LogRhythm runs and port
After Kaspersky Log Scanner sends an event, a new item will appear on the Log Sources tab.
To accept the new log source:
- Right-click the new item, and then select Actions > Resolve Log Source Hosts.
- Double-click the new item.
The Log Source Acceptance Properties window opens.
Log Source Acceptance Properties window
- Edit the properties:
- Specify the log source host.
- Specify
Kaspersky LogScanneras the log source type. - Select the MPE policy that you previously created for Kaspersky Log Scanner.
- Click OK.
- If an error message appears saying that you cannot use an unknown log source host, add a new entity as follows:
- In LogRhythm Console, select the Entities tab.
- Click the New Child Entity toolbar button.
- In the Entity Properties window that opens, specify the entity properties.
The entity name must be unique and non-empty. Other entity properties can be arbitrary.
- Click OK.
- Repeat the action in step 3 by using the created entity as the log source host.
- Select the Action check box.
- Right-click the log source, and then select Actions > Accept > Defaults.
Log source context menu
The new log source now appears in the lower table in LogRhythm Console.
New log source
- Reload LogRhythm.
If you have previously configured log forwarding, as described in section "Step 7. Configuring log forwarding to Kaspersky CyberTrace", make sure that you have Kaspersky LogScanner selected as a Log source (see subsection "Adding a log distribution policy").
To perform the verification test:
Resend the %service_dir%/verification/kl_verification_test_cef.txt file to LogRhythm.
- For this purpose, run the following command (in Linux):
./log_scanner -p ../verification/kl_verification_test_cef.txt - For this purpose, run the following command (in Windows):
log_scanner.exe -p ..\verification\kl_verification_test_cef.txt
If the integration of Kaspersky CyberTrace with LogRhythm has been configured properly, test events from Log Scanner will be forwarded to Kaspersky CyberTrace automatically. Then, the alert events from Kaspersky CyberTrace will be sent to LogRhythm. The number of detections may vary depending on enabled Kaspersky Threat Data Feeds. The alert events can be displayed in the LogRhythm web console, as described in section "Step 10 (optional). Displaying alert events in LogRhythm".
Page topStep 9 (optional). Creating alerts about incoming Kaspersky CyberTrace service events
You can create notifications about incoming Kaspersky CyberTrace service events by configuring alert rules.
To create notifications about service events from Kaspersky CyberTrace in LogRhythm:
- Run LogRhythm Console.
- Select Deployment Manager > Alarm Rules and click New.
- In the Create Global Rule confirmation window, click Yes if you want to give access to manage this rule for all users with the Global Admin role. Click No, if you want to manage this rule only by yourself.
- Perform the following actions for each tab at the bottom of the page:
- On the Primary Criteria tab, do the following:
- Click New, and select the Common Event value in the Add New Field Filter drop-down list.
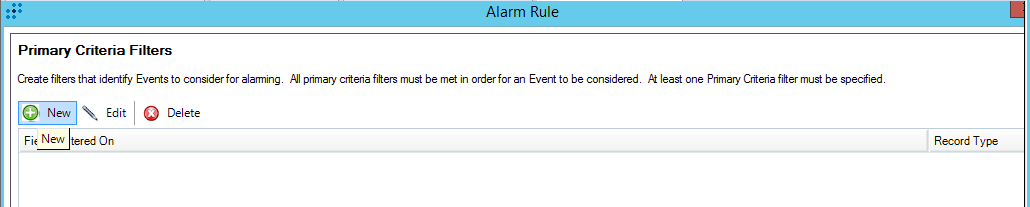
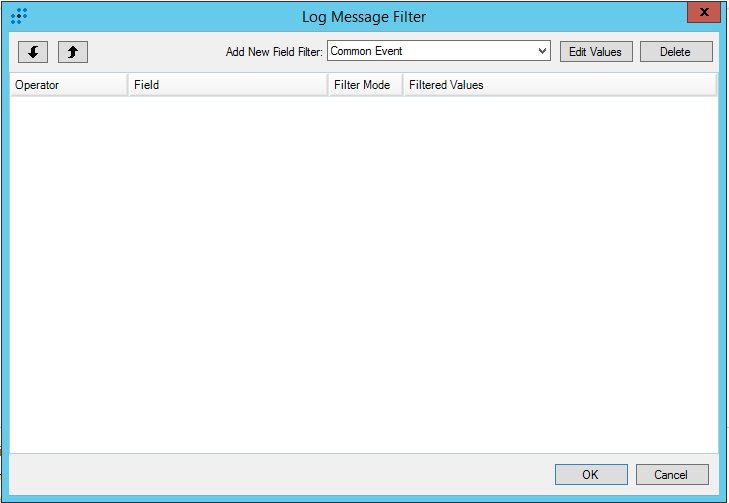
- Click Edit values.
The Field Filter Values window opens.
- In the Field Filter Values window, click Add Item.
- Select the name of the Kaspersky CyberTrace service event from the list. If such events are absent, add them as described in the "Adding Kaspersky CyberTrace events" section.
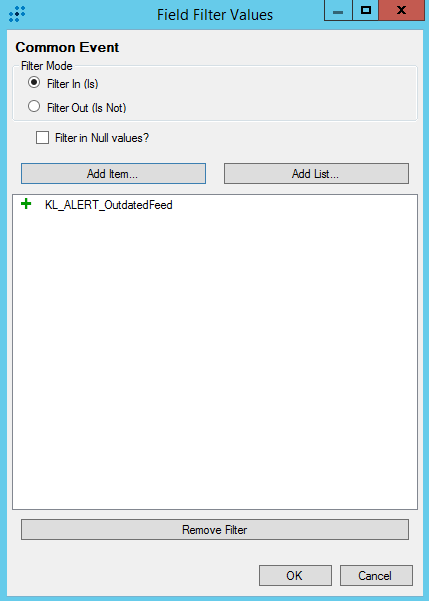
- Click OK.
- Click New, and select the Common Event value in the Add New Field Filter drop-down list.
- Leave the Include Filters, Exclude Filters and Day and Time Criteria tabs unchanged.
- On the Log Source Criteria tab, check Include the Selected Log Sources and then click Add.
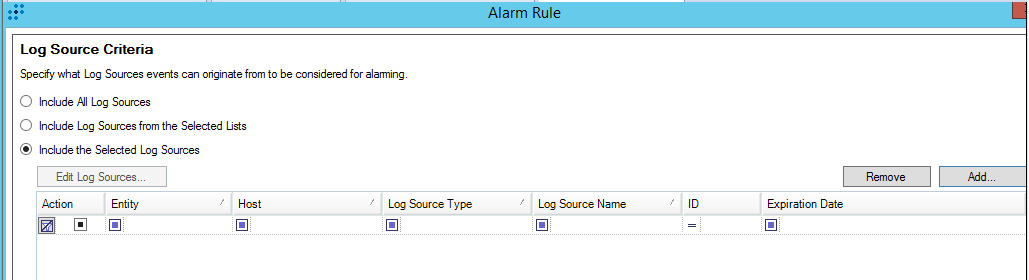
The Alarm Rule window
- Select a source that corresponds to Kaspersky CyberTrace and click OK. For information on how to add Kaspersky CyberTrace event source, see section "Adding a log source to System Monitor Agent".
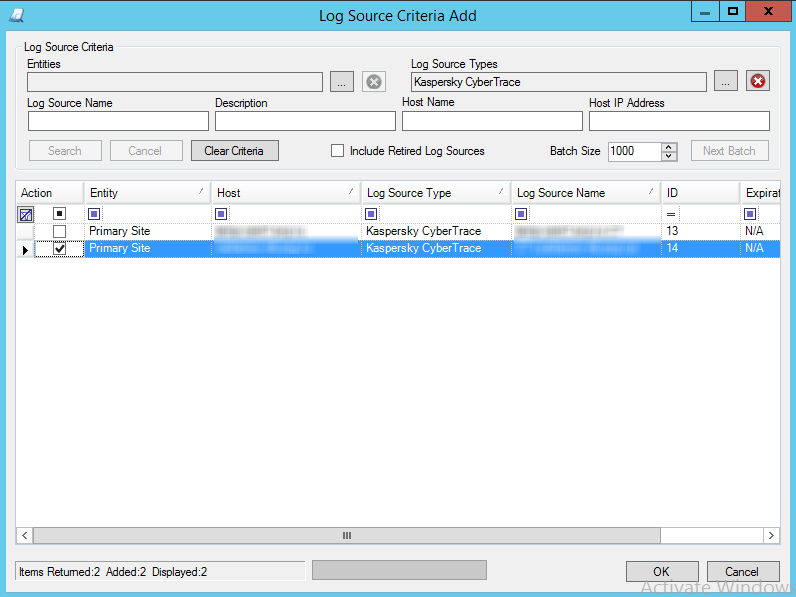
The Log Source Criteria Add window
- Leave the Aggregation tab unchanged.
- In the Settings tab, specify a period of time during which identical alerts that are associated with the occurrence of any new service events from Kaspersky CyberTrace have to be suppressed.
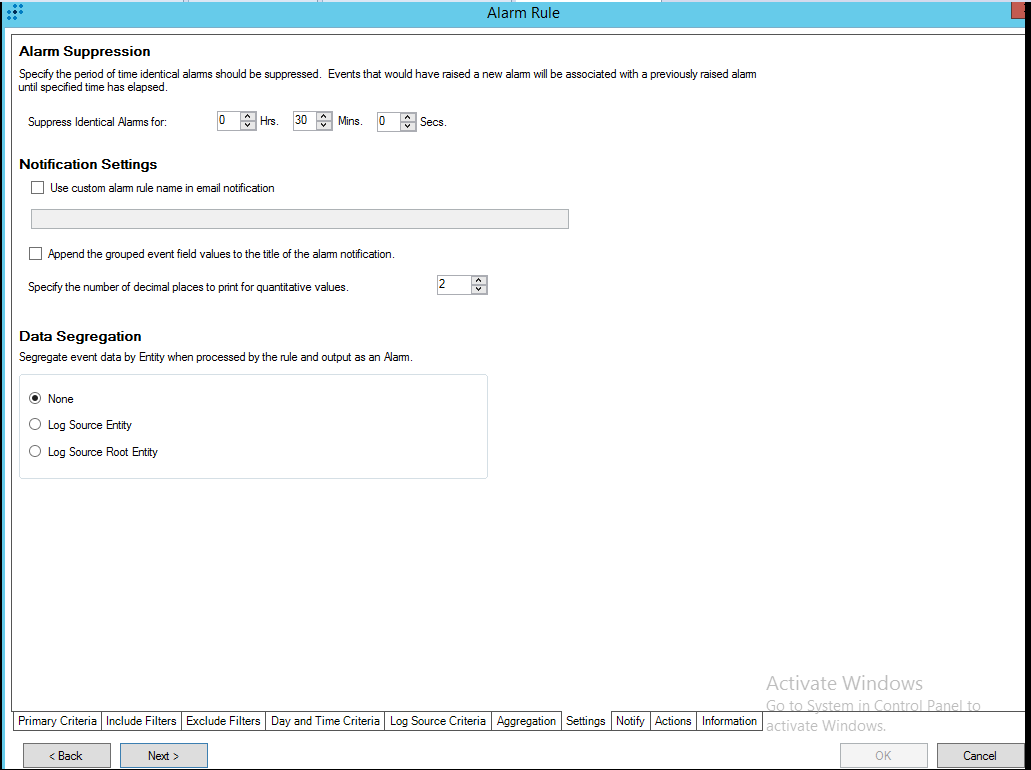
Alert suppression settings
- On the Notify tab, select a role or user you want to address notifications.
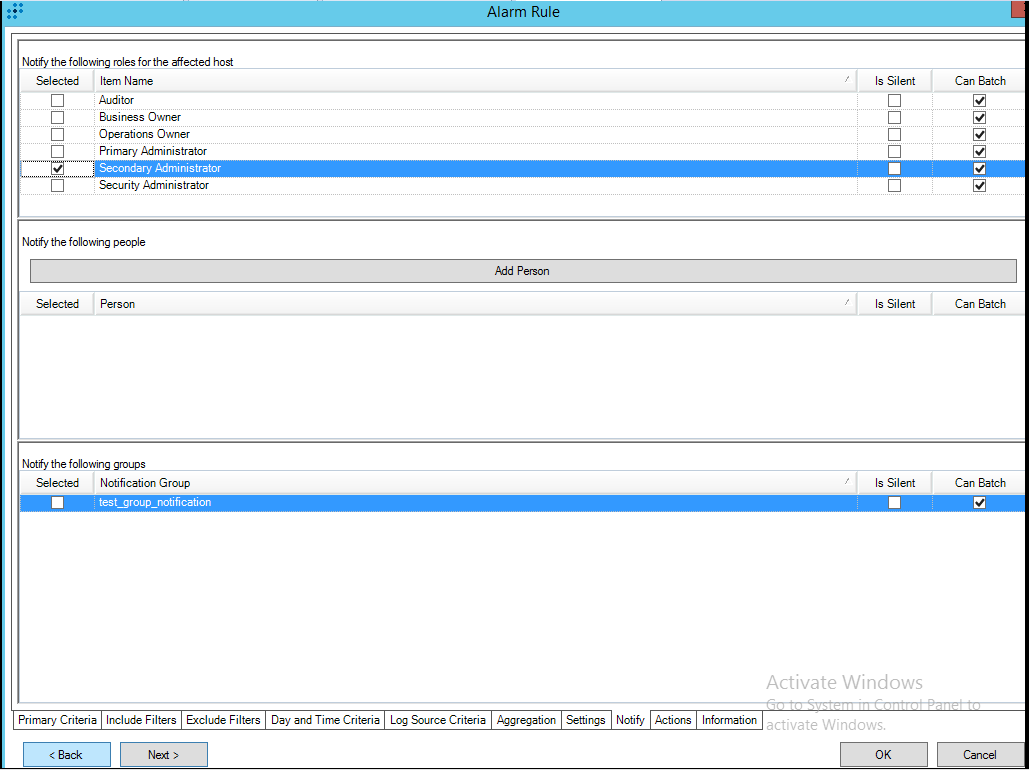
Choosing the roles to notificate
- Leave the Actions tab unchanged.
- On the Information tab, specify the name of the rule and its description.
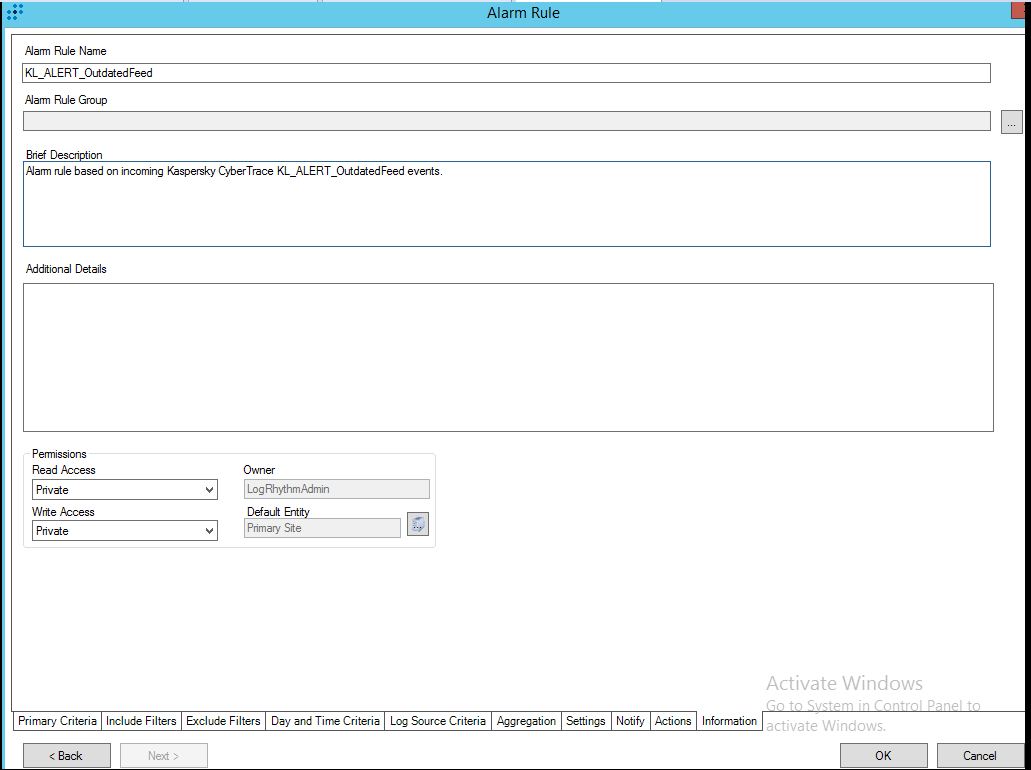
Alarm Rule Name/Brief Description
- On the Primary Criteria tab, do the following:
- Click OK.
- On the Alarm Rules tab, right-click the new rule and select Actions > Enable.
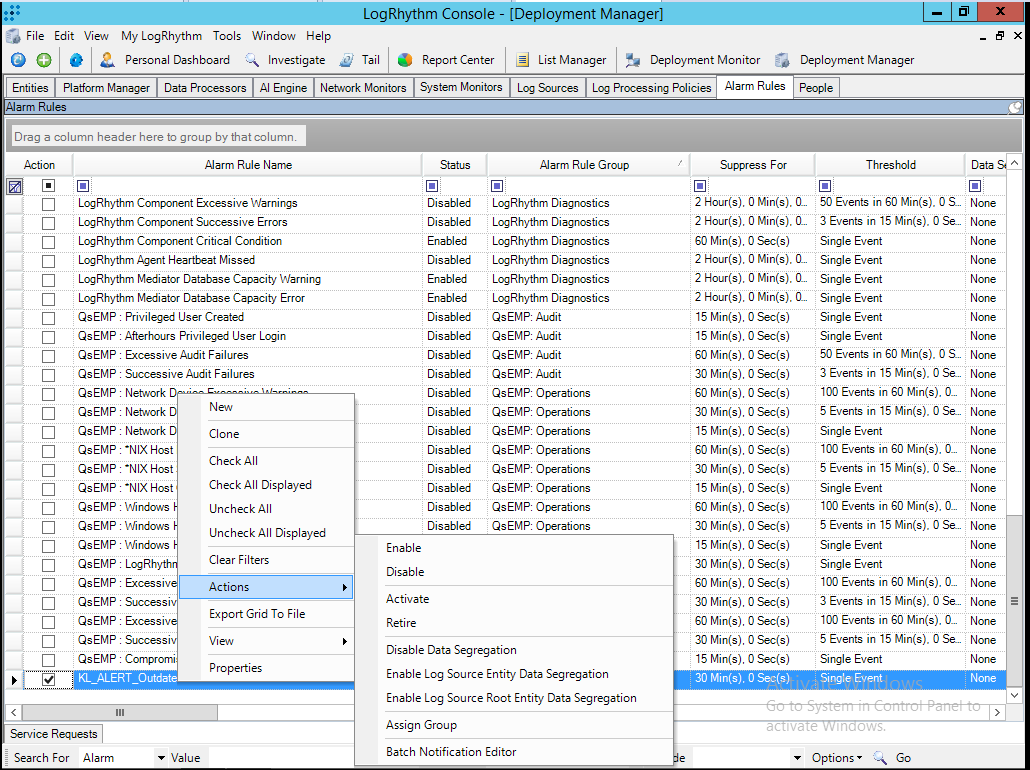
Enabling a rule
- Configure display of the alerts in the LogRhythm web console as described in section "Step 10 (optional). Displaying alert events in LogRhythm".
Step 10 (optional). Displaying alert events in LogRhythm
You can configure the LogRhythm web console so that it will display alert events together with detection events.
To configure the web console for displaying alert events:
- In the web console, click Search.
- Click Log Source Filter.
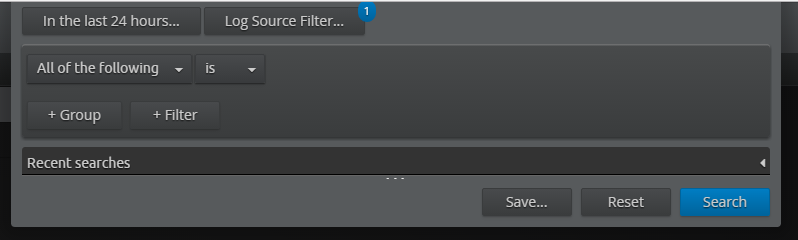
Search form
- Type
CyberTraceas the search string. - Move the search filter that is found to the right column by clicking the arrow (+).
- Click OK.
- After a new search has finished, open the result window.
The LogRhythm web console will display detection events together with alert events in the search result window.
Page topIntegration with KUMA
Kaspersky Unified Monitoring and Analysis Platform (KUMA) is a SIEM solution developed by Kaspersky that provides real-time analysis of security events generated by any data source, such as applications or network hardware.
For information on how to configure KUMA for integration with Kaspersky CyberTrace, see Kaspersky Unified Monitoring and Analysis Platform Online Help.
Page topIntegrating with other SIEM and non-SIEM solutions
This section describes how to check your data against feeds if you do not use a SIEM solution or use a solution that is not yet supported by CyberTrace.
You can check your data against feeds using Log Scanner.
Performing the verification test (other SIEM and non-SIEM solutions)
The Kaspersky CyberTrace distribution kit contains text files in the verification directory. You can use these files for testing whether Kaspersky CyberTrace is integrated correctly with the event target software.
To check the integration of Kaspersky CyberTrace with the event target software:
- Send the
kl_verification_test_cef.txtfile from theverificationdirectory to Feed Service by using Log Scanner.In Linux:
./log_scanner -p ../verification/kl_verification_test_cef.txtIn Windows:
log_scanner.exe -p ..\verification\kl_verification_test_cef.txtFeed Service will check the data that is contained in the input file.
If you specify the
-rflag in this command, the test results are written to the Log Scanner report file. If you do not specify the-rflag, the test results are sent to the event target software by using the parameters for outbound events specified in the Service settings of Kaspersky CyberTrace. - Make sure that the event target software has received events according to the table below.
Verification test results
The verification test results depends on the feeds you use. The following table summarizes target numbers for the verification test when all commercial feeds are used.
Verification test results (commercial feeds)
Feed used |
eventName value |
Detected objects |
Malicious URL Data Feed |
KL_Malicious_URL |
http://fakess123.nu http://badb86360457963b90faac9ae17578ed.com |
Phishing URL Data Feed |
KL_Phishing_URL |
http://fakess123ap.nu http://e77716a952f640b42e4371759a661663.com |
Botnet CnC URL Data Feed |
KL_BotnetCnC_URL |
http://fakess123bn.nu http://a7396d61caffe18a4cffbb3b428c9b60.com |
IP Reputation Data Feed |
KL_IP_Reputation |
192.0.2.0 192.0.2.3 |
Malicious Hash Data Feed |
KL_Malicious_Hash_MD5 |
FEAF2058298C1E174C2B79AFFC7CF4DF 44D88612FEA8A8F36DE82E1278ABB02F C912705B4BBB14EC7E78FA8B370532C9 |
Mobile Malicious Hash Data Feed |
KL_Mobile_Malicious_Hash_MD5 |
60300A92E1D0A55C7FDD360EE40A9DC1 |
Mobile Botnet CnC URL Data Feed |
KL_Mobile_BotnetCnC_Hash_MD5 |
001F6251169E6916C455495050A3FB8D |
Mobile Botnet CnC URL Data Feed |
KL_Mobile_BotnetCnC_URL |
http://sdfed7233dsfg93acvbhl.su/steallallsms.php |
Ransomware URL Data Feed |
KL_Ransomware_URL |
http://fakess123r.nu http://fa7830b4811fbef1b187913665e6733c.com |
Vulnerability Data Feed |
KL_Vulnerable_File_Hash_MD5 |
D8C1F5B4AD32296649FF46027177C594 |
APT URL Data Feed |
KL_APT_URL |
http://b046f5b25458638f6705d53539c79f62.com |
APT Hash Data Feed |
KL_APT_Hash_MD5 |
7A2E65A0F70EE0615EC0CA34240CF082 |
APT IP Data Feed |
KL_APT_IP |
192.0.2.4 |
IoT URL Data Feed |
KL_IoT_URL |
http://e593461621ee0f9134c632d00bf108fd.com/.i |
ICS Hash Data Feed |
KL_ICS_Hash_MD5 |
7A8F30B40C6564EFF95E678F7C43346C |
The following table summarizes target numbers for the verification test when only demo feeds are used.
Verification test results (demo feeds)
Feed used |
eventName value |
Detected objects |
DEMO Botnet_CnC_URL_Data_Feed |
KL_BotnetCnC_URL |
http://5a015004f9fc05290d87e86d69c4b237.com http://fakess123bn.nu |
DEMO IP_Reputation_Data_Feed |
KL_IP_Reputation |
192.0.2.1 192.0.2.3 |
DEMO Malicious_Hash_Data_Feed |
KL_Malicious_Hash_MD5 |
776735A8CA96DB15B422879DA599F474 FEAF2058298C1E174C2B79AFFC7CF4DF 44D88612FEA8A8F36DE82E1278ABB02F |
Extra integration scenarios
This section describes additional installation and integration scenarios.
Separate installation of Feed Service and Feed Utility (Windows)
You can install Feed Service and Feed Utility on separate computers. This allows you to isolate the computer, on which event data is matched against feeds, from the Internet.
Do not delete the dmz directory from the distribution kit of Kaspersky CyberTrace, even if you do not plan to use Feed Service and Feed Utility on separate computers.
You can install Feed Utility on a Linux computer. For this you must have the distribution package for Linux, which also contains the instructions on how to perform the installation.
How Feed Service and Feed Utility work in DMZ
The following diagram describes how Feed Service and Feed Utility work in the DMZ.
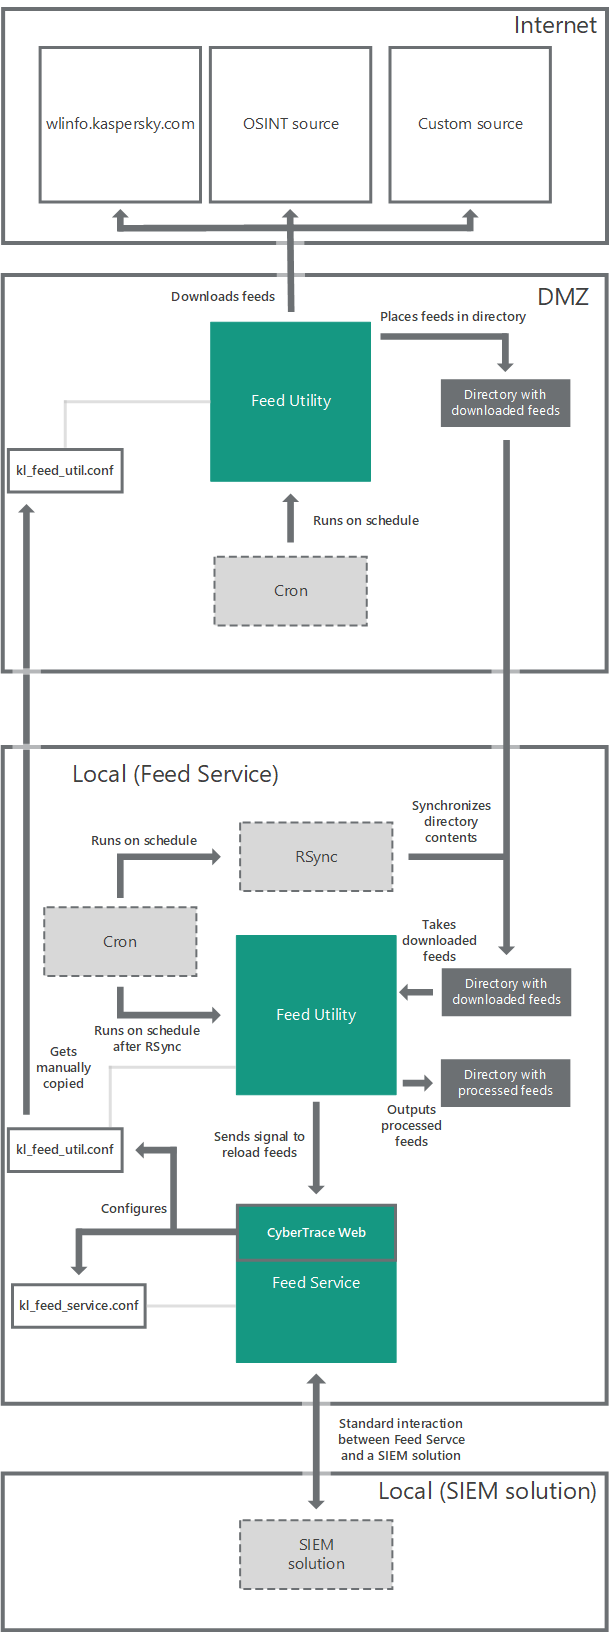
Workflow when Feed Service and Feed Utility are installed on separate computers
Using CyberTrace Web if Feed Service and Feed Utility are on separate computers
If you use Kaspersky CyberTrace Web with Feed Service and Feed Utility installed on separate computers, keep the following actions in mind with respect to the Settings > Feeds tab, in the Feeds update period section.
- Do not update feeds (by clicking the Launch update now button) or change the update frequency (by selecting a value from the Update frequency drop-down list).
The feeds will not be updated on the Local computer, because it is isolated from the Internet.
- (Kaspersky CyberTrace version 3.0) Do not change the Kaspersky certificate by clicking Import certificate.
The certificate will only be changed on the Local computer. To change the certificate on the DMZ computer, manually copy it from the Local computer to the
dmzfolder.
By default, Kaspersky CyberTrace updates Kaspersky Threat Data Feeds every 30 minutes.
If you use DMZ integration, perform one of the following actions:
- Stop the scheduled task that regularly updates feeds by disabling feed updates on the Settings > Feeds tab of the web interface.
- Stop the scheduled task that regularly updates feeds by specifying
0in theupdate_frequencyattribute of the Feeds element in the Feed Service configuration file.
You can use Kaspersky CyberTrace Web to perform the actions listed below. However, note that each time you make any changes, you have to copy the kl_feed_util.conf file from the Local computer to the DMZ computer so that the changes you made on the Local computer will be replicated on the DMZ computer.
- You can change the remaining settings of feeds on the Settings > Feeds tab.
For example, you can add new custom or third-party feeds.
- You can change the settings of a proxy server on the Settings > Service tab, in the Connection settings section.
Installing Feed Service and Feed Utility on separate computers
The following procedure describes how to install Feed Service on one computer (in this topic, referred to as Local) and Feed Utility on another computer (in this topic, referred to as DMZ).
If you use Kaspersky CyberTrace Web, see subsection "Using CyberTrace Web if Feed Service and Feed Utility are on separate computers", above, before proceeding to the installation.
To install Feed Service and Feed Utility on separate computers:
- Install Kaspersky CyberTrace from the distribution package to a directory (referred to as
%service_dir%) on the Local computer.(Kaspersky CyberTrace version 3.0) If you use Windows Installer, after you specify the path to the certificate file, the list of available feeds is not retrieved, because the Local computer is not connected to the Internet. In this case, you are prompted to manually select the feeds.
- Locate the kl_feed_service.conf configuration file. In this file, locate the
<NotifyKTFS path="">false</NotifyKTFS>element. Change it to<NotifyKTFS path="..\bin">true</NotifyKTFS>. - Copy the
dmzsubfolder of the installation folder from the Local computer to the DMZ computer.(Kaspersky CyberTrace version 3.0) When you want to use a new PEM-formatted certificate for updating feeds, change Kaspersky CyberTrace configuration by performing the installation procedure again. You will have to copy the
dmzsubfolder from the Local computer to the DMZ computer. - If you use Kaspersky CyberTrace Web and want to change the settings of any feed or add a new custom or third-party feed, make all the necessary changes directly on the Settings > Feeds tab in Kaspersky CyberTrace Web.
- Replace the kl_feed_util.conf file in the
dmzfolder located on the DMZ computer with the copy of the same file stored on the Local computer.You can obtain kl_feed_util.conf on the Local computer in one of the following ways:
- Copy it from the
%service_dir%\binfolder. - If you use Kaspersky CyberTrace Web, select the Settings > Service tab and click Export configuration file.
- Copy it from the
- Configure the synchronization of directories containing feeds as stated in subsection "Synchronizing directories that contain feeds" below.
- In the
%service_dir%\scripts\cron_cybertrace.cmdfile on the Local computer, specify the credentials for connecting to the DMZ computer and the path to thefeedsfolder on the DMZ computer.
Configuring the updating of feeds on the DMZ computer
Create a regularly launched task that runs the updating of feeds on the DMZ computer so that the cron_dmz.cmd script will run twice as often as in the case when Kaspersky CyberTrace is installed on a single computer. This task will cause new versions of feeds to be used as soon as possible. For example, create the task by running the following command:
schtasks /create /tn KasperskyFeedServiceUpdate /ru system /f /tr "\"%path_to_cron.cmd%\cron_dmz.cmd\"" /sc minute /mo 15
Configuring the updating of feeds on the Local computer
Add a task that runs the updating of feeds so that the cron_cybertrace.cmd script will run twice as often as when Kaspersky CyberTrace is installed on a single computer. For example, modify the task by running the following command. Substitute %user% with the name of the user that is authorized to run Cygwin on a Windows computer, and substitute %password% with a password for this user.
schtasks /create /tn KasperskyFeedServiceUpdate /ru %user% /rp %password% /f /tr "%service_dir%\scripts\cron_cybertrace.cmd" /sc minute /mo 15
The synchronization of feeds must occur after they are updated on the DMZ computer, and so you can specify launching of the cron_cybertrace.cmd script several minutes after the cron_dmz.cmd script is launched on the DMZ computer.
You may have to change the settings in the cron_cybertrace.cmd script. The settings are describes in the following table. For more information, see subsection "Synchronizing directories that contain feeds" below.
Settings in cron_cybertrace.cmd
Setting |
Description |
RSYNC_USER |
Login on the computer where the RSync utility is installed. |
RSYNC_HOST |
Host where the RSync utility is installed. |
PATH_TO_FEEDS |
Path to the directory where to store the processed feeds. |
DOWNLOAD_DIR |
Path to the directory in which the feeds are dowloaded. Do not change the value of this parameter. Changing this value may cause Feed Utility not to work properly. |
SSH_KEY |
The RSA public key to be used when synchronizing directories with feeds. |
Synchronizing directories that contain feeds
For synchronizing feeds on both the Local computer and DMZ computer, you can use the RSync utility. On a computer running Windows, the RSync utility can be run by using Cygwin.
All Linux commands below are run on Windows computers by using Cygwin.
To install the RSync utility on a Windows computer:
- Install the default set of packages from the Cygwin distribution.
- Install the following utilities: OpenSSH, OpenSSL, and RSync.
- On the DMZ computer, configure the OpenSSH components as follows:
- Run the following command as root:
ssh-host-configYou can answer
Yesevery time. The important point is to run the sshd daemon as a service. - Run the following command:
net start sshd
- Run the following command as root:
The sshd daemon will start automatically.
To configure the synchronization of feeds:
- Create a private key and a corresponding public key.
For this purpose, run the following command on the Local computer:
ssh-keygen -t rsa -q -N '' -f /home/<user>/.ssh/dmz_rsa_key(Specify the user login instead of
<user>.) The keys will be created without a password. - Copy the public key from the Local computer to the DMZ computer by running the following command:
ssh-copy-id -i /home/<user>/.ssh/dmz_rsa_key <DMZ_user>@<DMZ_host>When you run this command, you will be asked for the password to
<DMZ_user>@<DMZ_host>. - Test the synchronization of the contents of directories that contain feeds by running the following command on the Local computer:
rsync -a --delete-before --delay-updates -e "ssh -i /home/<user>/.ssh/dmz_rsa_key" <DMZ_user>@<DMZ_host>:/<Path_to_feeds>/ /<Path_to_feeds_on_Local>/In this command,
<Path_to_feeds_on_Local>is the path to the folder containing feeds on the Local computer (namely,%service_dir%/feeds), and<Path_to_feeds>is the path to the folder on which updated feeds are stored on the DMZ computer.To pass the synchronization test, the contents of the
<Path_to_feeds_on_Local>folder on the Local computer must be the same as the contents of the<Path_to_feeds>folder on the DMZ computer.
Separate installation of Feed Service and Feed Utility (Linux)
You can install Feed Service and Feed Utility on separate computers. This allows you to isolate the computer, on which event data is matched against feeds, from the Internet.
Do not delete the dmz directory from the distribution kit of Kaspersky CyberTrace, even if you are not going to use Feed Service and Feed Utility on separate computers.
You can install Feed Utility on a Windows computer. For this you must have the distribution package for Windows which also contains the instructions on how to perform the installation.
How Feed Service and Feed Utility work in DMZ
The following diagram describes how Feed Service and Feed Utility work in DMZ.
Workflow when Feed Service and Feed Utility are installed on separate computers
Using CyberTrace Web if Feed Service and Feed Utility are on separate computers
If you use Kaspersky CyberTrace Web with Feed Service and Feed Utility installed on separate computers, avoid performing the actions below on the Settings > Feeds tab, in the Feeds update period section. The actions will be ineffective.
- Do not update feeds (by clicking the Launch update now button) or change the update frequency (by selecting a value from the Update frequency drop-down list).
The feeds will not be updated on the Local computer, because it is isolated from the Internet.
- (Kaspersky CyberTrace version 3.0) Do not change the Kaspersky certificate (by clicking Import certificate).
The certificate will only be changed on the Local computer. To change the certificate on the DMZ computer, manually copy it from the Local computer to the
dmzdirectory.
By default, Kaspersky CyberTrace updates Kaspersky Threat Data Feeds every 30 minutes.
If you use DMZ integration, perform one of the following actions:
- Stop the scheduled task that regularly updates feeds by disabling feed updates on the Settings > Feeds page of the web interface.
- Stop the scheduled task that regularly updates feeds by specifying
0in theupdate_frequencyattribute of the Feeds element in the Feed Service configuration file.
You can use Kaspersky CyberTrace Web to perform the actions listed below. However, note that each time you make any changes, you have to copy the kl_feed_util.conf file from the Local computer to the DMZ computer so that the changes you made on the Local computer get replicated on the DMZ computer.
- You can change the remaining settings of feeds on the Settings > Feeds tab.
For example, you can add new custom or third-party feeds.
- You can change the settings of a proxy server on the Settings > Service tab in the Connection settings section.
Outline of the installation procedure
The following procedure describes how to install Feed Service on one computer (in this topic, referred to as Local) and Feed Utility on another computer (in this topic, referred to as DMZ).
If you use Kaspersky CyberTrace Web, please see section "Using CyberTrace Web if Feed Service and Feed Utility are on separate computers" above before proceeding to the installation.
To install Feed Service and Feed Utility on separate computers:
- Install Kaspersky CyberTrace from the distribution package to a directory (referred to as
%service_dir%) on the Local computer.(Kaspersky CyberTrace version 3.0) After you specify the path to the certificate file in the configurator, the list of available feeds is not retrieved, because the Local computer is not connected to the Internet. In this case, you are prompted to manually select the feeds.
- Locate the kl_feed_service.conf configuration file. In this file, locate the
<NotifyKTFS path="">false</NotifyKTFS>element. Change it to<NotifyKTFS path="..\bin">true</NotifyKTFS>. - Copy the
dmzsubdirectory of the installation directory from the Local computer to the DMZ computer.(Kaspersky CyberTrace version 3.0) When you have to use a new PEM-formatted certificate for updating feeds, change Kaspersky CyberTrace configuration using the installation script. You will have to copy the
dmzsubdirectory from the Local computer to the DMZ computer. - If you use Kaspersky CyberTrace Web and want to change the settings of any feed or add a new custom or third-party feed, make all the necessary changes directly on the Settings > Feeds tab in Kaspersky CyberTrace Web.
- Replace the kl_feed_util.conf file in the
dmzdirectory located on the DMZ computer with the copy of the same file stored on the Local computer.You can obtain kl_feed_util.conf on the Local computer in one of the following ways:
- Configure the synchronization of directories containing feeds as stated in section "Synchronizing directories that contain feeds" below.
- In the
%service_dir%/scripts/cron_cybertrace.shfile on the Local computer, specify the credentials for connecting to the DMZ computer and the path to thefeedsdirectory on the DMZ computer.
Configuring the updating of feeds on the DMZ computer
Configure the cron task that runs the updating of feeds on the DMZ computer so that the cron-dmz.sh script will run twice as often as when Kaspersky CyberTrace is installed on a single computer. This is done so that the new versions of feeds will be used as soon as possible. For example, specify the following line in the cron configuration file:
*/15 * * * * %path_to_cron.sh%/cron-dmz.sh
Configuring the updating of feeds on the Local computer
Add a task that runs the updating of feeds so that the cron_cybertrace.sh script will run twice as often as when Kaspersky CyberTrace is installed on a single computer. The synchronization of feeds must occur after they are updated on the DMZ computer, and so you can specify launching of the cron_cybertrace.sh script several minutes after the cron-dmz.sh script is launched on the DMZ computer. For example, specify the following line in the cron configuration file:
*/15+7 * * * * %service_dir%/scripts/cron_cybertrace.sh
You might have to change the settings in the cron_cybertrace.sh script. The settings are describes in the following table. For more information, see subsection "Synchronizing directories that contain feeds" below.
Settings in cron_cybertrace.sh
Setting |
Description |
RSYNC_USER |
Login on the computer where the RSync utility is installed. |
RSYNC_HOST |
Host where the RSync utility is installed. |
PATH_TO_FEEDS |
Path to the directory where to store the processed feeds. |
DOWNLOAD_DIR |
Path to the directory in which the feeds are downloaded. Do not change the value of this parameter. Changing this value may cause Feed Utility not to work properly. |
SSH_KEY |
The RSA public key to be used when synchronizing directories with feeds. |
Synchronizing directories that contain feeds
For synchronizing feeds on both the Local and DMZ computers you can use the RSync utility. If the DMZ computer is a Windows computer, the RSync utility can be run by using Cygwin.
To install the RSync utility on a Windows computer:
- Install the default set of packages from the Cygwin distribution.
- Install the following utilities: OpenSSH, OpenSSL, and RSync.
- On the DMZ computer, configure the OpenSSH components as follows:
- Run the following command as root:
ssh-host-configYou can answer
"Yes"every time. The main point is to run the sshd daemon as a service. - Run the following command:
net start sshd
- Run the following command as root:
The sshd daemon will start automatically.
To configure the synchronization of feeds:
- Create a private key and a corresponding public key.
For this purpose, run the following command on the Local computer:
ssh-keygen -t rsa -q -N '' -f /home/<user>/.ssh/dmz_rsa_key(Specify the user login instead of
<user>.) The keys will be created without a password. - Copy the public key from the Local computer to the DMZ computer by running the following command:
ssh-copy-id -i /home/<user>/.ssh/dmz_rsa_key <DMZ_user>@<DMZ_host>When you run this command, you will be asked for the password to
<DMZ_user>@<DMZ_host>. - Test the synchronization of the contents of directories that contain feeds by running the following command on the Local computer:
rsync -a --delete-before --delay-updates -e "ssh -i /home/<user>/.ssh/dmz_rsa_key" <DMZ_user>@<DMZ_host>:/<Path_to_feeds>/ /<Path_to_feeds_on_Local>/In this command,
<Path_to_feeds_on_Local>is the path to the directory containing feeds on the Local computer (namely,%service_dir%/feeds), and<Path_to_feeds>is the path to the directory on which updated feeds are stored on the DMZ computer.To pass the synchronization test, the contents of the
<Path_to_feeds_on_Local>directory on the Local computer must be the same as the contents of the<Path_to_feeds>directory on the DMZ computer.
Integration with QRadar when QRadar cannot get updates
If it is not possible to get the latest QRadar updates, use the configuration procedure below.
To use QRadar with Feed Service if QRadar cannot be updated:
- Import new QRadar identifiers to QRadar.
- Add Feed Service as a log source for QRadar.
- Map Feed Service events to QRadar identifiers.
- Perform the verification test.
- (optional) Perform all steps from the following instructions: Configure QRadar to display custom fields of events.
- (optional) Perform all steps from the following instructions: Configure QRadar to display events in a dashboard.
After you have successfully integrated Kaspersky CyberTrace with QRadar, install Kaspersky Threat Feed App:
Importing QIDs to QRadar
QRadar must correctly process the incoming events from Feed Service. For this purpose, you must add a list of permissible events (a list of QRadar identifiers (QIDs)) to QRadar. In Feed Service, the event categories are defined in the configuration file, in the Feeds > Feed > Field element, the category attribute.
The distribution kit of Kaspersky CyberTrace includes a file named sample_qid.txt that contains necessary events from Feed Service. Do not alter the descriptions of these events but, instead, add your own events to this file.
We recommend that you name the event categories according to the format "KL_<feed>_<object_type>", where:
<feed>—The name of the feed which detects the event (for example,PhishingUrl).<object_type>—The field by which the event is detected (for example,URL,Hash_MD5,Hash_SHA1,Hash_SHA256).
To import the list of QIDs to QRadar:
- If necessary (for example, if your technical account manager recommends it), edit the
%service_dir%/integration/qradar/sample_qid.txtfile by adding to it all the event categories contained in the configuration file.Every event category must be described in a single line that has the following format:
,<event>,<descr>,<sev>,<cat_id>where:
<event>—The name of the incoming event.<descr>—The description of the event.<sev>—The severity of the event.<cat_id>—A low-level QRadar event identifier.The total list of QRadar event identifiers can be printed by the following command:
/opt/qradar/bin/qidmap_cli.sh -lWe recommend that you use values for
<sev>and<cat_id>according to QRadar documentation.
For example:
,KL_Malicious_URL,Malicious URL is detected by Kaspersky Threat Feed Service,8,7058 - Upload the
%service_dir%/integration/qradar/sample_qid.txtfile to the server that has QRadar installed. - Invoke the command:
/opt/qradar/bin/qidmap_cli.sh -i -f <filename>where
<filename>is the destination path of thesample_qid.txtfile uploaded in step 2. - To view the added custom QIDs, run the following command:
/opt/qradar/bin/qidmap_cli.sh –e
If an error occurs, refer to IBM Security QRadar SIEM Administration Guide for information on resolving the problem.
Page topAdding Feed Service as a log source
QRadar must treat Feed Service as a log source to receive the events sent by the service. The events sent by Feed Service are in the QRadar Log Event Extended Format (LEEF) format, and the new log source in QRadar will be a Universal LEEF log source.
To add Feed Service to QRadar as a log source:
- Select the Admin > Log Sources > Add menu item.
- In the Add a log source window, type a unique name for the log source.
This name will be displayed in the GUI for any event from this source.
- Type the description of the log source.
- Select
Universal LEEFin the Log Source Type control. - Select "Syslog" in the Protocol Configuration drop-down list.
- In the Log Source Identifier text box, type the identifier that is set in the Feed Service configuration file—in this case, it is
KL_Threat_Feed_Service_v2. This identifier is used in the EventFormat and AlertFormat parameters.Do not select the Coalescing Events checkbox. If you select it, all the events from Feed Service will coalesce into a single event that will contain no useful information.
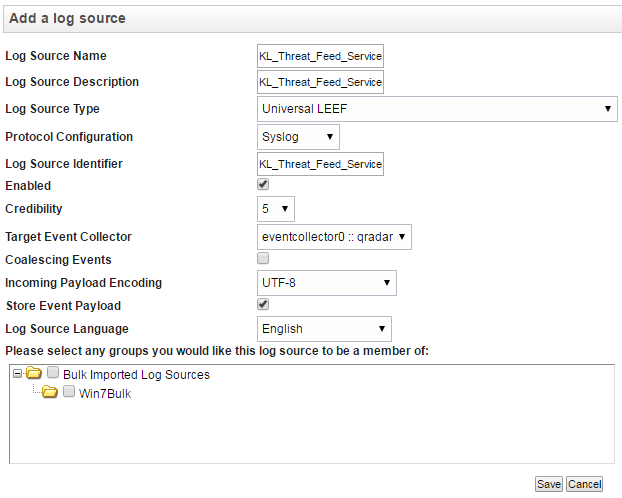
Adding a log source to QRadar
- Click Save.
Perform the same actions to add another log source with the KL_Verification_Tool identifier. It will be used for testing the interaction between Feed Service and QRadar.
After the two log sources are added, select the Admin > Deploy Changes menu item.
Page topMapping events to QIDs
When the events from the sample_initiallog.txt file are received by QRadar, the Log Activity page displays them as of "unknown" type.
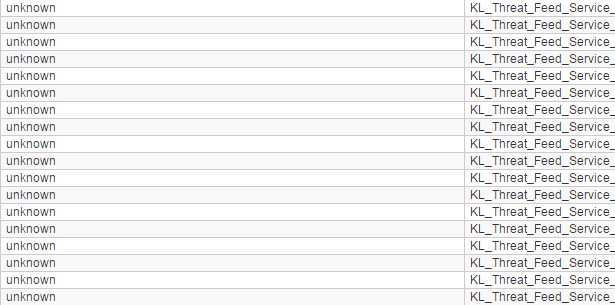
Log with "unknown" events
If the Log Activity page displays too many events that arrive from different devices, you can add an event filter. In this event filter, set KL_Threat_Feed_Service_v2 and KL_Verification_Tool as the log sources (the operator used in the filter must be Equals any of).
To correctly identify the events, set the mapping between QIDs and events:
- In QRadar Console, select the Log Activity tab, stop the events flow by clicking Pause () in the upper-right area of the window, and then double-click any event of "unknown" type that has "
KL_Threat_Feed_Service_v2" in the Log Source column.
Stop the events flow
The event information will be displayed. The event name will be contained in Payload information.
- Click the Map Event button.
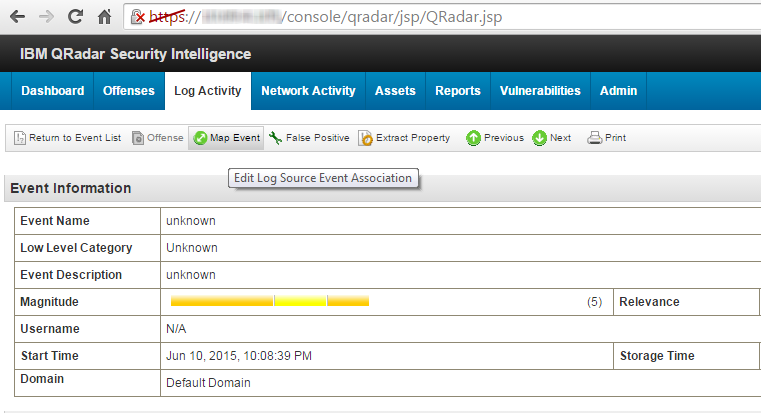
Browsing event information
- In the Log Source Event window in the QID/Name text box, type the event name. It must be one of the QIDs imported to QRadar.
- Click Search.
One result will be displayed in the Matching QIDs table.
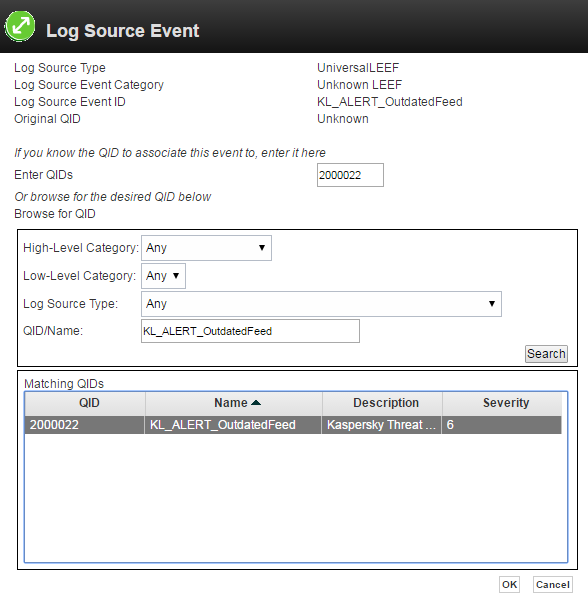
Adding the correspondence between a QID and an event name
- Select the table row and click OK.
- Perform steps 3, 4, and 5 for all event types (imported QIDs).
- To ensure that events and QIDs are mapped correctly, repeat the procedure for sending a set of events to QRadar. The Log Activity page must not contain any event of "unknown" type.
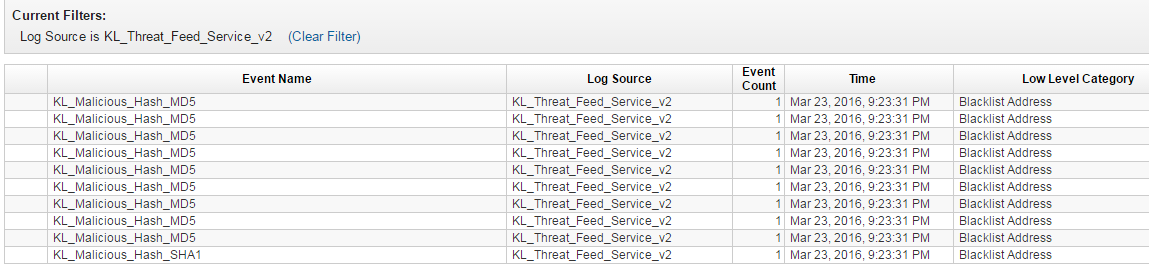
Log without "unknown" events
Specifying the log source type
Perform the following procedure only if you had to add Feed Service to QRadar as a log source manually because you did not have the latest QRadar updates. Use the procedure to specify the Log Source Type property of the added custom event properties.
To specify the log source type of the added custom event properties:
- In QRadar, select Admin and under Data sources, in the Events section, select Custom Event Properties.
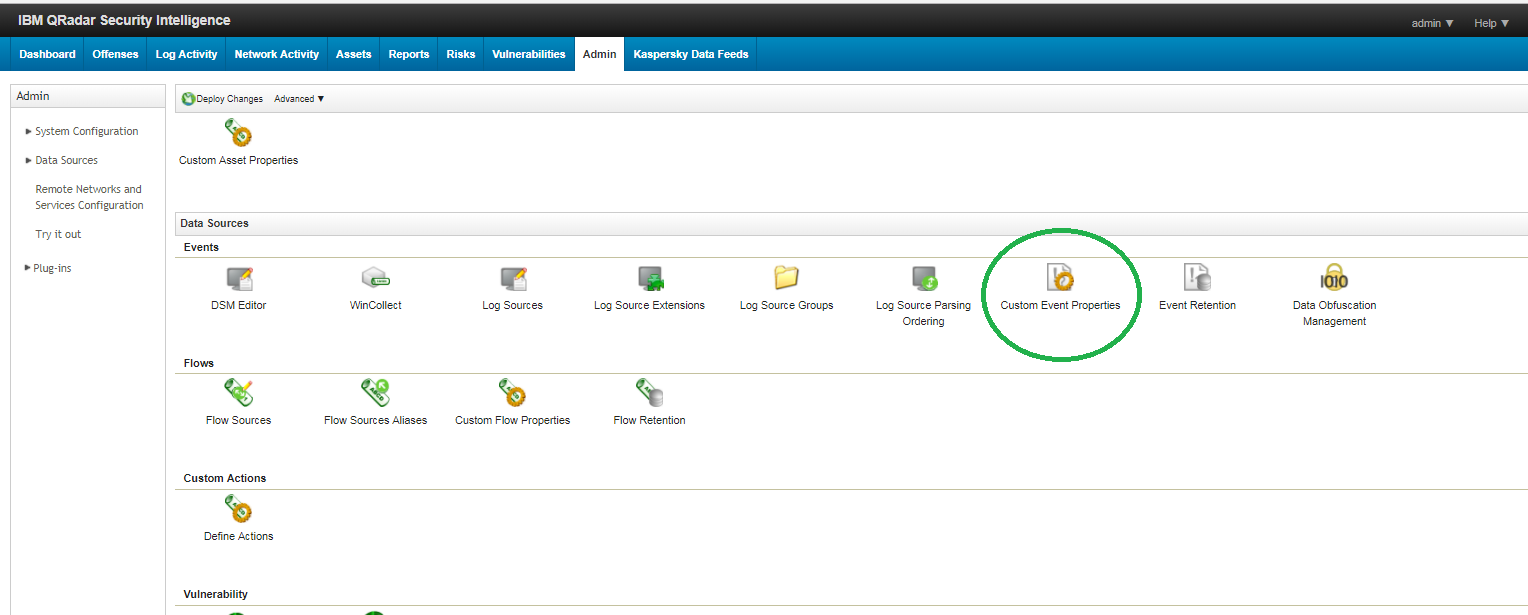
Admin tab of QRadar Console
The Custom Event Properties window opens.
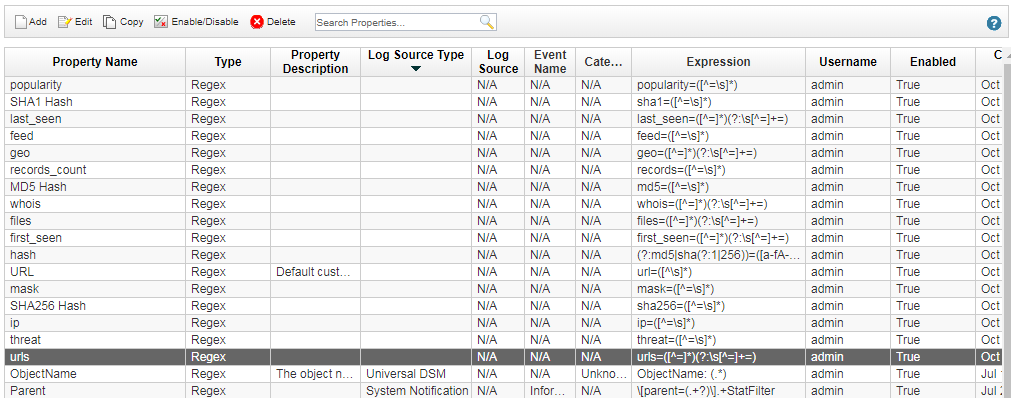
Custom event properties
- For each custom event property, perform the following steps:
- Select the property.
- Click Edit.
A Custom Event Property Definition window opens.
- In the Log Source Type drop-down box, select Universal LEEF.
- Select the Existing Property option.
The Existing Property option was selected before you changed the value in the Log Source Type drop-down box. However, after you changed the log source type, the New Property option was selected. Therefore, you have to select the Existing Property option again.
- Click Save.
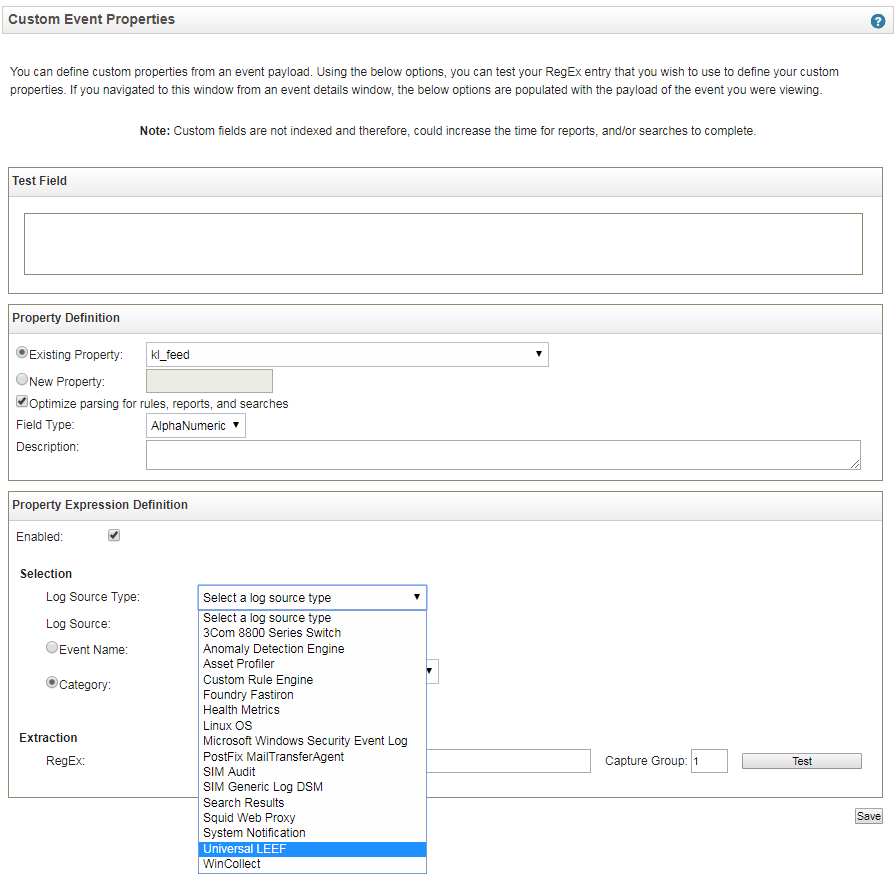
Custom event property definition
The log source type of every custom event property will now be Universal LEEF.
Specifying custom ArcSight user in ArcSight Forwarding Connector settings
This section describes how to specify a custom ArcSight user in the ArcSight Forwarding Connector settings.
When the ARB package is imported to ArcSight, the FwdCyberTrace user is created in the Kaspersky CyberTrace Connector group. This user account is intended for use by ArcSight Forwarding Connector. You may want to use another user account instead. We recommend that in this case you remove the FwdCyberTrace user and the Kaspersky CyberTrace Connector group. Note that your custom user must have the Forwarding Connector type.
To create a custom ArcSight user account for forwarding events from ArcSight ESM to Feed Service:
- Run ArcSight Console.
- In the Navigator pane, select the Resources tab.
- Open the drop-down list and select Users.
- In the tree view, select the user group that contains the custom user account.
It is recommended to put this user account into a separate user group created only for this user.
- In the tree view, right-click the group entry and select Edit Access Control.
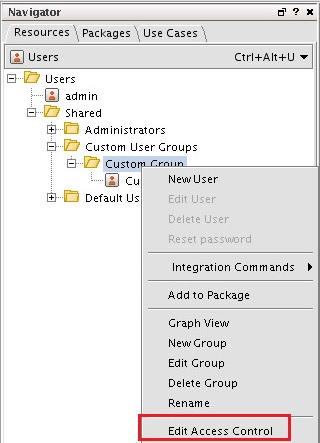
Editing access settings
- In the Inspect/Edit pane, select the Events tab.
- Click Add.
- Select the following event filters:
CyberTrace forwarding eventsThis is the filter for events that contain hashes, URLs, and IP addresses.
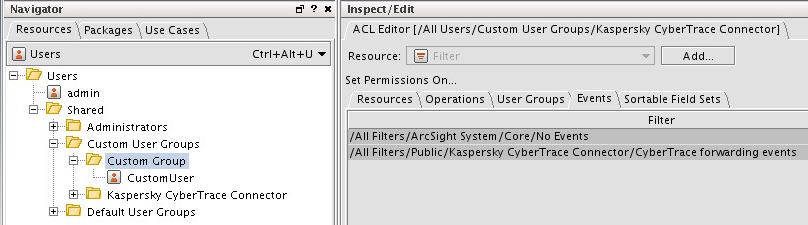
Selecting the event filters
- Install or reconfigure ArcSight Forwarding Connector.
The procedure for reconfiguring of ArcSight Forwarding Connector is provided below in this section.
To reconfigure ArcSight Forwarding Connector:
- Change the current working directory to
%FORWARDING_DIR%/current/bin.Here
%FORWARDING_DIR%is a directory where ArcSight Forwarding Connector is installed. - Execute the runagentsetup.sh script.
- Select Modify Connector and click Next.
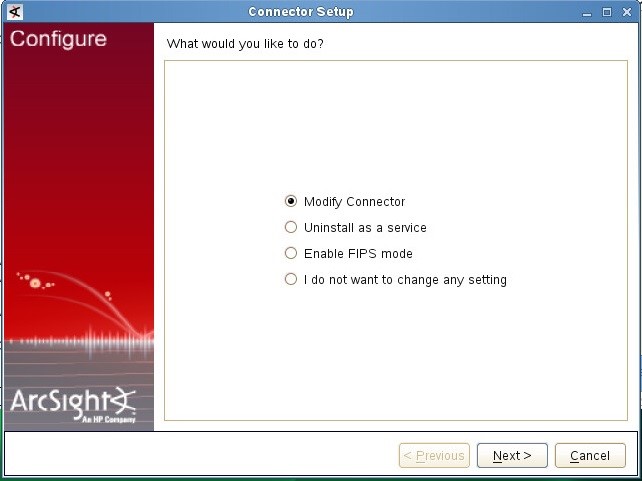
Modifying the connector
- Select Modify connector parameters and click Next.
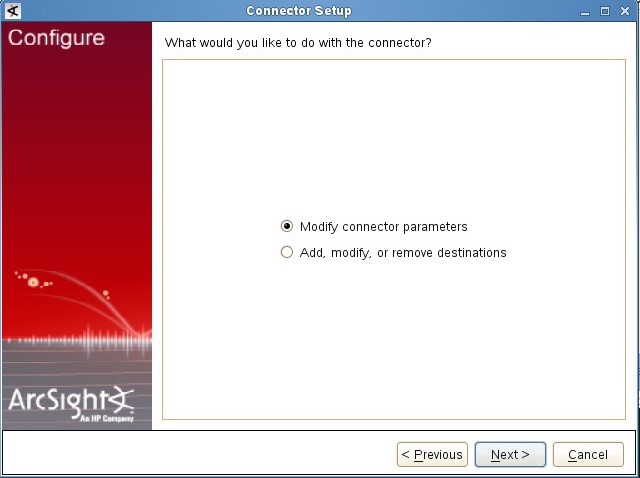
Modifying the connector parameters
- Specify the ArcSight parameters and the credentials of the custom user account and click Next.
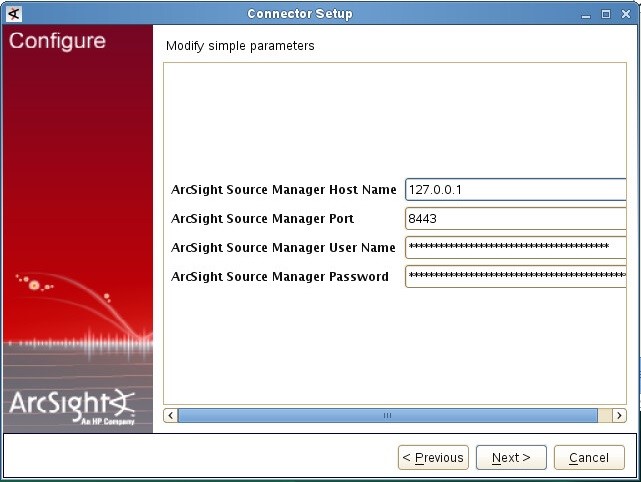
Specifying the ArcSight Source Manager parameters
- Click Next and then click Finish to finalize the Connector Setup window.