Viewing summary data in the Dashboard section
Viewing summary data in the Dashboard section
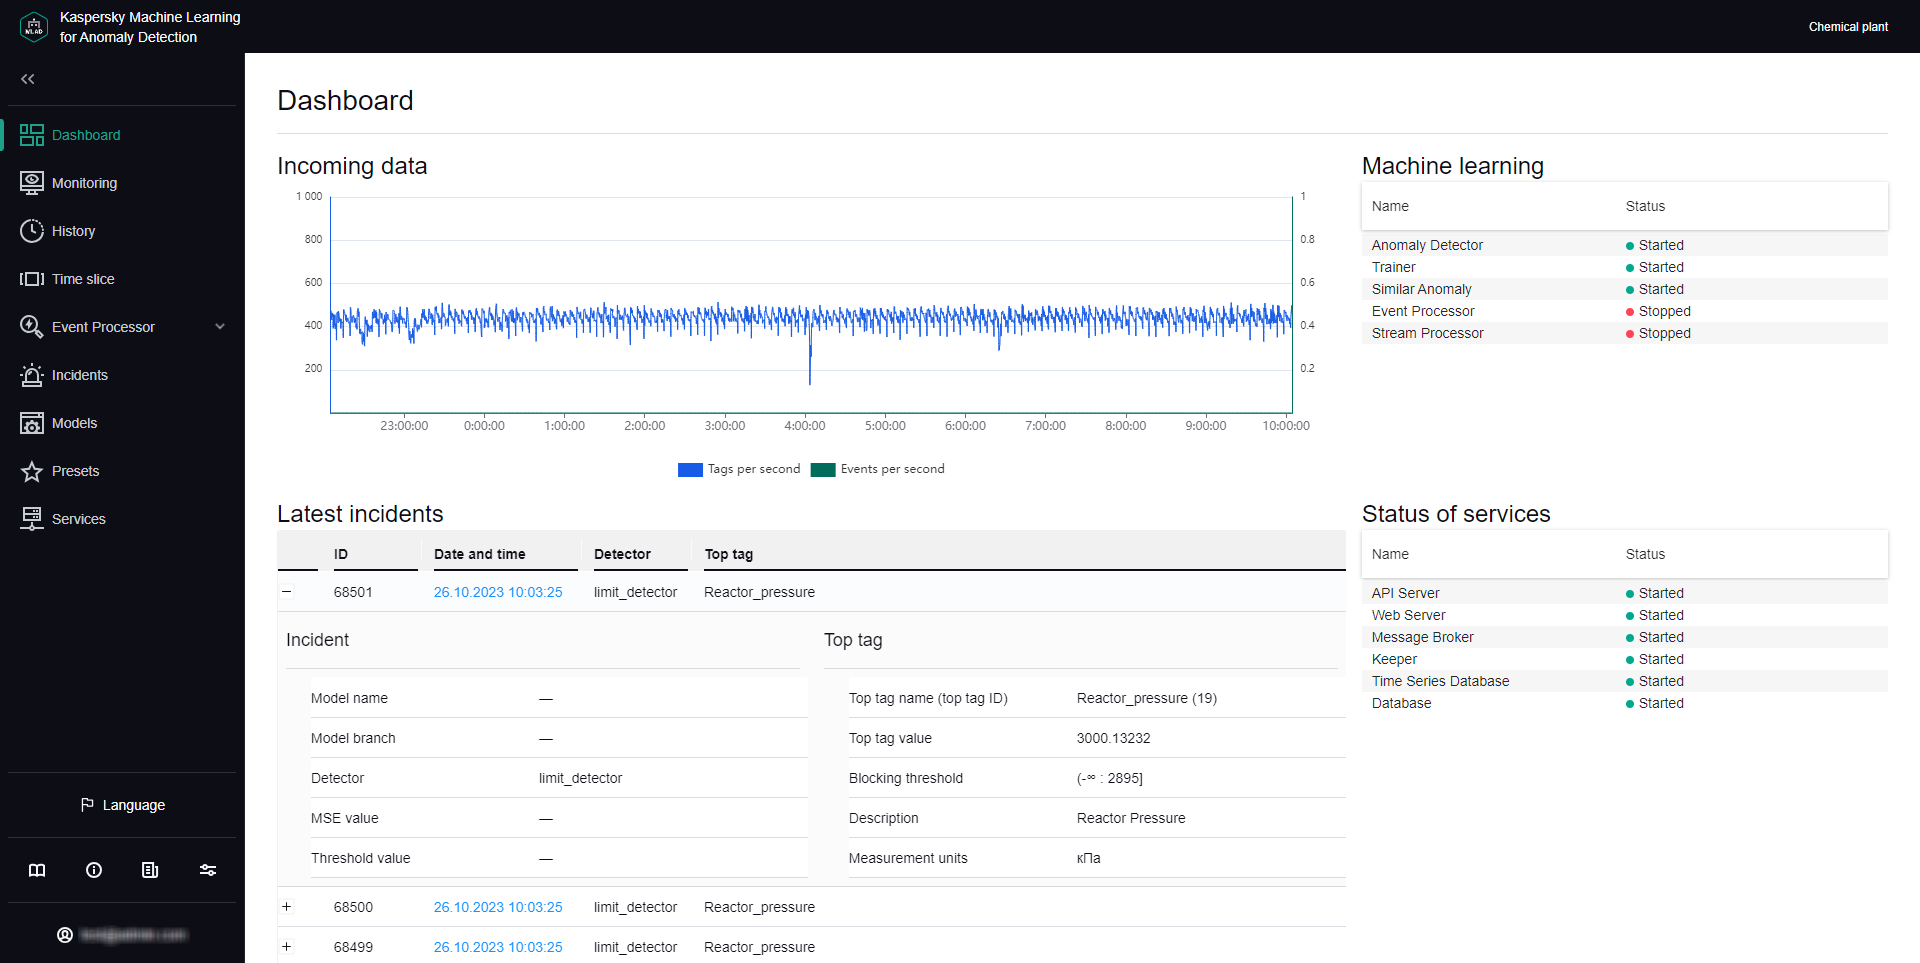
The Dashboard section provides summary information on the number of tags and events received by Kaspersky MLAD, registered incidents, and the status of services.
The information on the page is divided into the following blocks:
- Incoming data is a graph that displays the number of tags and events received by Kaspersky MLAD. You can enable or disable the display of incoming tags and events on the graph by clicking the corresponding data signature legend under the graph. The left scale of the graph displays the range for the number of incoming tags per second. The right scale of the graph displays the range for the number of incoming events per second.
- Latest incidents is a table that contains information about the latest registered incidents.
- Machine learning is a table that displays the status of services used for operation and training of the ML model, and the name of the active ML model.
- Status of services is a table that displays the status of each service.
 ) next to the incident in the incidents table opens a window with the technical specification of the selected incident and tag:
You can proceed to the History section from the Dashboard section by clicking the date and time of an incident in the Latest incidents table. The History section displays detailed information about the incidents registered by Kaspersky MLAD.
Dashboard section
Did you find this article helpful?
What can we do better?
Thank you for your feedback! You're helping us improve.
Thank you for your feedback! You're helping us improve.
