Viewing incoming data in the Monitoring section
In the Monitoring section, you can view the real-time values of the tags included in the preset and their predicted values. You can view data on relevant tags by selecting the necessary preset from the drop-down list. This list includes presets that can be created in the Presets section. For each tag included in the selected preset, the incoming values are displayed as a graph. You can customize the display of graphs and select a branch of a specific ML model to view the operating results of this branch. For example, you can view the tag values predicted by the Forecaster Detector and their errors, or the values obtained as a result of the work of diagnostic rules.
The lower part of the page contains a section displaying the cumulative mean square error (also referred to as the "MSE" or "cumulative error"), and the number of registered incidents (color-coded dot indicators). The orange line shows the MSE threshold, above which Kaspersky MLAD registers an incident.
Depending on the selected time scale and the density of incidents, one dot indicator may correspond to one or multiple closely-spaced incidents that were registered by one or multiple different detectors. The color of dot indicators corresponds to the color of the ML model branch that was used to register the incident. Special colors are reserved for dot indicators that correspond to a group of incidents registered by different branches and for incidents registered by the Limit Detector.
There will be no MSE error value for incidents logged by the Rule Detector. When analyzing these incidents, pay attention to the rule triggering marker (color-coded dot indicator) below the MSE graph for the selected ML model branch.
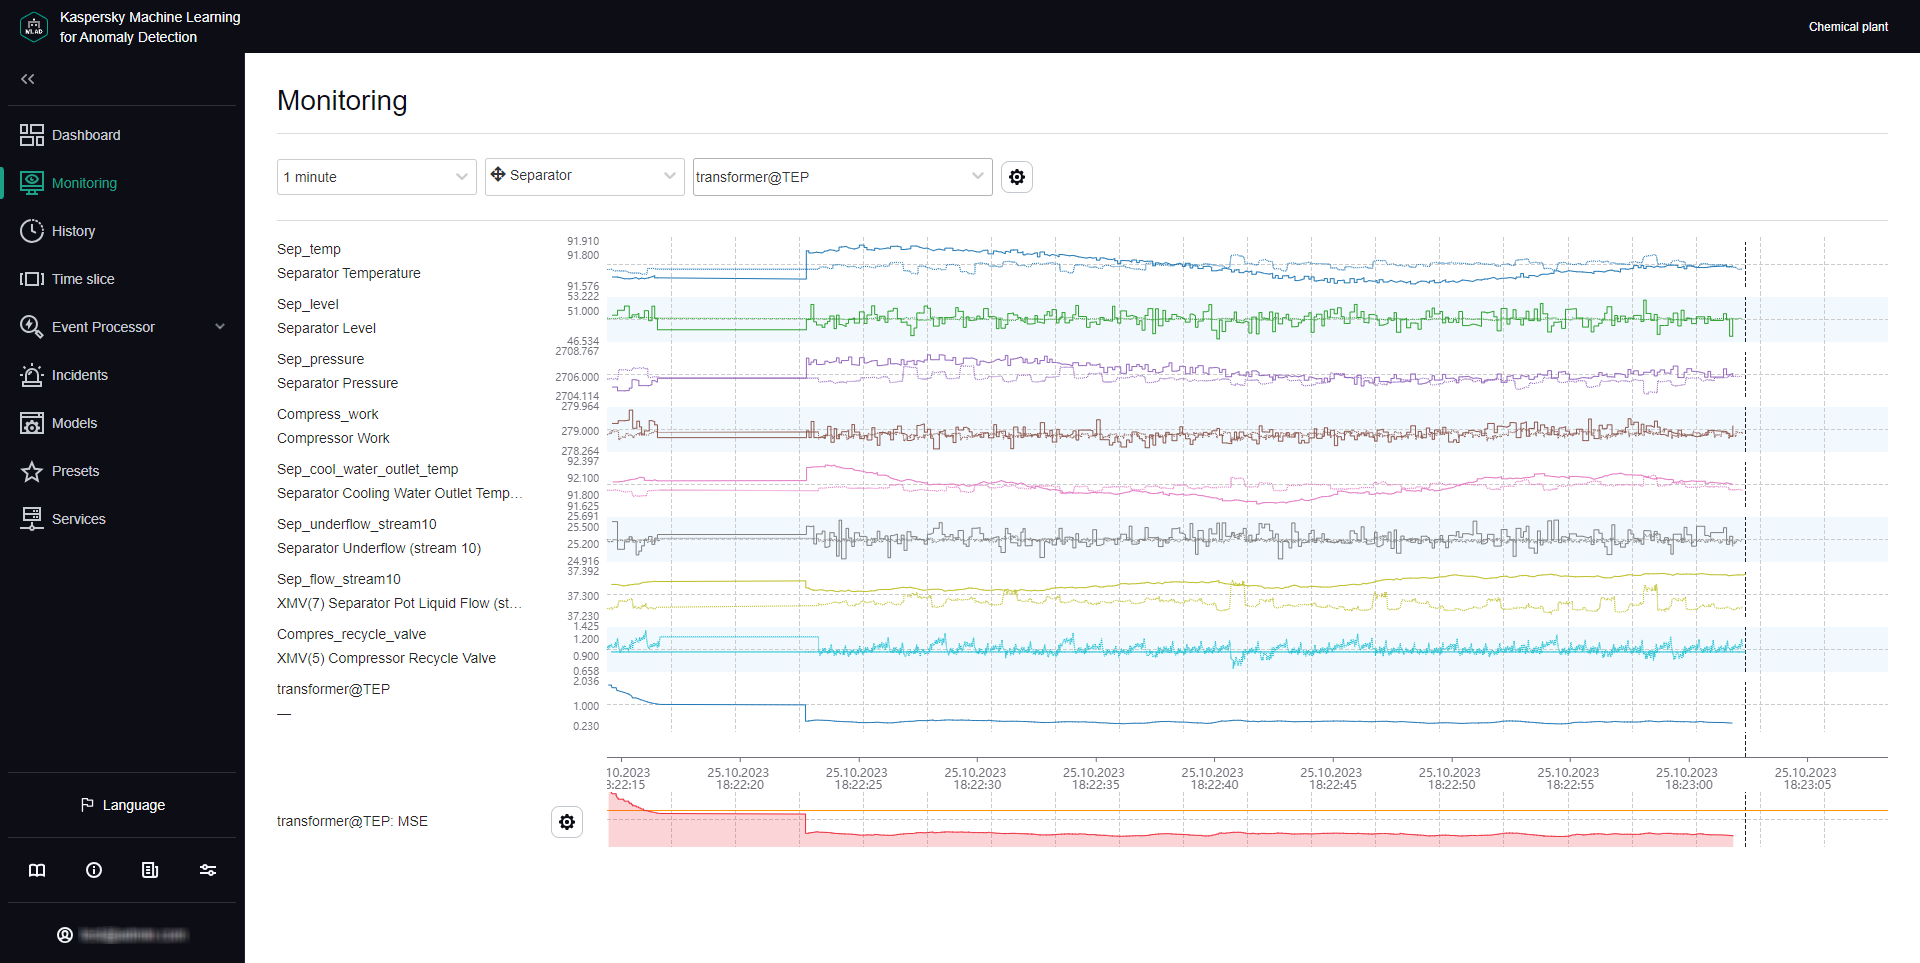
Monitoring section
