Studying the behavior of the monitored asset at the moment when an incident was detected
This section describes the sequence of actions required when studying the behavior of a monitored asset at the moment when an incident was detected.
Studying the behavior of a monitored asset consists of the following steps:
- Viewing the history of tags received for a monitored asset in the History section
You can proceed to view incident information in one of the following ways:
- If you want to view a recently detected incident, in the Dashboard section, click the date and time of the relevant incident in the Latest incidents table.
- In the Incidents section, click the date and time of the relevant incident in the incidents table.
- If an incident notification was created for you, you can proceed to view the incident by clicking the link from the email notification. The email message contains the time when the incident began, the most anomalous tag, and a link to proceed to the History section in the Kaspersky MLAD web interface.
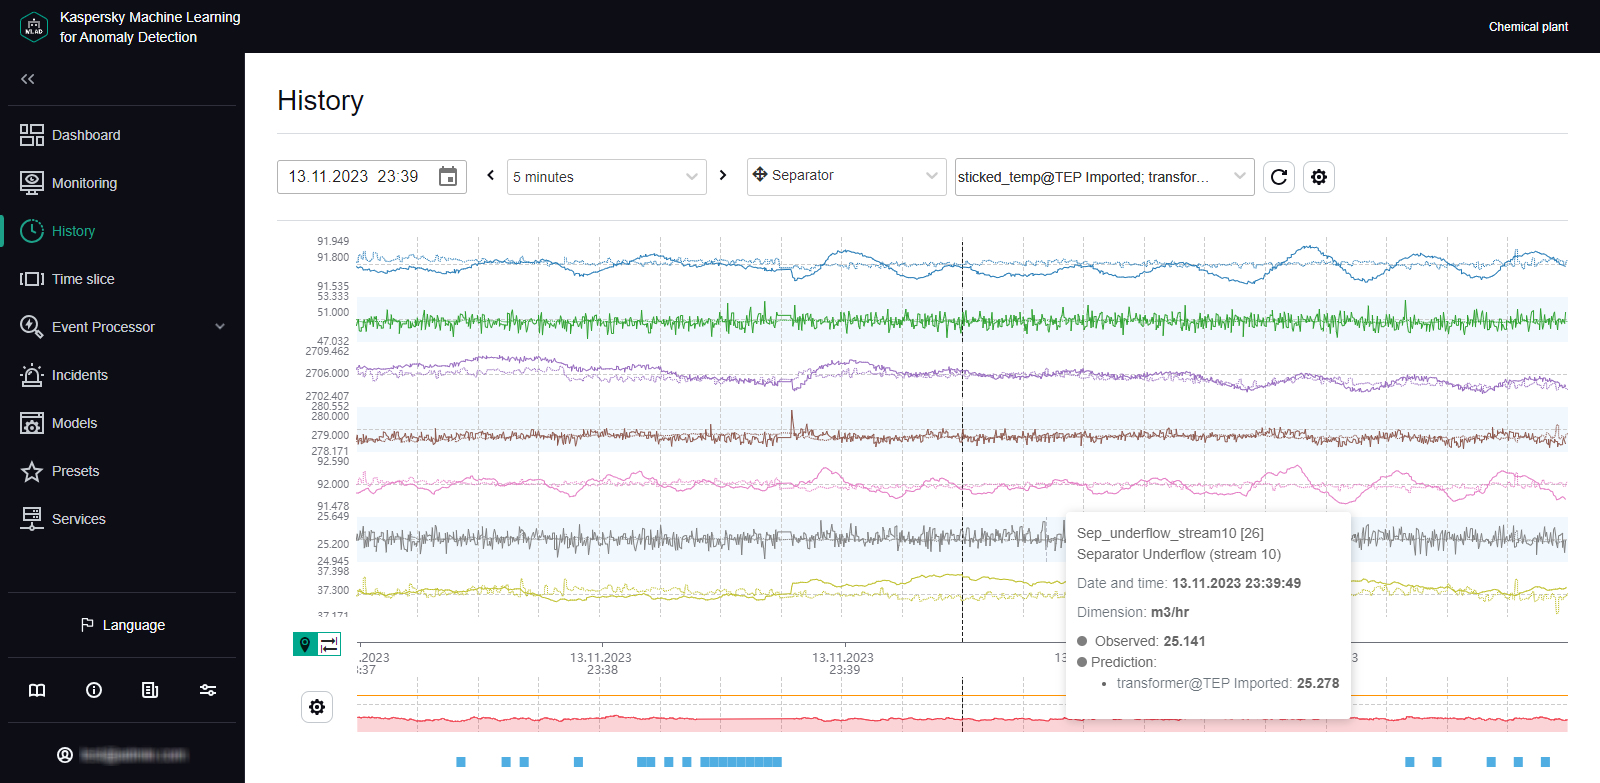
In the History section, Kaspersky MLAD displays a graph of tags received from the monitored asset for which the selected incident was registered. The graph displays data on the preset named Tags for event #N (N represents the incident number in the Incidents section), which is generated for the date and time when the selected incident was registered. This preset includes the tags that led to incident registration. Depending on the type of detector that registered an incident, this may involve the following tags:
- Tags whose actual values were deemed the most anomalous by the ML model, if the incident was registered by the Forecaster Detector.
- Tags included in a diagnostic rule and the value obtained as a result of the operation of this rule, if the incident was registered by the Rule Detector.
- A tag whose value was outside of the set blocking thresholds, if the incident was registered by the Limit Detector.
If necessary, you can select a different preset for displaying data received from the monitored asset at the moment when the incident was registered. The graph uses a vertical blue dashed line to indicate the date and time when the incident was registered.
- Configuring how data is displayed on a graph in the History section
In the History section, you can enable the display of predicted tag values. This lets you assess the difference between actual tag values and predicted tag values. Enabling the display of predicted values will also let you view values obtained as a result of the work of diagnostic rules. Tag information (name, numerical ID, description, unit of measurement, time, and tag value) is displayed whenever you move your mouse cursor over a tag graph. You can also enable display of the tag name and description for each tag graph.
- Configuring the time settings for displaying data in the History section
When studying the behavior of tags, you can change the scale of the time axis or move forward or backward in time through graphs. When displaying shorter time intervals on tag graphs, the History section may show more details of the behavior of tags that had been averaged when a tag graph for a longer period was displayed.
- Changing the vertical boundaries for displaying data in the History section
The vertical scale of each graph is selected by default based on the minimum and maximum values of a tag in the displayed area. You can control the scale of graphs according to the scale of values on the vertical axis by using one of the following methods:
- If minimum and maximum permissible values (blocking thresholds) are defined for a tag, enable the Always display blocking threshold function.
If a tag value is within the permissible range, the vertical scale of the graph will be fixed by limit lines derived from the lower and upper thresholds of the tag graph. If the tag values go beyond the specified blocking thresholds, the vertical scale will be automatically changed to display the tag values exceeding the thresholds.
- In the tag properties, set the permissible boundaries for displaying tag values on graphs.
If tag values go beyond the defined boundaries, they will not be displayed on the tag graph. The permissible boundaries for displaying tag values take priority over the display of blocking thresholds, even if the Always display blocking threshold function is enabled.
- If minimum and maximum permissible values (blocking thresholds) are defined for a tag, enable the Always display blocking threshold function.