Viewing statistics on the dashboard
April 11, 2024
ID 156523
Kaspersky CyberTrace Web opens with the Dashboard tab selected. The Dashboard displays the statistics of the work of Kaspersky CyberTrace and contains several sections:
- Statistics overview
- Supplier statistics
- Indicator statistics
- Supplier intersections
Note that if Kaspersky CyberTrace Service works in ReplyBack mode or you use Log Scanner in report mode (with the -r or --report command-line option), Kaspersky CyberTrace does not keep the statistics of the detection events and the Dashboard does not display the statistics. To save detection statistics in ReplyBack mode, use the X-KF-SaveStatistic flag.
When switching from demo feeds to commercial feeds, it takes some time to load the indicators and to update the statistics. During that time, the Dashboard may display insufficient information.
You can view the statistics of the work of Kaspersky CyberTrace in flexible full-screen mode. This feature allows Kaspersky CyberTrace to fit all sections below (except the Supplier intersections table) on a single Full HD display, without scrollbars.
Specifying the statistics period
You specify the time period for displaying statistics by selecting one of the Time range options on the Dashboard tab. You can select one of the following periods:
- Day (24 hours)
- Week (7 days)
- Month (31 days)
- 3 months (93 days)
- Custom range
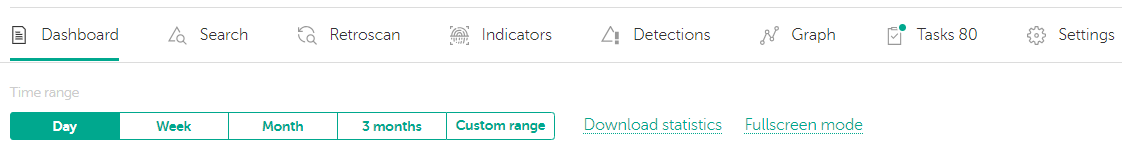
Kaspersky CyberTrace Web Dashboard. Time ranges for statistics display
When choosing the custom period, the time step of the data displayed on the diagrams of the Statistics overview section may vary depending on the number of days within the chosen period:
Chosen period | Time step |
1 to 48 hours | Hours |
49 to 720 hours | Days |
Over 720 hours | Weeks |
When choosing the period of over 720 hours (30 days):
- The left dot on the diagram may not coincide with the starting date of the chosen period, if the number of days in the chosen period is not divisible by 7.
- The value of the leftmost dot contains the total number of events/detections over the previous 7 days.
Enabling automatic data updates
You can enable automatic data updates on a regular basis by clicking the Auto-update dashboard toggle button. Kaspersky CyberTrace can automatically update all data from the Dashboard tab. Kaspersky CyberTrace updates data every minute. If you enable automatic updating and if your user account role is Analyst, the session will not expire as long as you stay on the Dashboard tab.
By default, automatic updating is disabled.
Statistics overview
This section provides an overview of detection statistics and contains the following items:
- Diagram showing the total number of incoming events
The diagram is displayed when the Incoming events button is selected.
- Diagram showing the number of detections
A line diagram displays statistics of detections on points. Such detections occurred during the specified period. The time scale is divided into hours, days, or weeks, depending on the specified period.
The diagram is displayed when the Number of detections button is selected.
- Diagram showing the number of detected indicators, for each indicator type (URL, IP address, and hash)
A line diagram displays the number of detected indicators during the specified period. The time scale is divided into hours, days, or weeks, depending on the specified period.
The diagram is displayed when the Number of detected indicators button is selected.
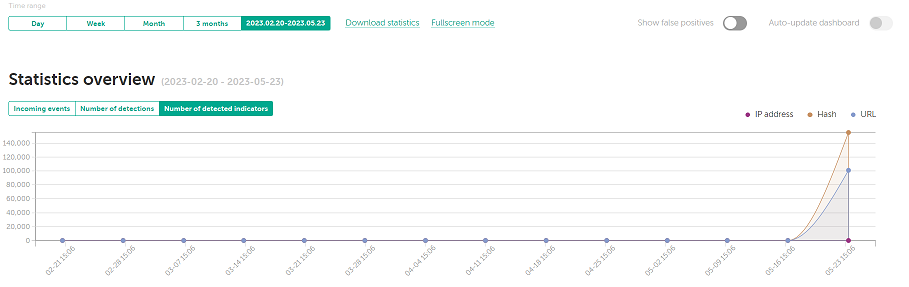
Kaspersky CyberTrace Web Dashboard. Statistics overview
Supplier statistics
This section provides detection statistics, grouped by supplier, and contains the following items:
- Table with statistics of detections for each supplier in use
The table contains the following columns with data:
- Supplier name—Names of the indicator suppliers in use
- Indicators—Number of unique indicators for all enabled suppliers
If an indicator is present in multiple suppliers, duplications of this indicator are discarded from the total number.
- A mark indicating whether the supplier is not loaded or loaded partially due to license restrictions
- False positives—Number of false positive indicators in each supplier (false positive indicators belonging to the FalsePositive supplier)
- Detected—Number of detected indicators for each supplier
- Last update date—Date and time of the last supplier update
If an error occurs during an attempt to update a supplier, Kaspersky CyberTrace will display a notification about it.
The table also gives a total for each column.
If a supplier is not loaded or is loaded only partially because of license restrictions, this supplier will be marked explicitly with a warning symbol (
 ).
). - Donut chart that presents the number of detections for each supplier in use
This donut chart is displayed when the Detected button is selected. When you hover your mouse over a slice of the ring, the supplier name, number of detections, and percentage of total detections will appear.
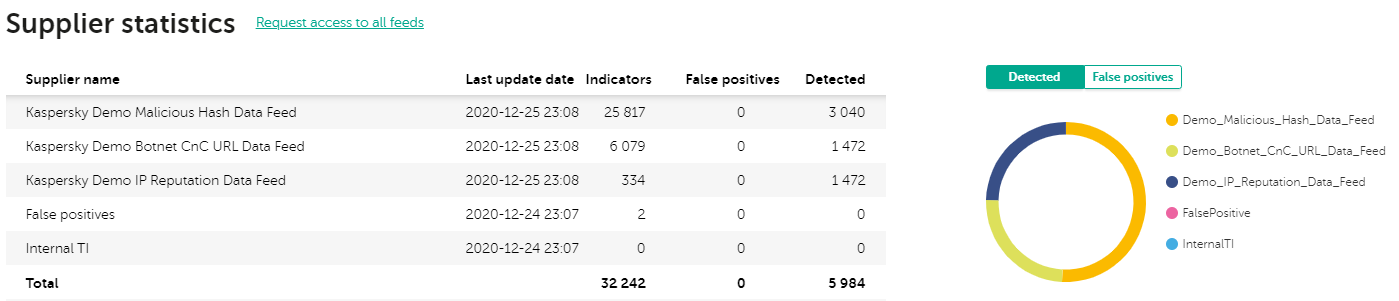
Supplier statistics
- Donut chart that presents the number of false positive indicators (indicators belonging to the FalsePositive supplier) for each supplier in use
This donut chart is displayed when the False positives button is selected. Hover your mouse over a slice of the ring: the supplier name, number of false positive indicators, and percentage of total false positive indicators will appear.
If the false positives list contains records, the Supplier statistics table has a row with False Positives in the Supplier name column and the size of the false positives list in the Indicators column. Other columns in this row contain 0.
If the Internal TI list contains records, the Supplier statistics table has a row with Internal TI in the Supplier name column and the size of the Internal TI list in the Indicators column. The Detected column in this row contains the number of detections against the Internal TI list, and the False positives column contains 0.
If you disable or remove a previously enabled supplier, this supplier will still be displayed in the table. Values in the Detected and False positives columns will reflect the number of true and false detections produced by this supplier while it was enabled, but the value in the Indicators column will always remain a hyphen (-). To check whether a supplier is disabled, hover your mouse over a string with the supplier name: if the supplier is disabled, a window with the supplier status appears.
Indicator statistics
This section provides statistics of the checked indicators and contains the following items:
- Table with the statistics of the checked indicators
The table contains the following columns with data:
- Indicator type—Different types of indicators
- Checked—Number of indicators of each type (URL, IP address, and hash) that are checked by Kaspersky CyberTrace Service
- False positives—Number of false positives of each type (URL, IP address, and hash) that are detected by Kaspersky CyberTrace Service
- Detected—Number of indicators of each type (URL, IP address, and hash) that are detected by Kaspersky CyberTrace Service
The table also gives a total for each column.
- Donut chart that presents the relative numbers of the checked indicators of each type (URL, IP address, and hash)
This donut chart is displayed when the Checked button is selected. Hover your mouse over a slice of the ring: the indicator type, number of indicators, and percentage of total will appear.
- Donut chart that presents the relative numbers of the detected indicators of each type (URL, IP address, and hash)
This donut chart is displayed when the Detected button is selected. Hover your mouse over a slice of the ring: the indicator type, number of indicators, and percentage of total will appear.
- Donut chart that presents the relative numbers of the false positives of each type (URL, IP address, and hash)
This donut chart is displayed when the False positives button is selected. Hover your mouse over a slice of the ring: the indicator type, number of false positives, and percentage of total will appear.
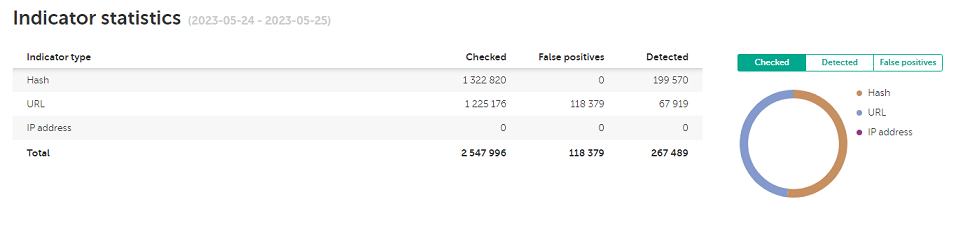
Indicator statistics
Supplier intersections table
This section shows the percentage of overlap between the suppliers used in Kaspersky CyberTrace. The table consists of rows and columns with suppliers. The intersection shows what percentage of indicators from suppliers in rows are present in suppliers in columns. If you choose to display statistics for a specific tenant, the table will show the overlap between suppliers used in this tenant.
The section does not display the FalsePositive and InternalTI indicator suppliers, and the suppliers that do not contain indicators.
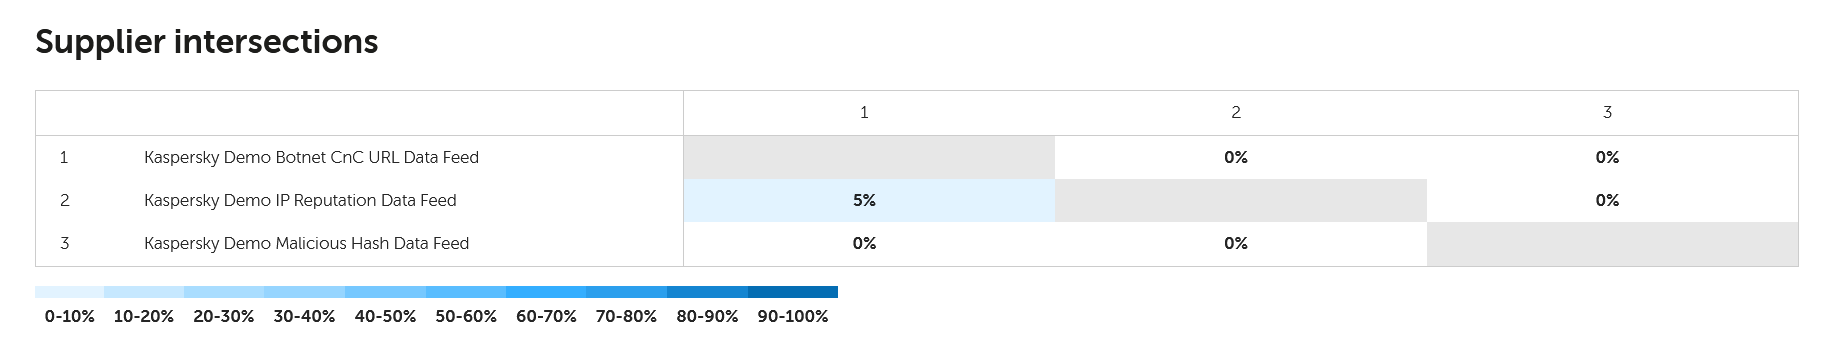
Supplier intersections
Clicking the Fullscreen mode button hides this section.
Viewing data for different tenants
In the drop-down list with all available tenants in the upper-left area of the window, you can select either a tenant for which to display statistics or the General tenant to display the overall statistics.
You can select a tenant for which to display statistics only if at least one tenant has been added.
Downloading statistics reports
You can download a detection statistics report by using the Dashboard tab. The report is an HTML file. If a particular settings tenant <tenant> is selected, the file name is CyberTrace_Statistics_<tenant>_<interval>_<date>.html.
To download a report,
Select the Download statistics link.
Note that the data displayed in the report is based on the data that is displayed on the Dashboard tab. If a particular settings tenant is selected, the settings tenant name is written in the report.
The generated file contains the following:
- Diagram with the number of detections
This diagram is displayed in the report when the Number of detections button is selected on the Dashboard tab.
- Diagram with the number of detected indicators, for each indicator type
This diagram is displayed in the report when the Number of detected indicators button is selected on the Dashboard tab.
- Table with supplier statistics
- Table with indicator statistics
- Donut chart that shows the number of detections for each supplier in use
This donut chart is displayed in the report when the Detected button is selected on the Dashboard tab.
- Donut chart that shows the number of false positives indicators for each supplier in use
This donut chart is displayed in the report when the False positives button is selected on the Dashboard tab.
- Donut chart that shows the relative numbers of the checked indicators of each type
This donut chart is displayed in the report when the Checked button is selected on the Dashboard tab.
- Donut chart that shows the relative numbers of the detected indicators of each type
This donut chart is displayed in the report when the Detected button is selected on the Dashboard tab.
- Suppliers intersections table
