Configuring Kaspersky CyberTrace for integration with FortiSIEM
April 11, 2024
ID 181633
This section describes how to configure Kaspersky CyberTrace for integration with FortiSIEM.
To configure Kaspersky CyberTrace for integration with FortiSIEM:
- Download Kaspersky CyberTrace from https://support.kaspersky.com/datafeeds/download/15920.
- Install Kaspersky CyberTrace.
- In Linux®, Kaspersky CyberTrace is installed to the
/opt/kaspersky/ktfsdirectory. - For the Windows® installation, the installation directory is hereinafter referred to as
%CyberTrace_installDir%.
- In Linux®, Kaspersky CyberTrace is installed to the
- Open the kl_feed_service.conf configuration file for edit.
- In Linux, the kl_feed_service.conf file is located in the
/opt/kaspersky/ktfs/etcdirectory. - In Windows, the kl_feed_service.conf file is located in the
%CyberTrace_installDir%\bindirectory.
You can also configure Kaspersky CyberTrace and specify the settings described in this section by using Kaspersky CyberTrace Web.
- In Linux, the kl_feed_service.conf file is located in the
- Make sure that the
Configuration > InputSettings > ConnectionStringelement contains the IP address of the computer on which Kaspersky CyberTrace will operate, and an unoccupied port (for example,9999). The IP address and port must be specified in the format%IP_address%:%port%(for example,10.43.11.15:9999). - In the kl_feed_service.conf file, add the following elements to the
Configuration > InputSetting > RegExps > Source id="default"element:<Device type="CONTEXT">[^\|]*\|([^\|]*\|[^\|]*)\|</Device>
<DeviceIp type="CONTEXT" concatenate="#1">dvc\=(\d{1,3}.\d{1,3}.\d{1,3}.\d{1,3})(?:$|\s|\,)</DeviceIp>
<UserName type="CONTEXT">user\=(.*?)(?:$|\s|\,)</UserName>
<DeviceAction type="CONTEXT">act=(.*?)(?:$|\s|\,)</DeviceAction>
- In the
Configuration > OutputSettings > AlertFormatelement, specify the following value:<![CDATA[Kaspersky Lab|Kaspersky CyberTrace|1.0|1|4|alert=%Alert%;msg=%RecordContext%]]>
If you are using Kaspersky CyberTrace Web for specifying this value, omit
<![CDATA[in the beginning and]]>in the end of the value. - In the
Configuration > OutputSettings > EventFormatelement, specify the following value:<![CDATA[Kaspersky Lab|Kaspersky CyberTrace|1.0|2|8|reason=%Category%;detected=%MatchedIndicator%;act=%DeviceAction%;dst=%RE_IP%;src=%SRC_IP%;md5=%RE_MD5%;sha1=%RE_SHA1%;sha2=%RE_SHA256%;request=%RE_URL%;dvc=%DeviceIp%;sourceServiceName=%Device%;suser=%UserName%;msg=%RecordContext%]]>
If you are using Kaspersky CyberTrace Web for specifying this value, omit
<![CDATA[in the beginning and]]>in the end of the value. - In the
Configuration > OutputSettings > ConnectionStringelement, specify the IP address of the FortiSIEM installation to which Kaspersky CyberTrace will send detection events, and port514.Specify the IP address and port in the format
%IP_address%:%port%(for example,10.43.11.43:514). - In the
Configuration > NormalizingRuleselement, specify the following rule:<Replace input="<" output=" <" />
You can also create this rule by using Kaspersky CyberTrace Web as follows:
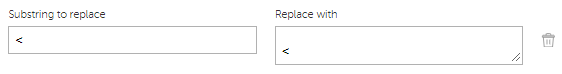
Normalization rule for FortiSIEM events
- Restart Kaspersky CyberTrace Service, which is one of the modules of Kaspersky CyberTrace, by running the following command:
/opt/kaspersky/ktfs/etc/init.d/kl_feed_service restart(in Linux)%CyberTrace_installDir%\bin\kl_control.bat restart(in Windows)
Viewing the format of forwarded events in FortiSIEM
The procedure above assumes that universal regular expressions are used for extracting IP addresses, URLs, and hashes from events sent from FortiSIEM. You may have to change these and other regular expressions depending on the format of the events. For example, you may have to do this for extracting from an event the user name or other data that will later be inserted in a detection event and sent to FortiSIEM. Before editing the existing regular expressions or adding new ones you have to analyze the original events arrived in Kaspersky CyberTrace.
You can also browse these events in Kaspersky CyberTrace Web. After you configure the event forwarding in FortiSIEM, in Kaspersky CyberTrace Web select the Settings → Matching tab, and then the Event parsing rules section will display the events that arrive in Kaspersky CyberTrace.
To view the format of events in FortiSIEM:
- On the FortiSIEM web console, select the Analytics tab.
- Click inside the Edit Filters and Time Range text field.
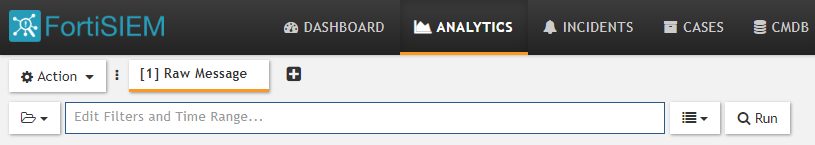
Selecting FortiSIEM events
The Filters form appears which allows you to set a filter and time range for events.
- Specify the filter for desired events.
For example, you can specify the IP address of the device from which the events arrive in FortiSIEM (the
Reporting IPattribute). Also, in the Time settings group you can specify the time range for the events (for example, last 10 minutes), or specify that events are to be displayed in real time.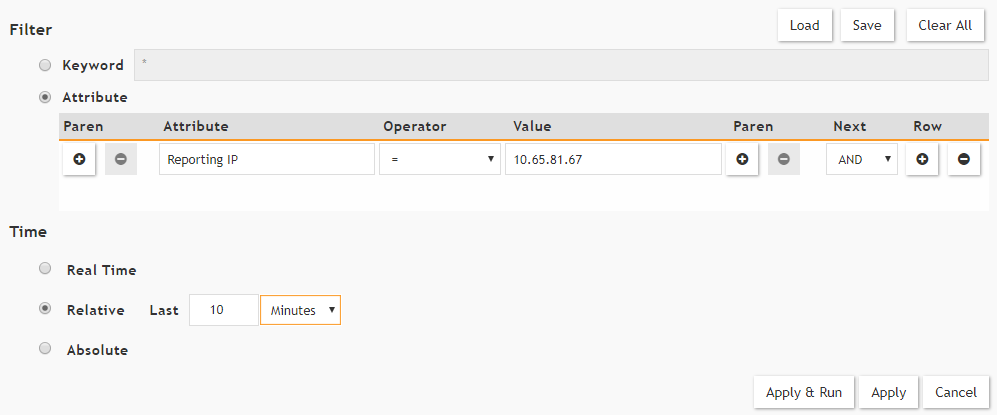
Setting the filter for FortiSIEM events
- Click the Save & Run button.
The Raw Event Log column contains events in the same format in which they are forwarded from FortiSIEM to CyberTrace.
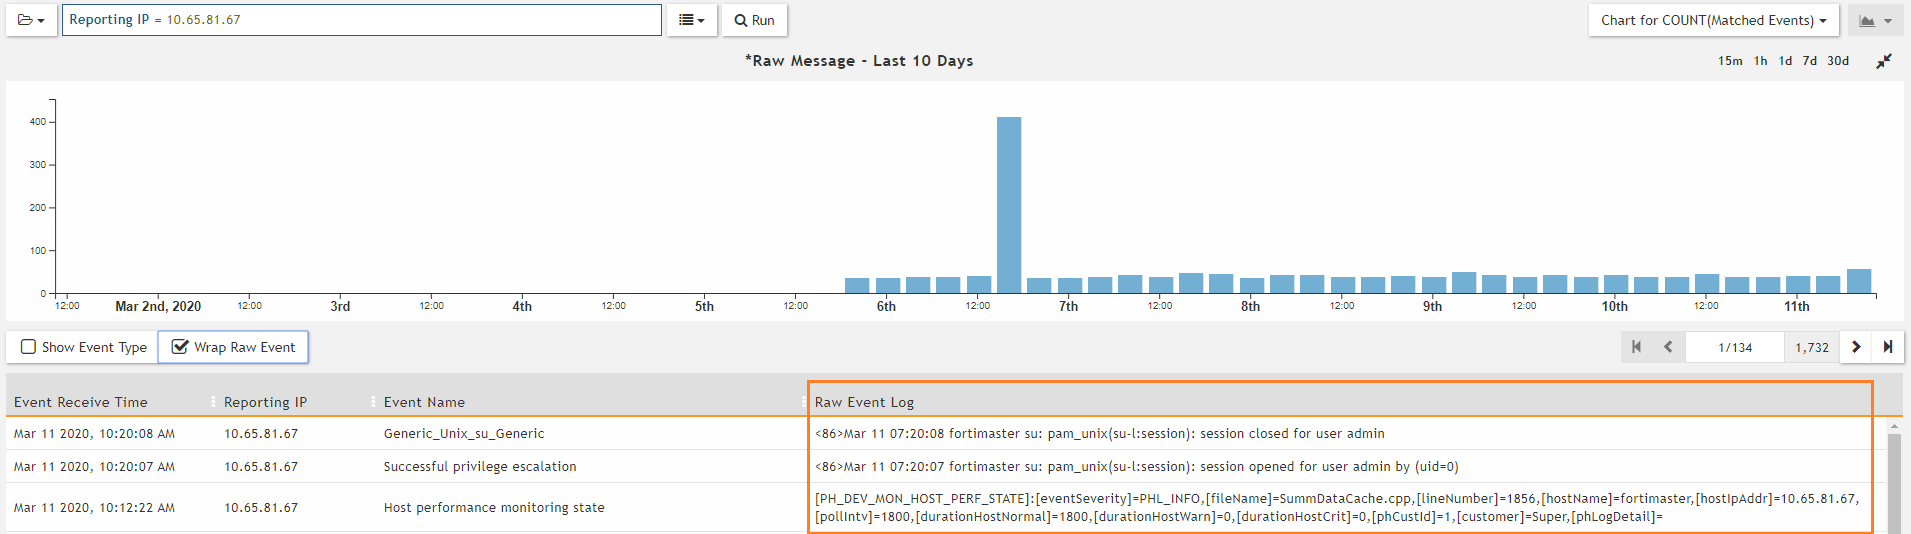
FortiSIEM events displayed
For more information about requesting events on the Analytics tab, visit http://help.fortinet.com/fsiem/5-1-1/Online-Help/HTML5_Help/Viewing_real_time_search_results.htm.
