Step 7 (optional). Displaying events in a dashboard
April 11, 2024
ID 167610
A QRadar dashboard presents detection results in visual format. For example, a chart displays the ratio of the number of events of different types.
QRadar 7.2.6 Patch 3 or later is required. Using an earlier version can lead to incorrect results.
Adding a chart that displays the detection results of Kaspersky CyberTrace Service in visual format involves three procedures:
- Create an event search.
- Add a chart to a dashboard.
- Adjust the added chart.
Creating an event search
The following procedure describes how to create an event search.
To create an event search:
- In QRadar Console, select the Log Activity tab.
- Select Search > New Search.
- In the Column Definition form, delete
Event Namefrom the Available Columns list and addEvent Nameto the Group By list.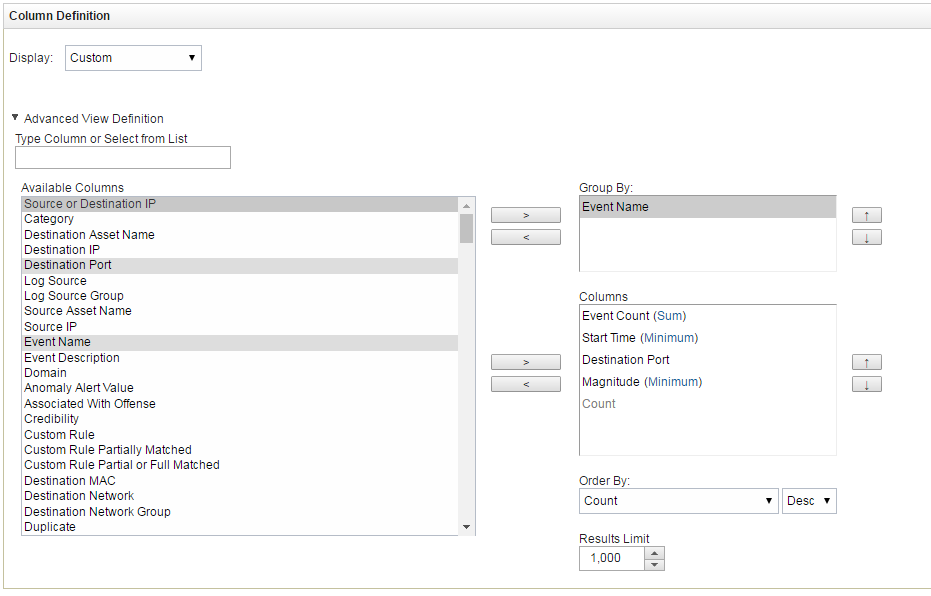
Defining columns
- Scroll down the page and in the Search Parameters form, set
KL_Threat_Feed_Service_v2as the log source:- In the Parameter drop-down list, select
Log Source [Indexed]. - In the Operator drop-down list, select
Equals. - In the Log Source list, select
KL_Threat_Feed_Service_v2.The selection
KL_Threat_Feed_Service_v2is the log source name that is set in the detection events format and alert events format parameters on the Events format tab of Kaspersky CyberTrace Web. - Click the Add Filter button.
The
Log Source is KL_Threat_Feed_Service_v2string will be added to the Current Filters list.
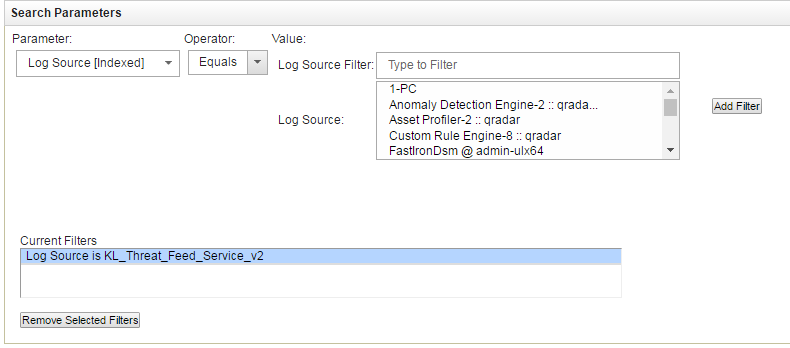
Setting the log source
- In the Parameter drop-down list, select
- Click either the Filter button or the Save button to display the search result.
- Click the Save Criteria button.

Save Criteria button
- In the Save Criteria form, select the Include in my Dashboard check box, type the name of the search in the Search Name text box, and then click OK.
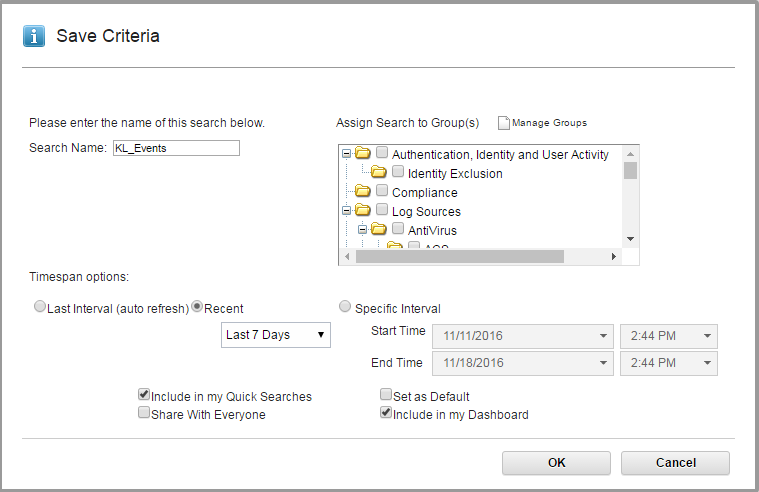
Saving criteria
Adding a diagram to a dashboard
The following procedure describes how to add a diagram to a dashboard.
To add a diagram to a dashboard:
- In QRadar Console, select the Dashboard tab.
- Select Add Item > Log Activity > Event Searches > KL_Events.
Here,
KL_Eventsis the name of the search that you set.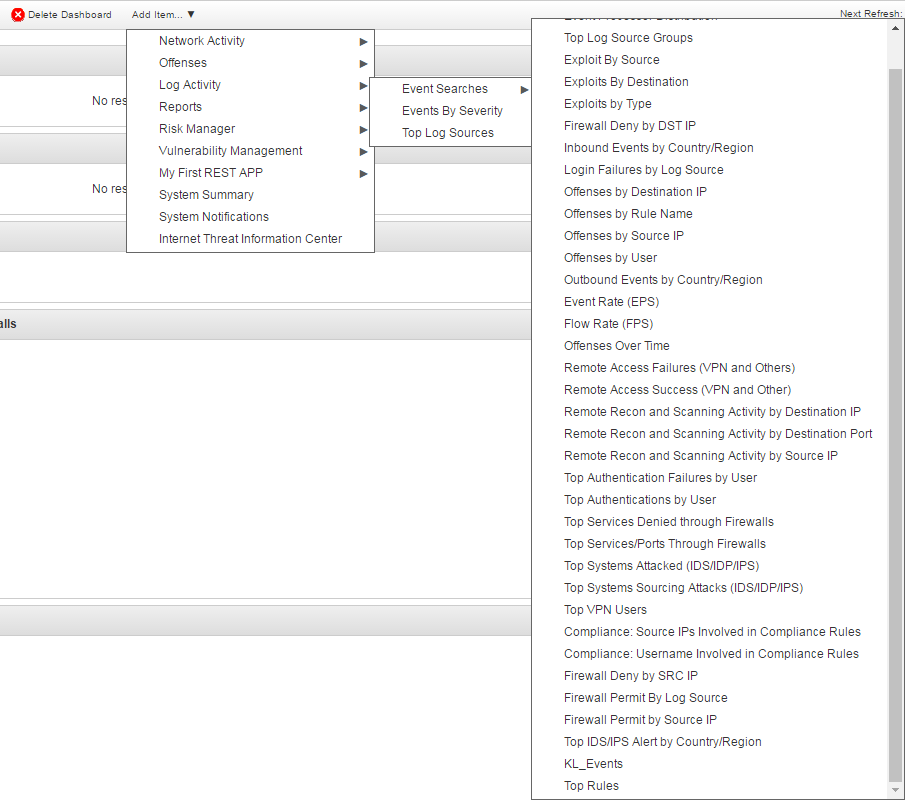
Adding an item to the dashboard
A chart will appear on the dashboard.
New chart
Adjusting the added chart
The following procedure describes how to adjust the chart that has been added to the dashboard.
To adjust the added chart:
- Click the Settings button (
 ) in the upper-right corner of the chart box.
 - Specify the settings of the chart.
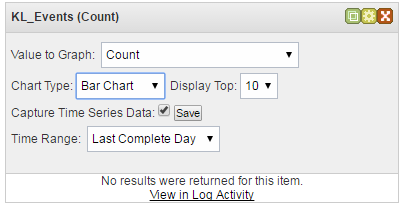
Chart settings
If you select the Capture Time Series Data check box, the chart will display all incoming data received after this check box is selected; the item selected in the Time Range drop-down list will be ignored. If you clear the Capture Time Series Data check box, only the information received during the time range selected in the Time Range drop-down box will be displayed.
After events arrive, the chart displays them.
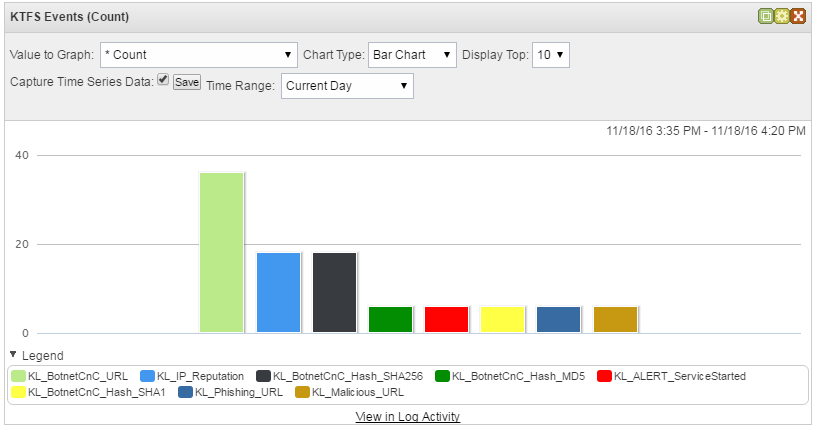
Bar chart
In the Chart Type drop-down list you can select the type of chart in which the data will be displayed.
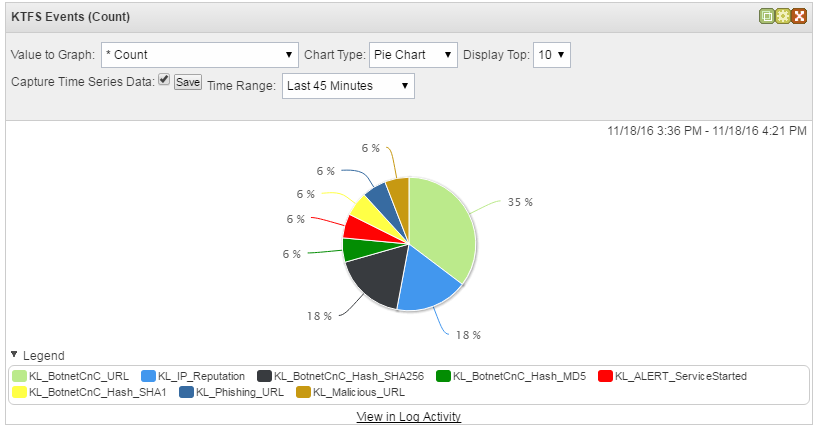
Pie chart
You can also get information about charts, which are based on the search results, from QRadar Help (section "Dashboard management" > "Adding search-based dashboard items to the Add Items list").
