Step 2 (optional). Configuring Kaspersky CyberTrace App (single-instance deployment)
April 11, 2024
ID 165691
Kaspersky CyberTrace App reads its parameters from the configuration files. These configuration files define input settings, output settings, and the event format used by Kaspersky CyberTrace App.
Restart Splunk after you have made changes to the Kaspersky CyberTrace App configuration files.
Edit only those Kaspersky CyberTrace App configuration files that are described in this section. Editing other Kaspersky CyberTrace App configuration files may result in unpredictable behavior.
About the configuration files
The following configuration files can be used to configure Kaspersky CyberTrace App ($SPLUNK_HOME is the Splunk installation directory):
$SPLUNK_HOME/etc/apps/Kaspersky-CyberTrace-App-for-Splunk/default/commands.confThis configuration file specifies the command for the lookup script.
$SPLUNK_HOME/etc/apps/Kaspersky-CyberTrace-App-for-Splunk/default/inputs.confThis configuration file specifies the Kaspersky CyberTrace App input settings. This includes ports and addresses for data from event sources and for incoming detection events from Kaspersky CyberTrace Service.
$SPLUNK_HOME/etc/apps/Kaspersky-CyberTrace-App-for-Splunk/default/outputs.confThis configuration file specifies the parameters for forwarding events to Kaspersky CyberTrace Service.
$SPLUNK_HOME/etc/apps/Kaspersky-CyberTrace-App-for-Splunk/default/props.confThis configuration file specifies the parameters for processing input data.
$SPLUNK_HOME/etc/apps/Kaspersky-CyberTrace-App-for-Splunk/default/savedsearches.confThis configuration file specifies the parameters for alert templates.
Default commands.conf file
This file specifies the lookup script that Kaspersky CyberTrace App will use when the user runs the klsearch command.
Below, you can view the default contents of the commands.conf configuration file.
[klsearch] filename = kl_search.py |
Default inputs.conf file
This file specifies input settings for Kaspersky CyberTrace App.
By default, Kaspersky CyberTrace App does the following:
- It receives detection events from Kaspersky CyberTrace Service at address
:9998. - It receives data from sources at address
:3000(and then forwards it to address127.0.0.1:9999, which is specified in outputs.conf).
Below, you can view the default contents of the inputs.conf configuration file.
[tcp://:9998] _INDEX_AND_FORWARD_ROUTING=local connection_host = dns index = main sourcetype = kl_cybertrace_events source = tcp:9998 disabled = false
[tcp://:3000] _TCP_ROUTING = service9999 |
Default outputs.conf file
This file specifies the output settings for Kaspersky CyberTrace App.
By default, Kaspersky CyberTrace App forwards data from the address :3000 to the Kaspersky CyberTrace Service at the address 127.0.0.1:9999. The input port (:3000) is specified in inputs.conf.
Below, you can view the default contents of the outputs.conf configuration file.
[tcpout] defaultGroup = noforward disabled = false
[indexAndForward] index=true
[tcpout:service9999] disabled=false server = 127.0.0.1:9999 sendCookedData = false |
Default props.conf file
This file specifies how Splunk processes incoming data.
By default, Kaspersky CyberTrace App does the following:
- It defines how time stamps are extracted from incoming data.
- It defines a delimiter (line breaker) between events for incoming data.
For example, if the incoming data has the sequence
"%data_1%\n\n%data_2%"and the line breaker is one or more\nsymbols, Splunk splits this sequence into two events (%data_1%and%data_2%).
Below, you can view the default contents of the props.conf configuration file.
[source::tcp:3000] TIME_PREFIX = ^ MAX_TIMESTAMP_LOOKAHEAD = 17 TIME_FORMAT = %b %d %H:%M:%S LINE_BREAKER = ([\n]+) SHOULD_LINEMERGE = false
[source::tcp:9998] TIME_PREFIX = ^ MAX_TIMESTAMP_LOOKAHEAD = 17 TIME_FORMAT = %b %d %H:%M:%S LINE_BREAKER = ([\n]+) SHOULD_LINEMERGE = false |
Managing event sources
You can change the port Kaspersky CyberTrace App listens on for incoming events from a source, or add new event sources.
To change the port Kaspersky CyberTrace App listens on for incoming events from a source:
- In inputs.conf, change the default port number
3000to the port number that you want.For example, if you want to change
3000to3010, the record in inputs.conf looks like the following:[tcp://:3010]
_TCP_ROUTING = service9999
- In props.conf, also change the default port number 3000 to the port number that you want.
For example, if you want to change
3000to3010, the record in props.conf looks like the following:[source::tcp:3010]
TIME_PREFIX = ^
MAX_TIMESTAMP_LOOKAHEAD = 17
TIME_FORMAT = %b %d %H:%M:%S
LINE_BREAKER = ([\n]+)
SHOULD_LINEMERGE = false
- Restart Splunk.
To add a new event source:
- In inputs.conf, specify a new event source that uses the
service9999TCP routing rule.All data from this input will be forwarded to Kaspersky CyberTrace Service.
- In props.conf, specify how data from this source must be processed.
- Restart Splunk.
Make sure that data from the new event source matches the regular expressions used by Kaspersky CyberTrace.
Below is an example of adding the address :3001 as the event source; it specifies that data from :3001 must be processed as are other input data in the default integration scheme (in this scheme, the forwarder, indexer, and search head are installed on a single computer).
# to inputs.conf [tcp://:3001] _TCP_ROUTING = service9999
# to props.conf [source::tcp:3001] TIME_PREFIX = ^ MAX_TIMESTAMP_LOOKAHEAD = 17 TIME_FORMAT = %b %d %H:%M:%S LINE_BREAKER = ([\n]+) SHOULD_LINEMERGE = false |
Changing the address and port for data from Kaspersky CyberTrace Service
By default, Kaspersky CyberTrace App is configured to receive data from Kaspersky CyberTrace Service at port 9998 at any available address. This is specified in the inputs.conf configuration file of Kaspersky CyberTrace App. If you want to receive data from Kaspersky CyberTrace Service only at a specific address and port (for example, if Splunk has access to several network interfaces), edit the inputs.conf file accordingly.
Use the following rules to specify the address and port where data from Kaspersky CyberTrace Service must be received by Kaspersky CyberTrace App:
- If Kaspersky CyberTrace Service and Splunk are located on the same computer, use the following format to specify the port where data from Kaspersky CyberTrace Service must be received by Kaspersky CyberTrace App:
[tcp://127.0.0.1:<port>] - If Kaspersky CyberTrace Service and Splunk are located on different computers, use the following format to specify the address and port where data from Kaspersky CyberTrace Service must be received by Kaspersky CyberTrace App:
[tcp://<address>:<port>] - To specify that Kaspersky CyberTrace App will receive data from Kaspersky CyberTrace Service at any available address, use the following format:
[tcp://:<port>]Note that this format can affect security, because Kaspersky CyberTrace App will receive information at the specified port of every available network interface.
In the format examples above, <address> and <port> are the IP address and port that Kaspersky CyberTrace App will listen on for incoming data from Kaspersky CyberTrace Service.
You may also have to change the addresses and ports for outbound events used by Kaspersky CyberTrace.
Below are examples of specifying the address and port where data from Kaspersky CyberTrace Service is to be received.
In the following example, Kaspersky CyberTrace Service and Splunk are located on the same computer. Kaspersky CyberTrace App receives detection events at port 9998 port of that same computer.
[tcp://127.0.0.1:9998] _INDEX_AND_FORWARD_ROUTING=local connection_host = dns index = main sourcetype = kl_cybertrace_events source = tcp:9998 disabled = false |
In the following example, Kaspersky CyberTrace Service and Splunk are located on different computers. Kaspersky CyberTrace App receives detection events from Kaspersky CyberTrace Service at address 192.0.2.42:9997.
[tcp://192.0.2.42:9997] _INDEX_AND_FORWARD_ROUTING=local connection_host = dns index = main sourcetype = kl_cybertrace_events source = tcp:9997 disabled = false |
In the following example, Kaspersky CyberTrace App receives detection events from Kaspersky CyberTrace Service at port 3000 of any available address.
[tcp://:3000] _INDEX_AND_FORWARD_ROUTING=local connection_host = dns index = main sourcetype = kl_cybertrace_events source = tcp:3000 disabled = false |
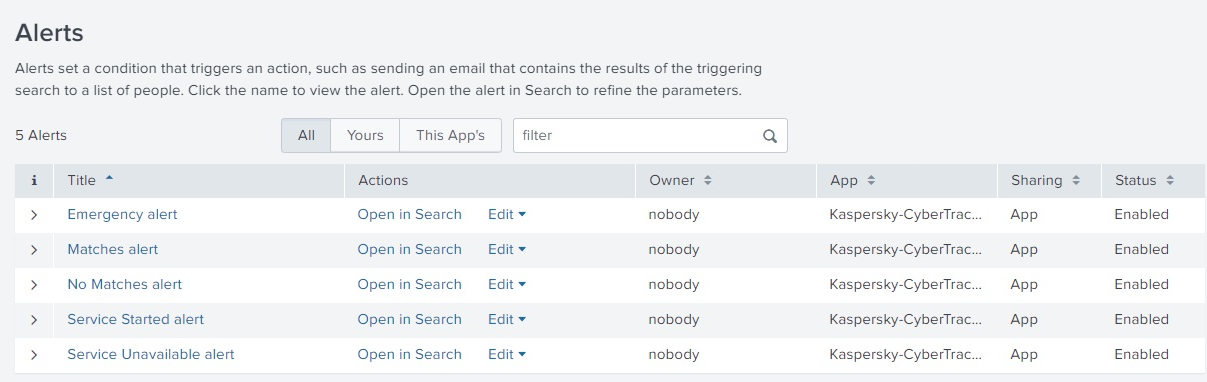
Configuring alert templates
Kaspersky CyberTrace App comes with several alert templates that you can use and customize from the Alerts dashboard.
The following alert templates are available:
- Matches alert
This alert is triggered if there were matches with Kaspersky Threat Data Feeds in the past 24 hours.
- No Matches alert
This alert is triggered if there were no matches with Kaspersky Threat Data Feeds in the past 24 hours.
- Emergency alert
This alert is triggered if there were 5000 matches with Kaspersky Threat Data Feeds in the course of one minute.
- Service Unavailable alert
This alert is triggered if Kaspersky CyberTrace Service is unavailable.
- Service Started alert
This alert is triggered when Kaspersky CyberTrace Service is started.
Following are the default Kaspersky CyberTrace App settings:
- All of the alerts included in Kaspersky CyberTrace App are turned on.
To turn them off, use the Alerts dashboard.
- The "Add to Triggered Alerts" action is defined for all alerts.
Splunk will display the alert in Triggered Alerts.
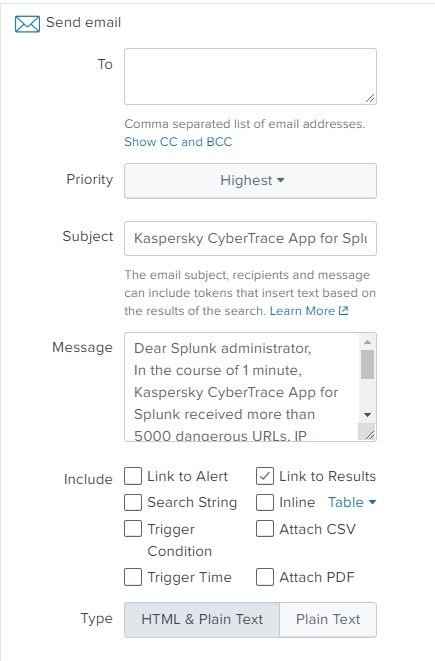
To enable email notifications for alerts:
- In Kaspersky CyberTrace App, open Alerts.
- Expand the parameters of an alert that you want to configure.
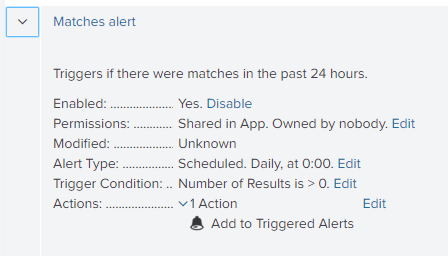
- Locate the Actions field, and then click Edit.
- Under Trigger Actions, click Add Actions.
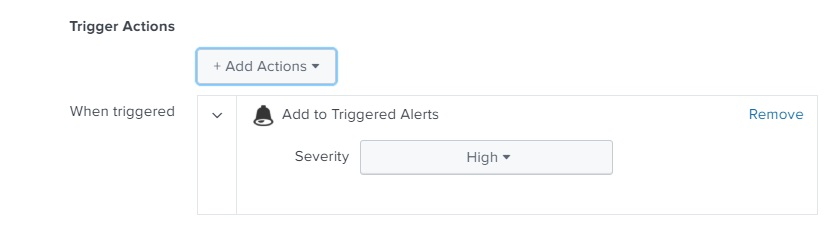
- From the list of options, select Send email.
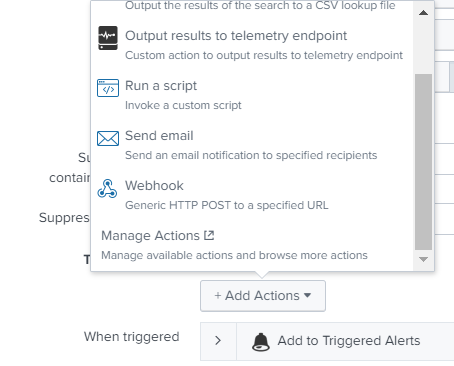
- Enter the email message parameters and save the changes.