Creating a dashboard
Creating a dashboard
April 11, 2024
ID 167819
This section describes how you can create a dashboard in RSA NetWitness by using the Kaspersky CyberTrace Service rules.
To create a dashboard in RSA NetWitness:
- On the RSA NetWitness menu, select Dashboard > Reports. (In RSA NetWitness 11, select Monitor > Reports.)
- Select the rule that you will use to create a report (for example, the
CyberTrace Top 10 URLsreport). - For the selected rule, click the Settings split button (
 ), and then select the Create Chart action.
The Build Chart window opens.
- Specify the following data:
- Chart name
- Data source
Specify the data source that issues Kaspersky CyberTrace Service events.
- Update period
- Data limit
For example, for charts containing TOP 10 objects, specify
10.
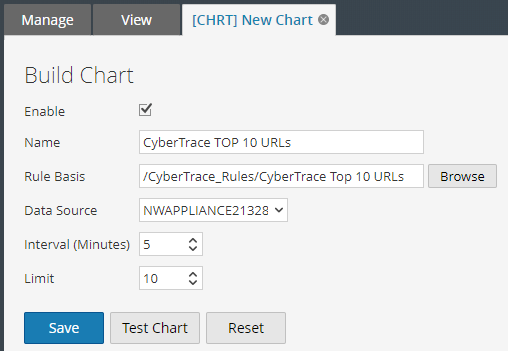
Build Chart window
- Click Save.
- Activate the Dashboard form. (In RSA NetWitness 11, select Monitor > Overview instead.)
- The action performed in this step depends on the RSA NetWitness version.
- In RSA NetWitness 10, click the New split button (
 ), and then select Add Dashlet.
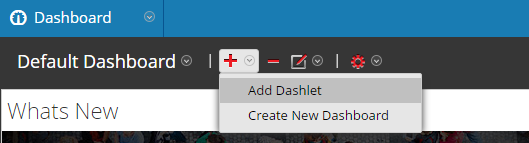
Adding a dashlet window
- In RSA NetWitness 11, do the following:
- Click the Add Row split button, and then select the type of new row that you want.
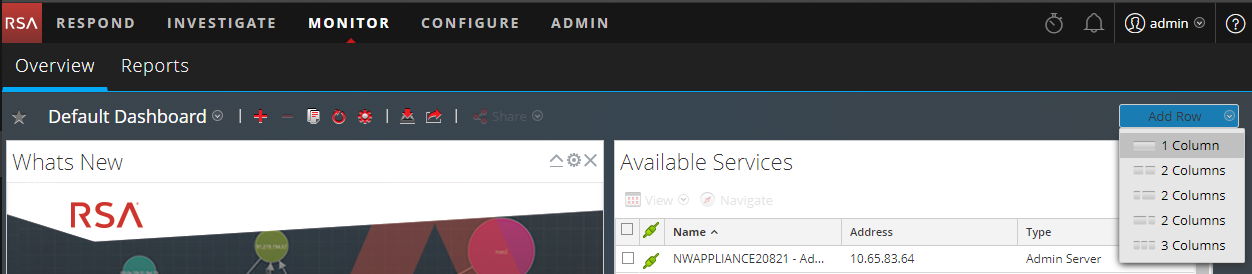
Adding a row
- In the cell that appears, click the Add Dashlet button (
 ).
).In the figure below, the cell is shown enclosed in a dotted line.
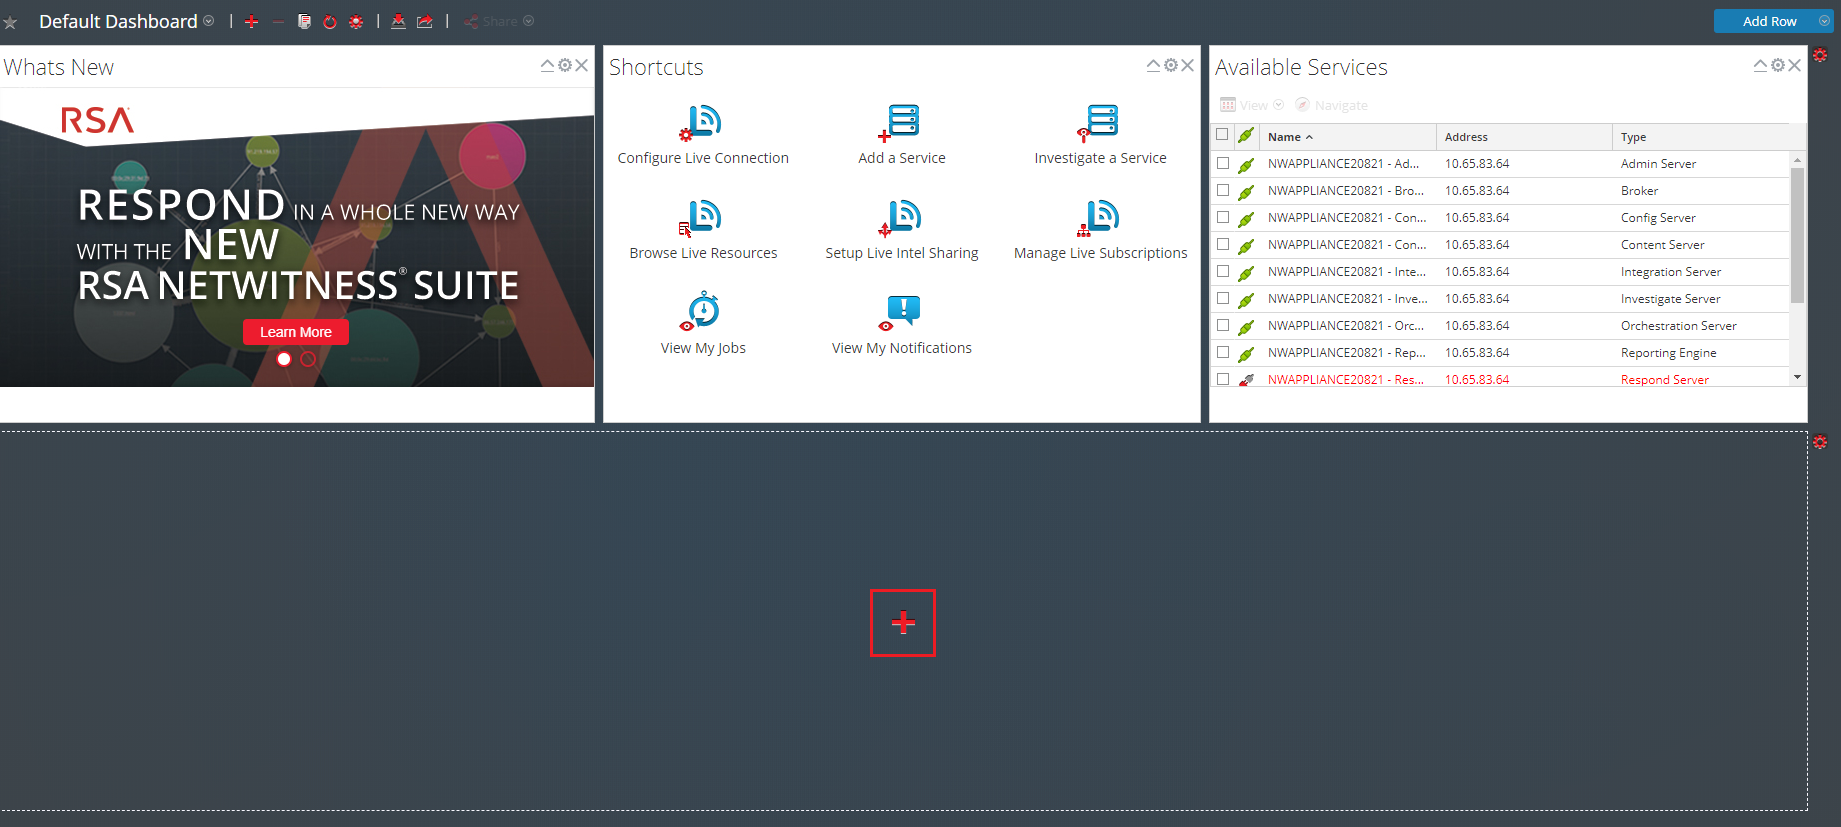
Adding a dashlet
The Add a Dashlet window opens.
- In RSA NetWitness 10, click the New split button (
- Specify the following information:
- The
Reports Realtime Chartas the dashlet type - The chart to display (in this case, it is
CyberTrace Top 10 URLs) - Dashlet name
- Chart type (in this case, it is a column)
- Period up to the present during which the data to be displayed is prepared
- Dashlet update period
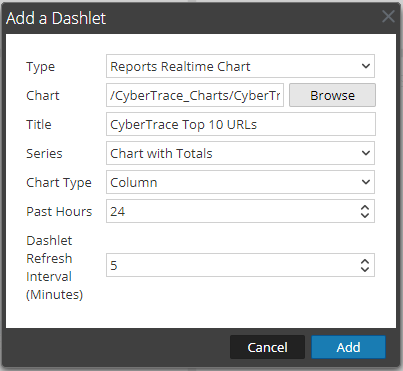
Add a Dashlet window
- The
- Click the Add button.
Did you find this article helpful?
What can we do better?
Thank you for your feedback! You're helping us improve.
Thank you for your feedback! You're helping us improve.
