Contents
- About Kaspersky CyberTrace
- Installation and integration guides
- Installation and integration overview
- Hardware and software requirements
- Distribution kit contents
- Part 1: Installing Kaspersky CyberTrace
- Part 2: Integrating Kaspersky CyberTrace with an event source
- Integration with Splunk
- Integration steps (Splunk)
- Single-instance integration (Splunk)
- About the single-instance integration scheme
- Step 1. Installing Kaspersky CyberTrace App (single-instance deployment)
- Step 2 (optional). Configuring Kaspersky CyberTrace App (single-instance deployment)
- Step 3 (optional). Configuring the lookup script (single-instance deployment)
- Step 4. Performing the verification test (Splunk, single-instance integration)
- Distributed integration scheme (Splunk)
- About the distributed integration scheme
- Step 1. Installing Forwarder and Search Head apps
- Step 2. Configuring Forwarder and Search Head apps (distributed deployment)
- Step 3 (optional). Configuring the lookup script (distributed deployment)
- Step 4. Performing the verification test (Splunk, distributed integration)
- Integration with ArcSight
- Integration steps (ArcSight)
- Before you begin (ArcSight)
- Standard integration (ArcSight)
- Integration schemes (ArcSight)
- Step 1. Importing the ARB package
- Step 2. Installing ArcSight Forwarding Connector
- Step 2 (alternative). Installing ArcSight Forwarding Connector by using the console
- Step 3. Configuring CyberTrace for interaction with ArcSight
- Step 4. Performing the verification test (ArcSight)
- Integration with QRadar
- Integration steps (QRadar)
- Standard integration (QRadar)
- About the standard integration scheme (QRadar)
- Step 1. Configuring QRadar to receive latest updates
- Step 2. Sending a set of events to QRadar
- Step 3. Forwarding events from QRadar to Feed Service
- Step 4. Performing the verification test (QRadar)
- Step 5. Retrieving custom event properties
- Step 6. Creating a search filter for CyberTrace events
- Step 7 (optional). Displaying events in a dashboard
- Step 8 (optional). Creating notifications about incoming service events
- Step 9 (optional). Installing Kaspersky Threat Feed App
- Step 10 (optional). Enabling the indexes of the added custom event properties
- Step 11 (optional). Configuring Kaspersky Threat Feed App
- Integration with RSA NetWitness
- Integration steps (RSA NetWitness)
- Before you begin (RSA NetWitness)
- Standard integration (RSA NetWitness)
- About the standard integration scheme (RSA NetWitness)
- Step 1. Forwarding events from RSA NetWitness
- Step 2. Sending events from Feed Service to RSA NetWitness
- Step 3 (optional). Importing a meta group for browsing fields filled by Feed Service
- Step 4 (optional). Importing Feed Service rules to RSA NetWitness
- Step 5 (optional). Importing a preconfigured report to RSA NetWitness
- Step 6 (optional). Importing preconfigured charts and a dashboard to RSA NetWitness
- Step 7. Performing the verification test (RSA NetWitness)
- Integration with LogRhythm
- Step 1. Adding a Custom Log Source type
- Step 2. Importing Kaspersky CyberTrace rules and events
- Step 3 (optional). Adding Kaspersky CyberTrace events
- Step 4 (optional). Adding Kaspersky CyberTrace rules
- Step 5. Adding Kaspersky CyberTrace policy
- Step 6. Adding a log source to System Monitor Agent
- Step 7. Configuring log forwarding to Kaspersky CyberTrace
- Step 8 (optional). Performing the verification test
- Step 9 (optional). Creating alerts about incoming Kaspersky CyberTrace service events
- Step 10 (optional). Displaying alert events in LogRhythm
- Integration with KUMA
- Integrating with other SIEM and non-SIEM solutions
- Extra integration scenarios
- Integration with Splunk
- User guides
- Using Kaspersky CyberTrace Web
- Application for Splunk
- Application for QRadar
- Working with events in ArcSight
- Working with events in RSA NetWitness
- Log Scanner Guide
- Administrator guides
- Managing Kaspersky CyberTrace Web
- Working with default credentials
- Service settings
- Feeds settings
- Importing a certificate for Kaspersky Threat Data Feeds
- Specifying the feeds update period
- Enabling and disabling feeds
- Selecting available fields for a feed
- Adding actionable fields to a feed
- Specifying filtering rules for a feed
- Truncating a feed
- Launching a feeds update manually
- About custom, third-party, and Kaspersky feeds
- Adding a custom or third-party feed
- Configuring a custom or third-party feed
- Managing false positives
- Matching process settings
- Event format settings
- User settings
- Logging settings
- Licensing settings
- Tenants settings
- Indicators export settings
- Retrospective scan settings
- Feed Service Guide
- About Feed Service
- Managing Feed Service
- Feed Service configuration reference
- Feed Service logging
- About resending detection events
- Feed Service in ReplyBack mode
- Features of event processing by Feed Service
- Limitations on Feed Service incoming events
- Feed Utility guide
- Using Password Utility
- Choosing the best feeds for your environment
- Upgrading and managing the installation
- Managing the installation on Linux systems
- Managing the installation on Windows systems
- Upgrading Kaspersky CyberTrace from a previous version
- About the upgrade process
- Upgrading automatically from 3.1 to 4.0 (Linux)
- Upgrading automatically from 3.1 to 4.0 (Windows)
- Upgrading Kaspersky CyberTrace integration (QRadar)
- Upgrading Kaspersky CyberTrace integration (Splunk)
- Upgrading Kaspersky CyberTrace integration (ArcSight)
- Upgrading Kaspersky CyberTrace integration (RSA)
- Upgrading Kaspersky CyberTrace integration (LogRhythm)
- Uninstalling Kaspersky CyberTrace
- Adding self-signed SSL certificates for CyberTrace Web
- Watchdog module workflow
- Testing the connection with Feed Service and the availability of feeds
- Managing Kaspersky CyberTrace Web
- Developer guides
- REST API reference
- Troubleshooting
- Risk mitigation
- How to get technical support
- Copyright
- Information about third-party code
- Trademark notices
About Kaspersky CyberTrace
Welcome to Kaspersky CyberTrace documentation.
What is Kaspersky CyberTrace
Kaspersky CyberTrace is a threat intelligence fusion and analysis tool that integrates threat data feeds with SIEM solutions so that users can immediately leverage threat intelligence for security monitoring and IR activities in their existing security operations workflow.
Kaspersky CyberTrace uses continuously updated threat data feeds to identify existing breaches or newly launched attacks, and to inform your business or clients about the risks and implications associated with the threat.
Kaspersky CyberTrace integrates with threat intelligence sources (threat intelligence feeds from Kaspersky, other vendors, OSINT, or even custom sources), SIEM solutions, and log sources. As indicators of compromise (IoC) from the threat intelligence feeds are found in your environment, Kaspersky CyberTrace automatically sends alerts to SIEM solutions for ongoing monitoring, validation, and discovery of additional contextual evidence for ongoing security incidents. Kaspersky CyberTrace provides analysts with a set of instruments for conducting alert triage and response through categorization and assessment of identified matches.
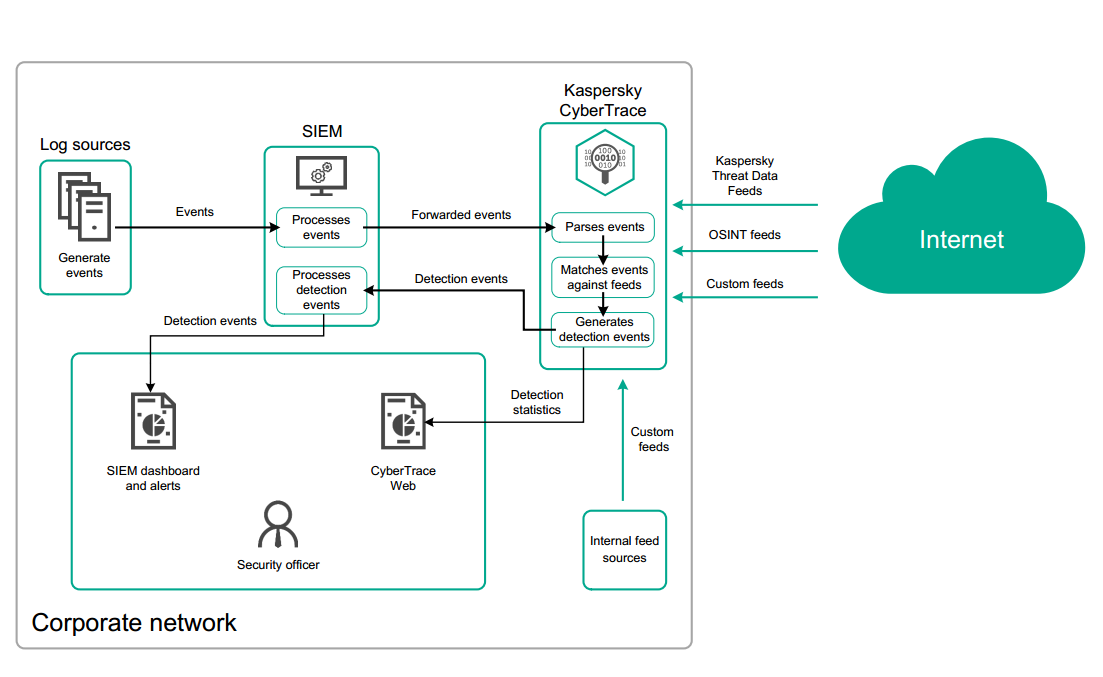
Kaspersky CyberTrace inside a corporate network
Features of Kaspersky CyberTrace:
- Automatic high-performance matching of incoming logs and events with Kaspersky Threat Data Feeds, OSINT feeds, or any other custom feeds in the most popular formats (JSON, STIX, XML, CSV, MISP). Demo feeds from Kaspersky and OSINT are available out of the box.
- Internalized process of parsing and matching incoming data significantly reduces SIEM solution load. Kaspersky CyberTrace parses incoming logs and events, matches the resulting data to feeds, and generates its own alerts on threat detection. Consequently, a SIEM solution has to process less data.
- Generates feed usage statistics for measuring the effectiveness of feeds.
- In-depth threat investigation by using on-demand search of indicators (hashes, IP addresses, domains, URLs). Bulk scanning of logs and files is also supported.
- Universal approach to integration of threat matching capabilities with SIEM solutions and other security controls. SIEM connectors for a wide range of SIEM solutions can be used to visualize and manage data about threat detections.
- IoC and related context are efficiently stored in RAM for rapid access and filtering.
- Kaspersky CyberTrace Web, a web user interface for Kaspersky CyberTrace, provides data visualization, on-demand IoC search functionality, and access to Kaspersky CyberTrace configuration. Kaspersky CyberTrace Web also supports the management of feeds, log parsing rules, Internal TI and false positives lists, and event sources.
- Command-line interface for Windows and Linux platforms.
- Advanced filtering for feeds and log events. Feeds can be converted and filtered based on a broad set of criteria such as time, popularity, geographical location, and threat type. Log events can be filtered based on custom conditions.
- DMZ integration support. The computer on which event data is matched against feeds can be located in DMZ and isolated from the Internet.
- In standalone mode, where Kaspersky CyberTrace is not integrated with a SIEM solution, Kaspersky CyberTrace receives logs from various sources such as networking devices, processes these logs according to the defined normalizing rules, and parses the logs according to the defined regular expressions.
- Export lookup results that match feeds to CSV format for integration with other systems (firewalls, network and host IDS, custom tools).
- Exposes obfuscation techniques used by some threats to hide malicious activities in logs.
The main parts of Kaspersky CyberTrace are Feed Service, Feed Utility, Log Scanner, and Kaspersky CyberTrace Web.
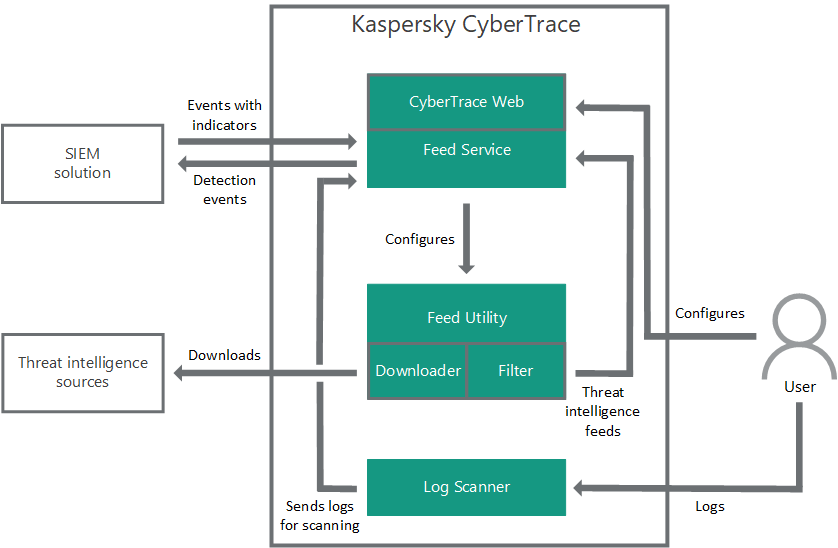
Main components of Kaspersky CyberTrace
Documentation contents
This documentation is divided into several chapters:
- Installation and integration guides
This chapter provides guides about installing Kaspersky CyberTrace, integrating it with SIEM solutions and event sources, and configuring Kaspersky CyberTrace after the integration is completed.
For a starting point of the installation and integration process, see Getting started.
- User guides
This chapter provides information about Kaspersky CyberTrace Web, which is a web interface of Kaspersky CyberTrace, and about apps and dashboards that provide access to Kaspersky CyberTrace from a SIEM solution.
- Administrator guides
This chapter provides information about managing Kaspersky CyberTrace and covers advanced topics of Kaspersky CyberTrace usage. Descriptions of Kaspersky CyberTrace components and workflow of these components can also be found in this chapter.
- Troubleshooting
This section provides solutions to common problems encountered while using Kaspersky CyberTrace.
- Risk mitigation
This section provides guidelines for mitigating potential security risks when working with Kaspersky CyberTrace.
What's new
Kaspersky CyberTrace offers the following new features and improvements:
What's new in version 4.0
- A database of indicators with full text search capability and the ability to search by using advanced search queries was added to enable complex searches across all indicator fields, including the context fields. The ability to filter results by Intelligence supplier simplifies the process of analyzing threat intelligence data.
- Pages with detailed information about each indicator were added for deeper analysis. Each page presents all information about an indicator from all threat intelligence suppliers (deduplication) and allows analysts to discuss threats in comments, as well as add internal threat intelligence about the indicator. If the indicator was detected, information about detection dates and links to the detections list will be available.
- Storage for detections was added to simplify the security monitoring and alerts triage processes. The raw event from the source and full information about the detection are saved to the database, for future analysis. The detection list supports searching saved data, to find all detections by threat, source IP address, user name, or any other field.
- An indicators export feature was added to support exporting indicator sets to security controls such as policies lists (block lists) and to support the sharing of threat data between Kaspersky CyberTrace instances or with other TI Platforms.
- A historical correlation feature (retroscan) was added to allow analyzing observables from previously checked events by using the latest feeds to find previously uncovered threats. All historical detections will be included in the report, for future investigations.
- Filter for sending detection events to SIEM solutions was added to reduce the load on the solutions and on the Analyst (fighting with alerts fatigue). It allows sending SIEM solutions only the most dangerous and confident detections that must be treated as incidents. All other detections will be saved to the internal database, and can be used during root cause analysis or in threat hunting.
- Multitenancy feature was added to support MSSP or Large Enterprise use cases when a service provider (central office) needs to handle events from different branches (tenants) separately. The feature allows connecting a single Kaspersky CyberTrace instance with different SIEM solutions from different tenants and configuring what feeds must be used for each tenant.
- HTTP REST API for looking up and managing threat intelligence was added. By using the REST API, Kaspersky CyberTrace can be easily integrated into complex environments for automation and orchestration. The API supports observables lookup, as well as TI indicators and TI suppliers managing scenarios.
- Integration with Kaspersky Unified Monitoring and Analysis Platform (KUMA) was added, including Web UI integration (single UI).
- New components were added to the Dashboard:
- Table with last feed update statuses was added to inform the user about the updating of statistics for feeds.
- Graph with checked events count was added to inform the user about the current and historical load on the system (in Event Per Second – EPS).
- Feeds intersection matrix was added to help with choosing the most valuable threat intelligence suppliers.
- Scenario for auto-updatable dashboard on TV was added, to allow displaying key metrics on a TV screen in the user's office.
- Authentication with LDAP (MS Active Directory) was added.
- Ability to load feeds from Kaspersky as custom feeds was added, to simplify the process of adding new Kaspersky feeds to Kaspersky CyberTrace.
- UI style was updated in accordance with the Kaspersky rebranding guidelines.
- Process of creating format strings for events that will be sent to SIEM solutions was simplified. A wizard that automatically composes event format strings based on the selected set of event fields has been added.
- Installers for Windows and Linux were updated:
- Kaspersky CyberTrace will be delivered as a single package for all SIEM solutions. The LogRhythm SIEM solution is supported out of the box.
- Initial configuration was moved from installers to CyberTrace Web and must be performed after the first launch in Web UI.
- In Linux packages, init.d management scripts were replaced with systemd unit files.
- URL normalization for third-party intelligence sources was added to simplify the process of integrating third-party intelligence into Kaspersky CyberTrace.
- New X-KF-SaveStatistic flag was added to support saving detection statistics when X-KF-ReplyBack mode is used.
- Integration with RSA was updated (“:rfc3164” mode for forwarding from SIEM solutions is recommended instead of using EventDelimiter on the Kaspersky CyberTrace side).
- Windows Server 2019 is now supported; and support for Windows Server 2008 and Desktop versions of Windows was limited.
- Feed Service can send alerts to a specific IP address or hostname separately from detection events. The connection settings for alert events can be specified in Kaspersky CyberTrace Web.
- If an error occurs while sending a detection event, Feed Service will try to resend it after a specific period of time. The number of attempts and the time interval between them is specified in the configuration file of Feed Service.
- When adding a custom or third-party feed, the level of confidence is specified.This information is further included in detection events.
- When adding a custom or third-party feed, the vendor name must be specified. Such feeds and suppliers are listed separately from OSINT feeds.
- Kaspersky Threat Data Feeds now include ICS Hash Data Feed for protection against malicious applications that are aimed at Industrial Control Systems.
- Adding custom feeds in the MISP format is supported. Such feeds can be loaded from a local folder or via HTTP(S).
- The basic authentication scheme is available for each custom feed that is loaded via HTTP(S) or FTP(S).
- Information about the running and finished tasks is now available on the Tasks tab.
- The following OSINT feeds are no longer supported:
- Abuse.ch_Ransomware_Common
- Abuse.ch_Ransomware_BlockUrl
- Abuse.ch_Ransomware_BlockDomain
- Abuse.ch_Ransomware_BlockIP
- Abuse.ch_Feodo_MalwareHash
About feeds and certificates
This chapter describes feeds and certificates used with Kaspersky CyberTrace.
About Kaspersky Threat Data Feeds
This section describes Kaspersky Threat Data Feeds available for Kaspersky CyberTrace.
Basics of Kaspersky Threat Data Feeds
First-tier security vendors and enterprises use time-tested and authoritative Kaspersky Threat Data Feeds to produce premium security solutions or to protect their business.
Cyber attacks happen every day. Cyber threats are constantly growing in frequency, complexity, and obfuscation, as they try to compromise your defenses. Adversaries currently use complicated intrusion kill chains, campaigns, and customized Tactics, Techniques, and Procedures (TTPs) to disrupt business or damage clients.
Kaspersky offers continuously updated Threat Data Feeds to inform your business or clients about risks and implications associated with cyber threats, helping you to mitigate threats more effectively and defend against attacks even before they are launched.
Information contained in Kaspersky Threat Data Feeds
Kaspersky Threat Data Feeds contain thoroughly vetted threat indicator data sourced from the real world in real time.
Every record in each feed is enriched with actionable context (threat names, time stamps, geolocation, resolved IPs, addresses of infected web resources, hashes, popularity, and so on). Contextual data helps to reveal the "big picture", further validating and supporting wide-ranging use of the data.
Set in context, the data can more readily be used to answer the who, what, where, and when questions that lead to the identification of adversaries, helping you make timely decisions and actions specific to your organization.
Available feed groups
Kaspersky Threat Data Feeds available for Kaspersky CyberTrace can be divided into the following major groups:
- Commercial feeds
This group contains regular commercial feeds that can be accessed with a commercial certificate. Feeds from this group cover a wide variety of cyberthreats.
- APT feeds
APT feeds are commercial feeds that contain information about cyber threats related to advanced persistent threat (APT) campaigns.
- Demo feeds
Demo feeds can be used for evaluation purposes. These feeds do not require a commercial certificate. Demo feeds provide lower detection rates in comparison with their corresponding commercial versions.
Commercial feeds
The following feeds are available in this group:
- Botnet CnC URL Data Feed
A set of URLs and hashes with context that cover desktop botnet C&C servers and related malicious objects. Masked and non-masked records are available.
- IP Reputation Data Feed
A set of IP addresses with context that cover different categories of suspicious and malicious hosts.
- Malicious Hash Data Feed
A set of file hashes with context that cover the most dangerous, prevalent, or emerging malware.
- Malicious URL Data Feed
A set of URLs with context that cover malicious websites and web pages. Masked and non-masked records are available.
- Mobile Botnet CnC URL Data Feed
A set of URLs with context that cover mobile botnet C&C servers.
- Mobile Malicious Hash Data Feed
A set of file hashes with context for detecting malicious objects that infect mobile Google Android and Apple iPhone devices.
- Phishing URL Data Feed
A set of URLs with context that cover phishing websites and web pages. Masked and non-masked records are available.
- Ransomware URL Data Feed
A set of URLs, domains, and hosts with context that cover ransomware links and websites.
- Vulnerability Data Feed
A set of file hashes with context that cover vulnerabilities in applications and cover exploits that use those vulnerabilities.
Kaspersky CyberTrace does not support the
cpesfield of the Vulnerability Data Feed. - IoT URL Data Feed
A set of URLs with context that cover malicious links used to download malware targeting Internet of Things-enabled devices.
- ICS Hash Data Feed
A set of hashes of malicious applications that are used to attack the ICS (Industrial Control Systems) infrastructure.
APT Feeds
The following demo feeds are available in this group:
- APT Hash Data Feed
A set of hashes that cover malicious artifacts used by APT actors to conduct APT campaigns.
- APT IP Data Feed
A set of IP addresses that belong to the infrastructure used in APT campaigns.
- APT URL Data Feed
A set of domains that belong to the infrastructure used in APT campaigns.
Demo feeds
The following demo feeds are available in this group:
- Demo Botnet CnC URL Data Feed
Provides lower detection rates in comparison with Botnet CnC URL Data Feed.
- Demo IP Reputation Data Feed
Provides lower detection rates in comparison with IP Reputation Data Feed.
- Demo Malicious Hash Data Feed
Provides lower detection rates in comparison with Malicious Hash Data Feed.
Sorting order for records in feeds
Feed records are sorted as follows:
- Records in IP Reputation Data Feed are sorted by threat score in descending order.
- Records in all other feeds are sorted by popularity in descending order.
About OSINT feeds
This section describes OSINT feeds supported by Kaspersky CyberTrace.
OSINT feeds are publicly available threat intelligence data sources provided by organizations and individuals.
OSINT feeds supported by Kaspersky CyberTrace
Kaspersky Feed Utility supports OSINT feeds from the following sources:
- Abuse.ch
This source has several associated sources of information:
- Feodo Tracker is an abuse.ch project that has the goal of sharing botnet C&C servers associated with the Feodo malware family (Dridex, Emotet/Heodo).
- SSLBL is an abuse.ch project that has the goal of detecting malicious SSL connections by identifying the SSL certificates used by botnet C&C servers and adding them to a denylist.
- Proofpoint ET intelligence
This source provides information about emerging threats.
- BlockList.de
This is a free and voluntary service provided by a Fraud/Abuse specialist, whose servers are often attacked on SSH, Mail Login, FTP, Webserver, and other services.
BlockList.de has reported more than 70,000 attacks in twelve hours in real time and uses the Whois (abuse-mailbox, abuse@, security@, email, remarks), the RIPE Abuse Finder, and the contact-database from abusix.org to find the abuse address assigned to the attacking host.
- Cyber Crime Tracker
Cyber Crime Tracker monitors and tracks various malware families that are used to perpetrate cyber crimes, such as banking trojans and ransomware. It lists mainly malware C&Cs, and file hashes of Zeus and Zeus-originated malware families.
The following table lists supported OSINT feeds:
OSINT feeds
Identifier |
Description |
Link |
Abuse.ch_Feodo_BlockIP |
Feodo IP Blocklist |
|
Abuse.ch_SSL_Certificate_BlockIP |
Botnet C2 IP Denylist |
|
Abuse.ch_SSL_Certificate_BlockHash |
SSL Certificate Denylist |
|
Blocklist.de_BlockIP |
Blocklist.de IP Blocklist |
|
CyberCrime_Tracker_BlockUrl |
Cyber Crime Tracker URL Blocklist |
|
EmergingThreats_BlockIP |
Raw IPs for the firewall block lists |
https://rules.emergingthreats.net/fwrules/emerging-Block-IPs.txt |
EmergingThreats_CompromisedIP |
Compromised IP addresses |
https://rules.emergingthreats.net/blockrules/compromised-ips.txt |
The OSINT feeds in the table above are maintained by third parties only. Some URLs in the table may, for various reasons, become obsolete over time.
Page topAbout the certificates
Kaspersky CyberTrace uses a certificate to download feeds. The certificate determines which feeds can be downloaded from the update servers.
Certificate types
Kaspersky CyberTrace can use two types of certificates:
- Demo certificate
This certificate is shipped in the distribution kit. It allows access to the demo Kaspersky Threat Data Feeds.
- Commercial certificate
This certificate allows access to one or more Kaspersky Threat Data Feeds.
To obtain a commercial certificate, contact Kaspersky Cybersecurity Service team at intelligence@kaspersky.com.
Certificates and security
When Kaspersky CyberTrace establishes a connection with Kaspersky servers, it passes the certificate in encrypted form to Kaspersky. The connection between Kaspersky CyberTrace and Kaspersky servers is encrypted to ensure that all data is protected.
Page topInstallation and integration guides
This chapter describes how to install Kaspersky CyberTrace, configure it, and integrate it with different SIEM solutions.
Installation and integration overview
This section explains the installation and integration process for Kaspersky CyberTrace.
Introduction
Kaspersky CyberTrace can integrate with many different event sources. Because of this, the procedure for installation and integration is split into two parts:
- Installing Kaspersky CyberTrace
We recommend installing Kaspersky CyberTrace by using one of the installer packages for your operating system. On Linux, you can install DEB and RPM packages. On Windows, you can use an executable installer.
Another way to install Kaspersky CyberTrace is to extract the TAR archive, and then perform several additional configuration steps manually.
After Kaspersky CyberTrace is installed, you can perform the post-installation configuration by using a wizard in the web interface of Kaspersky CyberTrace. During this process, you select an event source, such as a SIEM solution, provide connection parameters for it, and configure feed updates.
After the post-installation configuration is completed, Kaspersky CyberTrace uses the default parameters for a chosen event source. For example, Kaspersky CyberTrace parses the incoming events by using the default regular expressions, and uses the default format for alert and detection events.
- Integrating Kaspersky CyberTrace with an event source
In this part, you configure the event source so that it can send its events to Kaspersky CyberTrace and receive detection events from Kaspersky CyberTrace. Depending on the chosen event source, you can also install specific applications and tools that work with Kaspersky CyberTrace events. For example, Kaspersky CyberTrace provides applications for Splunk and QRadar, and a preconfigured dashboard for RSA NetWitness. In addition to applications for specific event sources, you can use the LogScanner application to send log files, URLs, and hashes for checking to Kaspersky CyberTrace.
Before you begin
Make sure that the computer you plan to use for running Kaspersky CyberTrace meets the hardware and software requirements.
For ArcSight products, ArcSight SmartConnector must be installed before the installation of Kaspersky CyberTrace. For more information, see Before you begin (ArcSight) and Integration guide (ArcSight).
Part 1. Installing Kaspersky CyberTrace
When you install Kaspersky CyberTrace, all of the components required for working with feeds, such as Feed Service and Feed Utility, are installed and configured.
Kaspersky CyberTrace can be installed on any computer that can receive events from your chosen event source, such as a SIEM solution, a firewall, or a proxy server. By configuring Kaspersky CyberTrace during its installation, you specify how it will receive and send events.
Make sure to install Kaspersky CyberTrace according to your chosen integration scheme. For example, if you must install Kaspersky CyberTrace and a SIEM solution on separate computers, check the available integration schemes for your SIEM solution and decide where to install Kaspersky CyberTrace.
Depending on your operating system, install Kaspersky CyberTrace as described in the following sections:
After you install Kaspersky CyberTrace, configure it from Kaspersky CyberTrace Web by using the Initial Setup Wizard.
Part 2. Integrating Kaspersky CyberTrace with an event source
Kaspersky CyberTrace must be integrated with an event source. This event source can either be a standalone event source (for example, a firewall or a proxy server) or a SIEM solution. The event source then sends events to Kaspersky CyberTrace, and Kaspersky CyberTrace sends its own events to a SIEM or other application, as configured.
Kaspersky CyberTrace supports integration with the following SIEM solutions:
Page topHardware and software requirements
This section lists the system requirements of Kaspersky CyberTrace.
Supported operating systems
Kaspersky CyberTrace can run on the following operating systems:
- Linux x64
- Microsoft Windows Server 2019
- Microsoft Windows Server 2012 x64
- Microsoft Windows Server 2012 R2 x64
Dependencies for Linux
In Linux, Kaspersky CyberTrace has the following dependencies:
- The
moreutility must be installed.
Software requirements for integrations with SIEM solutions
When integrating with SIEM solutions, Kaspersky CyberTrace has the following software requirements.
Software requirements for integrations with SIEM solutions
SIEM solution |
Software requirements |
Splunk |
Splunk Enterprise 8.0.0 and later The older versions are supported in Kaspersky CyberTrace 3.1. |
ArcSight ESM |
ArcSight ESM 6.8 to 7.0 ArcSight SmartConnector ArcSight Forwarding Connector |
QRadar |
IBM QRadar v7.2.5 or later |
RSA NetWitness |
RSA NetWitness 10.5, 10.6, or 11.2 |
LogRhythm |
LogRhythm 7.1.7 or later |
AlienVault OSSIM |
AlienVault OSSIM 5.7.5 For more information, see https://support.kaspersky.com/15161. |
USM Anywhere |
USM Anywhere 5.7.5 For more information, see https://support.kaspersky.com/15161. |
FortiSIEM |
FortiSIEM 5.2 or later For more information, see https://support.kaspersky.com/15474. |
Apache Kafka |
Apache Kafka 2.4.0 or later Python 2.7 or 3 This integration requires a special plugin. For more information, contact your technical account manager (TAM). |
ArcSight Event Broker |
ArcSight Event Broker 2.2 Python 2.7 or 3 This integration requires a special plugin. For more information, contact your technical account manager (TAM). |
Elastic Stack (Elasticsearch, Logstash, and Kibana) |
Logstash 7.2 or later Java 8 or 11 This integration requires Kaspersky CyberTrace Plugin for Logstash, which you can download for free. For more information, see https://support.kaspersky.com/15474. |
McAfee ESM |
McAfee ESM 9.6 to 11 For more information, contact your technical account manager (TAM). |
Integrations with other SIEM solutions are available. For more information, see https://support.kaspersky.com/datafeeds.
Supported browsers
Kaspersky CyberTrace Web can be used by using the following web browsers:
- Microsoft Edge 42 or later
- Microsoft Internet Explorer 11 or later
- Mozilla Firefox 61 or later
- Safari 11 or later
- Google Chrome 68 or later
CPU requirements
Kaspersky CyberTrace has the following CPU requirements:
- Support of x86-64 instruction set.
It is recommended to use Kaspersky CyberTrace on high-end servers.
RAM and hard disk space requirements
System requirements depend on your use case and the feeds that you use. For more detail about the system requirements, contact your technical account manager (TAM).
The actual amount of hard disk space for each feed depends on the size of the original feed file. This size changes when feeds are updated. Over time, the size of the feed files may change significantly, which can change the required amount of hard disk and memory space.
The RAM and hard disk space requirements listed in the two tables below apply only to Kaspersky Threat Data Feeds. Using third-party feeds requires additional disk and memory resources.
The table below lists the RAM and hard-disk space requirements for using only demo feeds and for using all commercial feeds on Linux-based systems.
Hardware requirements for using different feeds on Linux
Feeds used |
HDD |
RAM |
All demo feeds |
600 MB |
2.5 GB |
All commercial feeds |
4 GB |
6.5 GB |
The table below lists the RAM and hard disk space requirements for using only demo feeds and for using all commercial feeds on Windows-based systems.
Hardware requirements for using different feeds on Windows
Feeds used |
HDD |
RAM |
All demo feeds |
500 MB |
1.5 GB |
All commercial feeds |
6 GB |
5 GB |
Network requirements
The computer on which Feed Utility runs must have access to the website https://wlinfo.kaspersky.com/.
The computer on which Kaspersky CyberTrace runs must have access to the computer with the SIEM solution.
The computers of users who want to gain access to Kaspersky CyberTrace Web must have access to the address and port that Kaspersky CyberTrace uses for the web UI.
Page topDistribution kit contents
This section describes the contents of the Kaspersky CyberTrace distribution kit.
Distribution kit types
Kaspersky CyberTrace is distributed in the following types of distribution kits:
- As an RPM package and a set of additional files
This type of distribution kit is intended for installation on Linux systems.
- As a DEB package and a set of additional files
This type of distribution kit is intended for installation on Linux systems.
- As an executable installer and a set of additional files
This type of distribution kit is intended for installation on Windows systems.
- As a .tgz archive
This type of distribution kit can be used on Linux systems instead of the RPM or DEB package.
About the integration files
All distribution kits of Kaspersky CyberTrace are customized for integration with a particular SIEM solution or for standalone integration. Each distribution kit contains a number of files that can be used for integration with this SIEM solution. In addition, the configuration files of Feed Service and other utilities contained in the distribution kit are also customized for easy integration with the SIEM solution.
For example, a distribution kit for Splunk contains all the Kaspersky CyberTrace components, and, in addition, has customized configuration files for Feed Service and Feed Utility that work with Splunk. The integration directory inside the distribution kit contains applications for all variants of Splunk integration schemes. These applications can be deployed and used in the Splunk infrastructure.
RPM and DEB distribution kits
This type of distribution kit contains the following files and directories.
Distribution kit contents (RPM and DEB package)
Item |
Description |
Doc_data/* |
Documentation files. |
Kaspersky_CyberTrace.html |
Offline version of documentation. |
Kaspersky_CyberTrace-Linux-%architecture%-%version%.rpm (RPM package) Kaspersky_CyberTrace-Linux-%architecture%-%version%.deb (DEB package) |
Kaspersky CyberTrace installation package. For a list of files inside this package, see subsection "Files contained in archives and packages (Linux)" below. |
legal_notices.txt |
Legal notices for the product. |
run.sh |
Installation script. |
ReleaseNotes.pdf |
Release notes. |
version_history.txt |
Changes made to the documentation. |
Executable installer distribution kit
This type of distribution kit contains the following files and directories.
Distribution kit contents (executable installer)
Item |
Description |
db/* |
Elasticsearch indicator database files. |
Doc_data/* |
Documentation files. |
index.html |
Offline version of documentation. |
Kaspersky_CyberTrace-Windows-%architecture-version%-Release_for_%SIEM%.exe |
Executable installer. For a list of files inside this package, see subsection "Files contained in archives and packages (Windows)" below. |
ReleaseNotes.pdf |
Release notes. |
legal_notices.txt |
Legal notices for the product. |
license.rtf |
End User License Agreement (EULA). |
version_history.txt |
Changes made to the documentation. |
Files contained in archives and packages (Linux)
RPM and DEB packages and TGZ archives contain the following set of files.
Files contained in archives and packages (Linux)
Item |
Description |
bin/.need_run_wizard |
Initial Setup Wizard. This file is deleted after the initial setup is done. |
bin/configure |
Configurator utility binary file. |
bin/en_US |
English localization files. |
bin/kl_feed_service |
Feed Service binary file. |
bin/kl_feed_service_log.conf |
Feed Service logging configuration file. |
bin/libssp.so.0 |
Auxiliary library. |
db/package/config/elasticsearch.yml |
Elasticsearch database configuration file. |
dmz/cron_dmz.sh |
Script for updating feeds from a separate computer. |
dmz/demofeeds.pem |
Certificate needed for getting access to demo feeds. |
dmz/feeds.pem |
Certificate needed for getting access to demo feeds. It is replaced with the certificate specified during the installation of Kaspersky CyberTrace. |
dmz/kl_feed_compiler |
Binary file used by Feed Utility to compile feeds. |
dmz/kl_feed_util |
Feed Utility binary file. |
dmz/kl_feed_util.conf |
Feed Utility configuration file. |
dmz/libssp.so.0 |
Auxiliary library. |
doc/Kaspersky_CyberTrace_Online_Documentation.html |
HTML page that redirects to the online documentation for Kaspersky CyberTrace. |
doc/legal_notices.txt |
Legal notices for the product. |
doc/license.txt |
End User License Agreement (EULA). |
etc/systemd/system/cybertrace.service |
Systemd unit file for Feed Service. |
etc/systemd/system/cybertrace_db.service |
Systemd unit file for Elasticsearch database service. |
etc/kl_feed_service.conf |
Feed Service configuration file. |
etc/kl_feed_service_templates.conf |
Configuration file template. |
etc/kl_feed_util.conf |
Feed Utility configuration file. |
feeds/APT_URL_Data_Feed.json.url.bin/* feeds/Botnet_CnC_URL_Data_Feed.json.url.bin/* feeds/Demo_Botnet_CnC_URL_Data_Feed.json.url.bin/* feeds/IoT_URL_Data_Feed.json.url.bin/* feeds/Malicious_URL_Data_Feed.json.url.bin/* feeds/Mobile_Botnet_CnC_URL_Data_Feed.json.url.bin/* feeds/Phishing_URL_Data_Feed.json.url.bin/* feeds/Ransomware_URL_Data_Feed.json.url.bin/* |
Compiled URL masks for feeds. |
feeds/Demo_Botnet_CnC_URL_Data_Feed.json feeds/Demo_IP_Reputation_Data_Feed.json feeds/Demo_Malicious_Hash_Data_Feed.json |
Demo feeds. |
feeds/APT_Hash_Data_Feed.json feeds/APT_IP_Data_Feed.json feeds/APT_URL_Data_Feed.json feeds/Botnet_CnC_URL_Data_Feed.json feeds/IoT_URL_Data_Feed.json feeds/IP_Reputation_Data_Feed.json feeds/Malicious_Hash_Data_Feed.json feeds/Malicious_URL_Data_Feed.json feeds/Mobile_Botnet_CnC_URL_Data_Feed.json feeds/Mobile_Malicious_Hash_Data_Feed.json feeds/Phishing_URL_Data_Feed.json feeds/Ransomware_URL_Data_Feed.json feeds/Vulnerability_Data_Feed.json feeds/ICS_Hash_Data_Feed.json |
Files for performing verification test for commercial feeds. These files are replaced by actual commercial feeds when updated. |
httpsrv/etc/kl_feed_info.conf |
File that contains information about Kaspersky Threat Data Feeds. |
httpsrv/etc/ktfsaccess |
File that contains information about CyberTrace accounts. |
httpsrv/etc/ktfsstatistics.kvdb |
Auxiliary file for Kaspersky CyberTrace Web. This file is not contained in the distribution kit, but is created during the work of Kaspersky CyberTrace. |
httpsrv/etc/ktfsstorage.kvdb |
File that contains information about open sessions and tasks in progress. This file is not contained in the distribution kit, but is created later during the work of Kaspersky CyberTrace. |
httpsrv/etc/osint_feed_list.conf |
File that contains the list of the supported OSINT feeds. |
httpsrv/templates/* |
Directory that contains templates for Kaspersky CyberTrace Web. |
httpsrv/templates_kuma |
Directory that contains Kaspersky CyberTrace Web templates for the KUMA integration. |
integration/* |
Files for integration with a particular SIEM solution. For a list of these files, see "Integration files" subsections below. |
log_scanner/libssp.so.0 |
Auxiliary library. |
log_scanner/log_scanner |
Log Scanner binary file. |
log_scanner/log_scanner.conf |
Log Scanner configuration file. |
scripts/cron_cybertrace.sh |
Script for updating feeds when Feed Service and Feed Utility are installed on different computers. |
tools/kl_access_util |
Password Utility. |
tools/kl_feed_compiler |
Binary file used by Feed Utility to compile feeds. |
tools/kl_feed_util |
Feed Utility binary file. |
tools/libssp.so.0 |
Auxiliary library. |
tools/openssl |
OpenSSL binary file. |
tools/openssl.cnf |
OpenSSL configuration file. |
tools/output/feeds.info |
Auxiliary file. |
verification/kl_verification_test_leef.txt |
Events for the verification test, in LEEF format. |
verification/kl_verification_test_cef.txt |
Events for the verification test in, CEF format. |
gcc-version |
Version of GCC. |
platform |
Version of the GLIBC library. |
ReleaseNotes.pdf |
Release notes. |
version |
Product version. |
Files contained in archives and packages (Windows)
Executable installers contain the following set of files.
Files contained in archives and packages (Windows)
Item |
Description |
bin\.need_run_wizard |
Initial Setup Wizard. This file is deleted after the initial setup is done. |
bin\en_US |
English localization files. |
bin\kl_control.bat |
Script for managing Feed Service. |
bin\kl_feed_service.conf |
Feed Service configuration file. |
bin\kl_feed_service.exe |
Feed Service binary file. |
bin\kl_feed_service_log.conf |
Logging configuration file. |
bin\kl_feed_service_templates.conf |
Configuration file template. |
bin\kl_feed_util.conf |
Feed Utility configuration file. |
bin\kl_watchdog_service.exe |
Binary file of the Windows service that monitors the Feed Service process. |
db\package\config\elasticsearch.yml |
Elasticsearch database configuration file. |
dmz\cron_dmz.cmd |
Script for updating feeds from a separate computer. |
dmz\demofeeds.pem |
Certificate required for access to demo feeds. |
dmz\feeds.pem |
Certificate required for access to demo feeds. It is replaced with the certificate specified during installation of Kaspersky CyberTrace. |
dmz\kl_feed_compiler.exe |
Binary file used by Feed Utility to compile feeds. |
dmz\kl_feed_util.conf |
Feed Utility configuration file. |
dmz\kl_feed_util.exe |
Feed Utility binary file. |
doc\Kaspersky_CyberTrace_Online_Documentation.html |
HTML page that redirects to the online documentation for Kaspersky CyberTrace. |
doc\legal_notices.txt |
Legal notices for the product. |
doc\license.rtf |
End User License Agreement (EULA). |
feeds\APT_URL_Data_Feed.json.url.bin\* feeds\Botnet_CnC_URL_Data_Feed.json.url.bin\* feeds\Demo_Botnet_CnC_URL_Data_Feed.json.url.bin\* feeds\IoT_URL_Data_Feed.json.url.bin\* feeds\Malicious_URL_Data_Feed.json.url.bin\* feeds\Mobile_Botnet_CnC_URL_Data_Feed.json.url.bin\* feeds\Phishing_URL_Data_Feed.json.url.bin\* feeds\Ransomware_URL_Data_Feed.json.url.bin\* |
Compiled URL masks for feeds. |
feeds\Demo_Botnet_CnC_URL_Data_Feed.json feeds\Demo_IP_Reputation_Data_Feed.json feeds\Demo_Malicious_Hash_Data_Feed.json |
Demo feeds. |
feeds\APT_Hash_Data_Feed.json feeds\APT_IP_Data_Feed.json feeds\APT_URL_Data_Feed.json feeds\Botnet_CnC_URL_Data_Feed.json feeds\IoT_URL_Data_Feed.json feeds\IP_Reputation_Data_Feed.json feeds\Malicious_Hash_Data_Feed.json feeds\Malicious_URL_Data_Feed.json feeds\Mobile_Botnet_CnC_URL_Data_Feed.json feeds\Mobile_Malicious_Hash_Data_Feed.json feeds\Phishing_URL_Data_Feed.json feeds\Ransomware_URL_Data_Feed.json feeds\Vulnerability_Data_Feed.json feeds\ICS_Hash_Data_Feed.json |
Files for performing verification test for commercial feeds. These files are replaced by actual commercial feeds when updated. |
httpsrv\etc\kl_feed_info.conf |
File that contains information about Kaspersky Threat Data Feeds. |
httpsrv\etc\ktfsaccess |
File that contains information about CyberTrace accounts. |
httpsrv\etc\ktfsstatistics.kvdb |
Auxiliary file for Kaspersky CyberTrace Web. This file is not contained in the distribution kit, but is created during the work of Kaspersky CyberTrace. |
httpsrv\etc\ktfsstorage.kvdb |
File that contains information about open sessions and tasks in progress. This file is not contained in the distribution kit, but is created during the work of Kaspersky CyberTrace. |
httpsrv\etc\osint_feed_list.conf |
File that contains the list of the supported OSINT feeds. |
httpsrv\templates\* |
Folder that contains templates for Kaspersky CyberTrace Web. |
httpsrv\templates_kuma |
Folder that contains Kaspersky CyberTrace Web templates for the KUMA integration. |
integration\* |
Files for integration with a particular SIEM solution. For a list of these files, see "Integration files" subsections below. |
log_scanner\log_scanner.conf |
Log Scanner configuration file. |
log_scanner\log_scanner.exe |
Log Scanner binary file. |
scripts\cron_cybertrace.cmd |
Script for updating feeds when Feed Service and Feed Utility are installed on different computers. |
tools\kl_access_util.exe |
Password Utility. |
tools\kl_feed_compiler.exe |
Binary file used by Feed Utility to compile feeds. |
tools\kl_feed_util.exe |
Feed Utility binary file. |
tools\openssl.cnf |
OpenSSL configuration file for generating a self-signed certificate. |
tools\openssl.exe |
OpenSSL binary file. |
verification\kl_verification_test_leef.txt |
Events for the verification test in LEEF format. |
verification\kl_verification_test_cef.txt |
Events for the verification test in CEF format. |
install.bat |
Batch script that installs Windows services for Kaspersky CyberTrace. |
ReleaseNotes.pdf |
Release notes. |
uninstall.bat |
Batch script that uninstalls Windows services for Kaspersky CyberTrace. |
version |
A text file containing the product version. |
Integration files (Splunk)
Integration files for Splunk are described in the following table.
Integration files (Splunk)
Item |
Description |
/integration/splunk/Kaspersky-CyberTrace-App-for-Splunk.tar.gz |
Kaspersky CyberTrace App for Splunk application file for the single-instance integration scheme. |
/integration/splunk/Kaspersky-CyberTrace-App-for-Splunk_Forwarder.tar.gz |
Kaspersky CyberTrace App for Splunk Forwarder application file for the distributed integration scheme. |
/integration/splunk/Kaspersky-CyberTrace-App-for-Splunk_Search-Head.tar.gz |
Kaspersky CyberTrace App for Splunk Search Head application file for the distributed integration scheme. |
Integration files (ArcSight)
Integration files for ArcSight are described in the following table.
Integration files (ArcSight)
Item |
Description |
integration/arcsight/Kaspersky_CyberTrace_Connector.arb |
Kaspersky CyberTrace Connector ARB file for ArcSight. |
Integration files (QRadar)
Integration files for QRadar are described in the following table.
Integration files (QRadar)
Item |
Description |
integration/qradar/sample_initiallog.txt |
A log example for the first transmission of events to QRadar. |
integration/qradar/sample_qid.txt |
An example list of QIDs for importing to QRadar. |
Integration files (RSA NetWitness)
Integration files for RSA NetWitness are described in the following table.
Integration files (RSA NetWitness)
Item |
Description |
integration/rsa/additional_elements/CyberTrace_Charts.zip |
File that contains preconfigured charts. |
integration/rsa/additional_elements/CyberTrace_Reports.zip |
File that contains a preconfigured report. |
integration/rsa/additional_elements/CyberTrace_Rules.zip |
File that contains rules to operate the events from Feed Service. |
integration/rsa/additional_elements/index-concentrator-custom.xml |
Example of data that can be added to the index-concentrator-custom.xml file. This data example contains only a description of the kl actionable fields. |
integration/rsa/additional_elements/Kaspersky CyberTrace.zip |
File for creating the Kaspersky CyberTrace dashboard in RSA NetWitness 11.0. |
integration/rsa/additional_elements/Kaspersky+CyberTrace.cfg |
File for creating the Kaspersky CyberTrace dashboard in RSA NetWitness 10.6. |
integration/rsa/additional_elements/MetaGroups.jsn |
File that contains a meta group that is used for browsing fields in RSA NetWitness that are filled by Feed Service. |
integration/rsa/additional_elements/MetaGroups_without_kl_fields.jsn |
Metagroup for the Navigate tab. This metagroup does not contain the |
integration/rsa/additional_elements/table-map-custom.xml |
Example of data that can be added to the table-map-custom.xml file. This data example contains only a description of the |
integration/rsa/cybertrace/cybertrace.ini |
File used for integrating Kaspersky CyberTrace with RSA NetWitness. |
integration/rsa/cybertrace/v20_cybertracemsg.xml |
File used for integrating Kaspersky CyberTrace with RSA NetWitness |
Integration files (LogRhythm)
Integration files for LogRhythm are described in the following table.
Integration files (LogRhythm)
Item |
Description |
integration/logrhythm/events/* |
Files that contain KasperskyCyberTrace rules for importing to LogRhythm:
|
Part 1: Installing Kaspersky CyberTrace
These sections describe how to install Kaspersky CyberTrace on Linux or Windows systems.
Installation on Linux systems
This section describes the process of installing Kaspersky CyberTrace on Linux systems.
After installation, make sure that only users with administrator rights have access to the folder where Kaspersky CyberTrace is installed.
We also recommend that you install and run anti-virus software before installing Kaspersky CyberTrace.
Installation methods
On Linux systems, you can install Kaspersky CyberTrace by three methods:
- RPM installation
In this type of installation, you run the installation script,
run.sh. The installation script installs the RPM package and runs the configurator. The configurator generates certificates for Kaspersky CyberTrace Web and configures the Elasticsearch indicator database. - DEB installation
The same as RPM installation.
- TGZ installation
In this type of installation, you manually unpack the TGZ archive to the
/opt/kaspersky/ktfsdirectory and create symbolic links for configuration files and startup scripts. You must then manually run the configurator binary file and accept the End User License Agreement.If you do not run the configurator after performing the TGZ installation, Kaspersky CyberTrace will not work. You must accept the End User License Agreement.
RPM installation
Kaspersky CyberTrace is installed in the /opt/kaspersky/ktfs directory. This directory is called %service_dir% in this document.
The user account that performs the RPM installation must have root privileges.
To perform the RPM installation of Kaspersky CyberTrace:
- Unpack the distribution kit contents to any directory on your system. In the following command, substitute
%temp_dir%with this directory and%VERSION%with the version of the installation package.tar -C %temp_dir% -xvzf Kaspersky_CyberTrace-Linux-x86_64-%VERSION%-Release-RPM.tar.gz --no-same-ownerThe RPM package, installation script, and documentation will be unpacked to this directory.
The archive can have a different name, for example,
%SIEM%-rpm.tar.gz. You can either use the existing name or rename the archive by using themvcommand. - Run the installation script:
./run.sh installThe installation script will install the RPM package and add Feed Service to the list of services by using
chkconfig. Feed Service will start automatically on system boot.After the RPM package is installed, the installation script automatically runs the configurator.
- In the configurator, accept the End User License Agreement.
For more information about using the configurator, see the section "Interactive setup with the configurator" below.
If you interrupt the configuration process, you can resume it by running the following command:
/opt/kaspersky/ktfs/bin/configure –i. - Perform the post-installation configuration by using the Initial Setup Wizard.
DEB installation
Kaspersky CyberTrace is installed in the /opt/kaspersky/ktfs directory. This directory is called %service_dir% in this document.
The user account that performs the DEB installation must have root privileges.
To perform the DEB installation of Kaspersky CyberTrace:
- Unpack the distribution kit contents to any directory on your system. In the following command, substitute
%temp_dir%with this directory and%VERSION%with the version of the installation package.tar -C %temp_dir% -xvzf Kaspersky_CyberTrace-Linux-x86_64-%VERSION%-Release-DEB.tar.gz --no-same-ownerThe DEB package, installation script, and documentation will be unpacked to this directory.
The archive can have a different name, for example,
%SIEM%-deb.tar.gz. You can either use the existing name or rename the archive by using themvcommand. - Run the installation script:
./run.sh installThe installation script will install the DEB package and add Feed Service to the list of services started on boot by
systemd. Feed Service will start automatically on system boot. - After the DEB package is installed, the installation script automatically runs the configurator.
- In the configurator, accept the End User License Agreement.
For more information about using the configurator, see the section "Interactive setup with the configurator" below.
If you interrupt the configuration process, you can resume it by running the following command:
/opt/kaspersky/ktfs/bin/configure –i. - Perform the post-installation configuration by using the Initial Setup Wizard.
TGZ installation
To perform the TGZ installation of Kaspersky CyberTrace:
- Unpack the archive. The directory to which you unpack the archive is called
%service_dir%in this document. To do this, run the following command:tar -C %service_dir% -xvzf Kaspersky_CyberTrace-Linux-x86_64-%VERSION%-Release.tar.gz --strip-components=1 - Create the cybertrace_db account for the database service and set its login shell to
/bin/nologin:id -u cybertrace_db > /dev/null 2>&1 || useradd -M cybertrace_db -d %service_dir%/db -s /sbin/nologin - Make cybertrace_db the owner of the database directory:
chown -R cybertrace_db %service_dir%/db - Increase the system limit on the maximum number of memory regions allocated to a process:
echo 'vm.max_map_count=262144' > /etc/sysctl.d/98-elasticsearch.conf && sysctl --system - Increase the limit on the maximum number of open files:
echo -e "cybertrace_db\t-\tnofile\t65535" > /etc/security/limits.d/10-cybertrace.conf - Create a symlink for the database service:
ln -s $%service_dir%/etc/systemd/system/cybertrace_db.service /etc/systemd/system/cybertrace_db.service - Create a symlink for the Kaspersky CyberTrace service:
ln -s $%service_dir%/etc/systemd/system/cybertrace.service /etc/systemd/system/cybertrace.service - Reload the systemd daemon to make it reread the list of services:
systemctl daemon-reload - Allow Kaspersky CyberTrace databases and services in systemd:
systemctl enable cybertrace_db.service && systemctl enable cybertrace.service - Run the configurator:
%service_dir%/bin/configure -i - Launch Kaspersky CyberTrace service:
systemctl start cybertrace - Perform the post-installation configuration by using the Initial Setup Wizard.
Interactive setup with the configurator
To perform the interactive setup with the configurator:
- In the configurator, accept the End User License Agreement:
Use the PAGE UP and PAGE DOWN keys to navigate. Type q to quit.
To accept the End User License Agreement, print
Yes. - If the configurator does not automatically determine ports for Kaspersky CyberTrace Web and the Elastic database, specify this information.
- After that, Kaspersky CyberTrace will be launched. Two links will be displayed:
- Link to the Kaspersky CyberTrace web user interface.
- Link to the Kaspersky CyberTrace documentation, where you can find the credentials for logging into Kaspersky CyberTrace Web.
Configurator command-line parameters
The configurator is a binary file that configures and runs Kaspersky CyberTrace.
The file has the following command-line syntax:
configure [options]
The following options are available:
-h [ --help ]Display a
helpmessage and exit.-i [ --install ]Perform the initial configuration of Kaspersky CyberTrace.
-c [ --change ]Update the certificate used for Kaspersky CyberTrace Web.
Installation on Windows systems
This section describes the process of installing Kaspersky CyberTrace on Windows systems.
After installation, make sure that only users with administrator rights have access to the folder where Kaspersky CyberTrace is installed.
We also recommend that you install and run anti-virus software before installing Kaspersky CyberTrace.
Installation methods
On Windows systems, you can install Kaspersky CyberTrace by running an executable installer. During the installation process, the installer generates certificates for Kaspersky CyberTrace Web and configures the Elasticsearch indicator database.
To install Kaspersky CyberTrace by using an executable installer:
- Make sure that the computer you plan to use for running Feed Service meets the hardware and software requirements.
- Make sure that the computer can send events to the computer on which a SIEM solution is installed and can receive events from the SIEM computer.
- Run the .exe file of the executable installer.
You must run the executable installer from the Administrator account.
As an option, you can specify the
/accepteulaparameter when you run the .exe file. In this case, the installer performs the installation without requiring any input. You can use this option only if you have read and accepted the End User License Agreement (EULA). A document with the End User License Agreement (EULA) is provided in the Distribution kit. We recommend installing Kaspersky CyberTrace without using this option. - Accept the End User License Agreement (EULA).
If you continue the installation, Kaspersky CyberTrace is installed to
C:\Program Files\Kaspersky Lab\Kaspersky CyberTrace. This folder is called%service_dir%in this document. - Kaspersky CyberTrace Web will be launched. The check box and the link to Kaspersky CyberTrace Web will be displayed:
- By default, you will be directed to the Kaspersky CyberTrace Web page after installation. Clear this check box if you do not want to go to the web user interface.
- Click the Kaspersky CyberTrace documentation link to find the credentials that are used to log on to Kaspersky CyberTrace Web.
To configure Kaspersky CyberTrace after it is installed:
- Perform the post-installation configuration by using the Initial Setup Wizard.
- Verify that everything is in working order. See subsection "Checking that the components of Kaspersky CyberTrace are running" below.
Perform the following procedure only if you cannot configure Kaspersky CyberTrace using Kaspersky CyberTrace Web.
To configure Kaspersky CyberTrace by editing its configuration files:
- Select the feeds that must be downloaded and processed by Feed Utility:
- In the
%service_dir%\bin\kl_feed_util.conffile, find the feeds that you want to download and process. - For each of the feeds, find the following attribute:
enabled="false" - For each of the feeds, change the value of the attribute to
true:enabled="true"
- In the
- Specify the feeds that must not be processed by Feed Service:
- In the
%service_dir%\bin\kl_feed_service.conffile, find the feeds that you will not use. - For each of the feeds, find the following attribute:
enabled="true" - For each of the feeds, change the value of the attribute to
false:enabled="false"
The lists of the enabled feeds in the Feed Utility configuration file and the Feed Service configuration file must be the same.
- In the
- Specify the IP address and port (or the Windows-named pipe) to which Feed Service will send outgoing events in the
OutputSettings>ConnectionStringelement of the Feed Service configuration file. - Specify the IP address and port (or the Windows-named pipe) that Feed Service will listen on for incoming events in the
InputSettings>ConnectionStringelement of the Feed Service configuration file. - If you want to use Log Scanner, specify the IP address and port (or the Windows-named pipe) that the utility will use to interact with Feed Service in the
Connectionelement of the Log Scanner configuration file.The Log Scanner configuration file is located at
%service_dir%\log_scanner\log_scanner.conf. - If you have a commercial certificate for downloading feeds, replace the
%service_dir%\dmz\feeds.pemdemo certificate with your commercial certificate. - If you want Feed Utility to access Kaspersky servers through a proxy server, specify the proxy setting by running the utility with the
--set-proxyoption:kl_feed_util --set-proxy 'user:pass@proxy.example.com:3128' -c ..\bin\kl_feed_util.conf - If you have a commercial license key, you can add it to Kaspersky CyberTrace by copying it to the
%service_dir%\httpsrv\licdirectory. - If you want to use normalizing rules to process the events sent by various sources or if you want to use custom regular expressions to parse the events, add the
<Source>elements with normalizing rules and custom regular expressions to the Feed Service configuration file. - Restart Feed Service by running the
%service_dir%\bin\kl_control.batfile as Administrator.
Checking that the components of Kaspersky CyberTrace are running
To check whether the components of Kaspersky CyberTrace are running:
Run the kl_control.bat script with the status option as Administrator. The result displayed in the console must be similar to that depicted in the figure below.
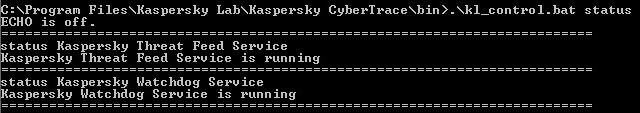
kl_control.bat output
If the result of these commands is not similar to the information displayed in the figures, contact your technical account manager (ТАМ) for assistance.
Page topPost-installation configuration (Initial Setup Wizard)
This section explains how to configure Kaspersky CyberTrace by using the Initial Setup Wizard.
The Initial Setup Wizard is a sequence of web interface pages where you configure Kaspersky CyberTrace after it is installed. Once the wizard is completed, other pages of the web interface become available.
The wizard has the following pages:
- SIEM selection
On this page, you must select your SIEM. The choice of a SIEM solution at this step affects the format of the Kaspersky CyberTrace configuration files, since these files are customized for integration with a particular SIEM solution.
For the full list of supported SIEMs, see the subsection "Supported SIEM solutions" of the "Tenants settings" section.
- Connection settings
On this page, you must specify connection parameters for your SIEM.
- Proxy server configuration
On this page, you can specify proxy settings. This step is optional.
- Licensing configuration
On this page, you can specify paths to the license key file and the certificate file. This step is optional.
- Feeds selection
On this page, you must specify the required feeds.
Navigating to the Initial Setup Wizard
To navigate to the Initial Setup Wizard:
- Open Kaspersky CyberTrace Web in your browser at
https://127.0.0.1. - Log in to Kaspersky CyberTrace Web by using the default credentials.
Selecting a SIEM
To select your SIEM:
- Choose a SIEM.
The default parameters for this SIEM will be displayed on the page.
- Click Next to proceed to the next page.
Configuring connection parameters
To specify connection parameters for your SIEM:
- Specify the connection parameters that Kaspersky CyberTrace will use for incoming events:
- Select what type of connection you want to use.
- In the IP address and Port fields, specify an IP address and port.
- In the UNIX socket field, specify a UNIX socket.
- Specify an IP address and port that Kaspersky CyberTrace will use for outgoing events.
- Specify an IP address or hostname to be used in Kaspersky CyberTrace events as the external address of the web interface.
- Click Next to proceed to the next page.
Configuring a proxy server
To specify proxy server parameters:
- Select Use proxy server.
- In the IP address or hostname field, specify a proxy server IP address or host.
- In the Proxy port field, specify a proxy server port.
- If needed, select Use proxy credentials.
- If you choose to use proxy credentials, specify the following:
- In the User name field, specify a user name to access the proxy server
- In the Password field, specify a password to access the proxy server
- Click Next to proceed to the next page.
Configuring licensing
To import the license key and the certificate:
- In the Kaspersky CyberTrace license key field, specify a path to the license key file.
This field is optional.
- In the Kaspersky Threat Data Feeds certificate field, specify a path to the certificate file.
This field is optional.
- Click Next to proceed to the next page.
Selecting feeds
To specify the required feeds:
- Select the feeds that you want to use.
- Click Next.
When the initial setup is complete, you will be asked to refer to the Kaspersky CyberTrace documentation. The displayed links are intended to be used for the following actions:
- Integrate Kaspersky CyberTrace with your SIEM solution
- Configure additional tenants
- Explore the Administrator guides section
To finish the initial setup wizard, click Close.
Page topPart 2: Integrating Kaspersky CyberTrace with an event source
At this step, you must integrate Kaspersky CyberTrace with an event source. An event source can be either one of the SIEM solutions or a standalone event source.
Kaspersky CyberTrace supports integration with the following SIEM solutions:
- Integration steps (Splunk)
- Integration steps (ArcSight)
- Integration steps (QRadar)
- Integration steps (RSA NetWitness)
- Integration steps (LogRhythm)
- KUMA
Integrations with other SIEM solutions are available. For more information, see https://support.kaspersky.com/datafeeds.
Integration with Splunk
This chapter describes how to integrate Kaspersky CyberTrace with Splunk.
Integration steps (Splunk)
This chapter describes how to integrate Kaspersky CyberTrace with Splunk.
About the integration schemes
Kaspersky CyberTrace can be integrated with Splunk in two integration schemes:
- Single-instance integration scheme
In the single-instance integration scheme, Feed Service and the Splunk instance are configured to work on the same computer or on different computers.
- Distributed integration scheme
In the distributed integration scheme, you install Feed Service, Search Head App, and Forwarder App in your distributed Splunk environment and configure the service and the apps to interact with each other.
How to integrate Kaspersky CyberTrace with Splunk in the single-instance integration mode
To integrate Kaspersky CyberTrace with Splunk in the single-instance integration mode:
- Make sure that you have installed Kaspersky CyberTrace.
In the single-instance integration scheme, Kaspersky CyberTrace and the Splunk instance are installed on the same computer or on different computers. By default, Kaspersky CyberTrace App for Splunk is configured to be installed on the same computer with Kaspersky CyberTrace. However, we recommend that you install Kaspersky CyberTrace on a separate computer; in this case, Feed Service must be configured during the installation, and Kaspersky CyberTrace App for Splunk must be configured in step 2 (below).
- Step 1. Install Kaspersky CyberTrace App for Splunk.
- Step 2 (optional). Configure Kaspersky CyberTrace App for Splunk.
This step is optional. If you skip this step, Kaspersky CyberTrace App for Splunk will use the default configuration. Email alerts will not be sent in this case.
By default, Kaspersky CyberTrace App for Splunk uses port
9999to send events to Kaspersky CyberTrace and port9998to receive events from Kaspersky CyberTrace. If these ports are used by another application, you must configure either Kaspersky CyberTrace App for Splunk or the other application to use different ports. - Step 3 (optional). Configure the lookup script.
This step is optional. If you skip this step, the lookup script will use the default configuration.
- Step 4. Perform the verification test.
Please make sure you perform the verification test before editing any matching process settings.
How to integrate with Splunk in the distributed integration mode
To integrate Kaspersky CyberTrace with Splunk in the distributed integration mode:
- Make sure that you have installed Kaspersky CyberTrace.
In the distributed deployment scheme, you can install Kaspersky CyberTrace on one of the computers that has Forwarder or Indexer already installed, or on a separate computer.
In the distributed deployment scheme, you must configure Feed Service during the installation to receive events from other Splunk entities such as heavy forwarders and indexers, and send its own events to the indexer that stores the index used by Kaspersky CyberTrace App for Splunk.
- Step 1. Install Forwarder App and Search Head App.
- Step 2. Configure Forwarder App and Search Head App so that they can interact with each other and forward events to Kaspersky CyberTrace.
- Step 3 (optional). Configure the lookup script.
This step is optional. If you skip this step, the lookup script will use the default configuration.
- Step 4. Perform the verification test.
Please make sure you perform the verification test before editing any matching process settings.
Single-instance integration (Splunk)
This section contains instructions for integrating Kaspersky CyberTrace and Splunk in the single-instance integration scheme.
About the single-instance integration scheme
By default, both Feed Service and Kaspersky CyberTrace App use the following integration scheme. This scheme is the single-instance integration scheme.
About apps and services
The single instance integration scheme uses one app and one service:
- Feed Service
This service matches Splunk events against Kaspersky Threat Data Feeds.
Feed Service sends the resulting events to Splunk. Splunk stores the events from Feed Service in the
mainindex. - Kaspersky CyberTrace App
This app contains Kaspersky CyberTrace App dashboards, alert templates, and a lookup script. The app also contains parsing rules for Feed Service events and rules for forwarding events from Splunk to Feed Service.
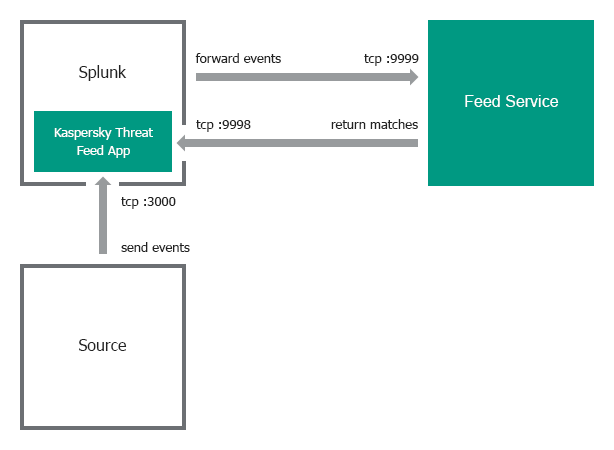
Single-instance integration scheme
In the single-instance integration scheme, Splunk Apps and Feed Service work on the same computer by default (IP address is 127.0.0.1). Kaspersky CyberTrace App receives input on port 3000 and forwards it to Feed Service on port 9999. Feed Service then returns matches to Kaspersky CyberTrace App on port 9998.
If you want to install Feed Service on a separate computer, you must specify addresses and ports used by Feed Service and Kaspersky CyberTrace App when installing Kaspersky CyberTrace.
Single-instance integration scheme
Event format
By default, Kaspersky CyberTrace App and Feed Service receive events in a certain format:
- Feed Service uses regular expressions from its configuration file to parse events. You can view and configure these regular expressions on the Settings > Matching tab in Kaspersky CyberTrace Web. These regular expressions parse a specific format of inbound data. For example, the default regular expression for URLs matches strings that contains a protocol (for example,
http://orhttps://). If URLs in the events that come from your devices do not contain protocols, you must change the regular expression. - The lookup script that comes with Kaspersky CyberTrace App sends events to Feed Service in a format that matches the regular expressions used by Feed Service. When you change the regular expressions, edit the lookup script so that it uses a format that matches the new regular expressions.
Step 1. Installing Kaspersky CyberTrace App (single-instance deployment)
This section describes the process of installing Kaspersky CyberTrace App.
Kaspersky CyberTrace App is installed from the %service_dir%/integration/splunk/Kaspersky-CyberTrace-App-for-Splunk.tar.gz file.
Installing the app
To install Kaspersky CyberTrace App:
- In Splunk Web, go to the home page.
- On the home page, click the Manage Apps button.
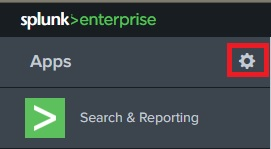
Manage Apps button
- On the Apps page, click the Install app from file button.

Install app from file button
- In the Upload an app window, click Choose File and select the Kaspersky CyberTrace App application file.
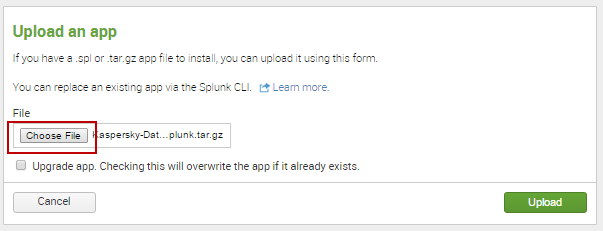
Choose File button
- In the Upload an app window, click the Upload button.
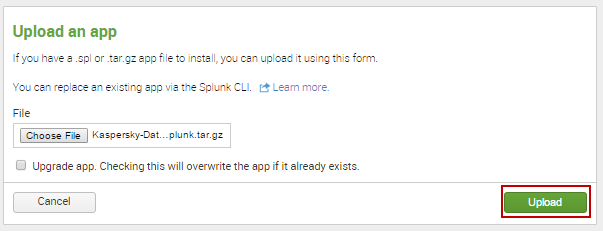
Upload button
- In the Restart required window, click the Restart Splunk button.
This step can be skipped, depending on the Splunk version. If Splunk does not display the Restart required window, skip this step.
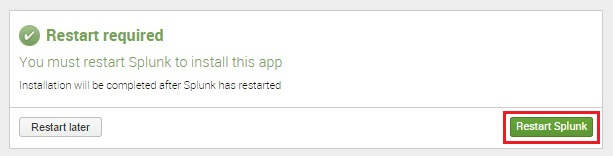
Restart Splunk button
- When Splunk starts again, the Apps page will open with information about the successful installation of Kaspersky CyberTrace App. Kaspersky CyberTrace App will appear in the list of apps on the Splunk home page.
Kaspersky CyberTrace App for Splunk in the list of apps
Step 2 (optional). Configuring Kaspersky CyberTrace App (single-instance deployment)
Kaspersky CyberTrace App reads its parameters from the configuration files. These configuration files define input settings, output settings, and the event format used by Kaspersky CyberTrace App.
Restart Splunk after you have made changes to the Kaspersky CyberTrace App configuration files.
Edit only those Kaspersky CyberTrace App configuration files that are described in this section. Editing other Kaspersky CyberTrace App configuration files may result in unpredictable behavior.
About the configuration files
The following configuration files can be used to configure Kaspersky CyberTrace App ($SPLUNK_HOME is the Splunk installation directory):
$SPLUNK_HOME/etc/apps/Kaspersky-CyberTrace-App-for-Splunk/default/commands.confThis configuration file specifies the command for the lookup script.
$SPLUNK_HOME/etc/apps/Kaspersky-CyberTrace-App-for-Splunk/default/inputs.confThis configuration file specifies the Kaspersky CyberTrace App input settings. This includes ports and addresses for data from event sources and for incoming detection events from Feed Service.
$SPLUNK_HOME/etc/apps/Kaspersky-CyberTrace-App-for-Splunk/default/outputs.confThis configuration file specifies the parameters for forwarding events to Feed Service.
$SPLUNK_HOME/etc/apps/Kaspersky-CyberTrace-App-for-Splunk/default/props.confThis configuration file specifies the parameters for processing input data.
$SPLUNK_HOME/etc/apps/Kaspersky-CyberTrace-App-for-Splunk/default/savedsearches.confThis configuration file specifies the parameters for alert templates.
Default commands.conf file
This file specifies the lookup script that Kaspersky CyberTrace App will use when the user runs the klsearch command.
Below, you can view the default contents of the commands.conf configuration file.
[klsearch] filename = kl_search.py |
Default inputs.conf file
This file specifies input settings for Kaspersky CyberTrace App.
By default, Kaspersky CyberTrace App does the following:
- It receives detection events from Feed Service at address
:9998. - It receives data from sources at address
:3000(and then forwards it to address127.0.0.1:9999, which is specified in outputs.conf).
Below, you can view the default contents of the inputs.conf configuration file.
[tcp://:9998] _INDEX_AND_FORWARD_ROUTING=local connection_host = dns index = main sourcetype = kl_cybertrace_events source = tcp:9998 disabled = false
[tcp://:3000] _TCP_ROUTING = service9999 |
Default outputs.conf file
This file specifies the output settings for Kaspersky CyberTrace App.
By default, Kaspersky CyberTrace App forwards data from the address :3000 to the Feed Service at the address 127.0.0.1:9999. The input port (:3000) is specified in inputs.conf.
Below, you can view the default contents of the outputs.conf configuration file.
[tcpout] defaultGroup = noforward disabled = false
[indexAndForward] index=true
[tcpout:service9999] disabled=false server = 127.0.0.1:9999 sendCookedData = false |
Default props.conf file
This file specifies how Splunk processes incoming data.
By default, Kaspersky CyberTrace App does the following:
- It defines how time stamps are extracted from incoming data.
- It defines a delimiter (line breaker) between events for incoming data.
For example, if the incoming data has the sequence
"%data_1%\n\n%data_2%"and the line breaker is one or more\nsymbols, Splunk splits this sequence into two events (%data_1%and%data_2%).
Below, you can view the default contents of the props.conf configuration file.
[source::tcp:3000] TIME_PREFIX = ^ MAX_TIMESTAMP_LOOKAHEAD = 17 TIME_FORMAT = %b %d %H:%M:%S LINE_BREAKER = ([\n]+) SHOULD_LINEMERGE = false
[source::tcp:9998] TIME_PREFIX = ^ MAX_TIMESTAMP_LOOKAHEAD = 17 TIME_FORMAT = %b %d %H:%M:%S LINE_BREAKER = ([\n]+) SHOULD_LINEMERGE = false |
Managing event sources
You can change the port Kaspersky CyberTrace App listens on for incoming events from a source, or add new event sources.
To change the port Kaspersky CyberTrace App listens on for incoming events from a source:
- In inputs.conf, change the default port number
3000to the port number that you want.For example, if you want to change
3000to3010, the record in inputs.conf looks like the following:[tcp://:3010]
_TCP_ROUTING = service9999
- In props.conf, also change the default port number 3000 to the port number that you want.
For example, if you want to change
3000to3010, the record in props.conf looks like the following:[source::tcp:3010]
TIME_PREFIX = ^
MAX_TIMESTAMP_LOOKAHEAD = 17
TIME_FORMAT = %b %d %H:%M:%S
LINE_BREAKER = ([\n]+)
SHOULD_LINEMERGE = false
- Restart Splunk.
To add a new event source:
- In inputs.conf, specify a new event source that uses the
service9999TCP routing rule.All data from this input will be forwarded to Feed Service.
- In props.conf, specify how data from this source must be processed.
- Restart Splunk.
Make sure that data from the new event source matches the regular expressions used by Kaspersky CyberTrace.
Below is an example of adding the address :3001 as the event source; it specifies that data from :3001 must be processed as are other input data in the default integration scheme (in this scheme, the forwarder, indexer, and search head are installed on a single computer).
# to inputs.conf [tcp://:3001] _TCP_ROUTING = service9999
# to props.conf [source::tcp:3001] TIME_PREFIX = ^ MAX_TIMESTAMP_LOOKAHEAD = 17 TIME_FORMAT = %b %d %H:%M:%S LINE_BREAKER = ([\n]+) SHOULD_LINEMERGE = false |
Changing the address and port for data from Feed Service
By default, Kaspersky CyberTrace App is configured to receive data from Feed Service at port 9998 at any available address. This is specified in the inputs.conf configuration file of Kaspersky CyberTrace App. If you want to receive data from Feed Service only at a specific address and port (for example, if Splunk has access to several network interfaces), edit the inputs.conf file accordingly.
Use the following rules to specify the address and port where data from Feed Service must be received by Kaspersky CyberTrace App:
- If Feed Service and Splunk are located on the same computer, use the following format to specify the port where data from Feed Service must be received by Kaspersky CyberTrace App:
[tcp://127.0.0.1:<port>] - If Feed Service and Splunk are located on different computers, use the following format to specify the address and port where data from Feed Service must be received by Kaspersky CyberTrace App:
[tcp://<address>:<port>] - To specify that Kaspersky CyberTrace App will receive data from Feed Service at any available address, use the following format:
[tcp://:<port>]Note that this format can affect security, because Kaspersky CyberTrace App will receive information at the specified port of every available network interface.
In the format examples above, <address> and <port> are the IP address and port that Kaspersky CyberTrace App will listen on for incoming data from Feed Service.
You may also have to change the addresses and ports for outbound events used by Kaspersky CyberTrace.
Below are examples of specifying the address and port where data from Feed Service is to be received.
In the following example, Feed Service and Splunk are located on the same computer. Kaspersky CyberTrace App receives detection events at port 9998 port of that same computer.
[tcp://127.0.0.1:9998] _INDEX_AND_FORWARD_ROUTING=local connection_host = dns index = main sourcetype = kl_cybertrace_events source = tcp:9998 disabled = false |
In the following example, Feed Service and Splunk are located on different computers. Kaspersky CyberTrace App receives detection events from Feed Service at address 192.0.2.42:9997.
[tcp://192.0.2.42:9997] _INDEX_AND_FORWARD_ROUTING=local connection_host = dns index = main sourcetype = kl_cybertrace_events source = tcp:9997 disabled = false |
In the following example, Kaspersky CyberTrace App receives detection events from Feed Service at port 3000 of any available address.
[tcp://:3000] _INDEX_AND_FORWARD_ROUTING=local connection_host = dns index = main sourcetype = kl_cybertrace_events source = tcp:3000 disabled = false |
Configuring alert templates
Kaspersky CyberTrace App comes with several alert templates that you can use and customize from the Alerts dashboard.
The following alert templates are available:
- Matches alert
This alert is triggered if there were matches with Kaspersky Threat Data Feeds in the past 24 hours.
- No Matches alert
This alert is triggered if there were no matches with Kaspersky Threat Data Feeds in the past 24 hours.
- Emergency alert
This alert is triggered if there were 5000 matches with Kaspersky Threat Data Feeds in the course of one minute.
- Service Unavailable alert
This alert is triggered if Feed Service is unavailable.
- Service Started alert
This alert is triggered when Feed Service is started.
Following are the default Kaspersky CyberTrace App settings:
- All of the alerts included in Kaspersky CyberTrace App are turned on.
To turn them off, use the Alerts dashboard.
- The "Add to Triggered Alerts" action is defined for all alerts.
Splunk will display the alert in Triggered Alerts.
To enable email notifications for alerts:
- In Kaspersky CyberTrace App, open Alerts.
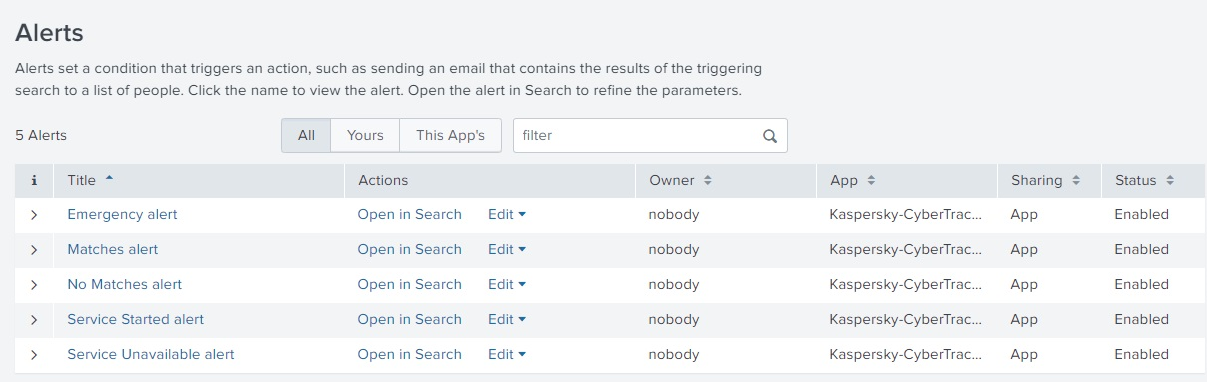
- Expand the parameters of an alert that you want to configure.
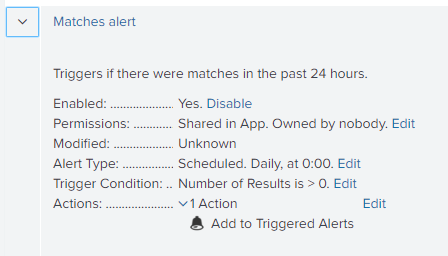
- Locate the Actions field, and then click Edit.
- Under Trigger Actions, click Add Actions.
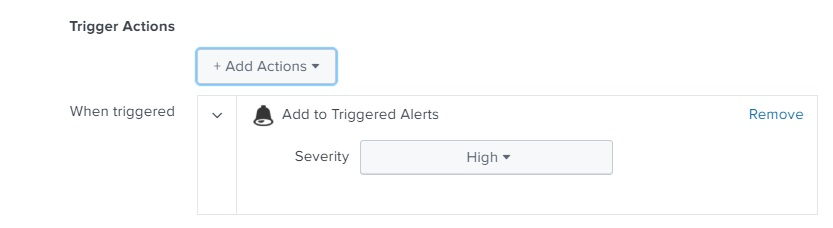
- From the list of options, select Send email.
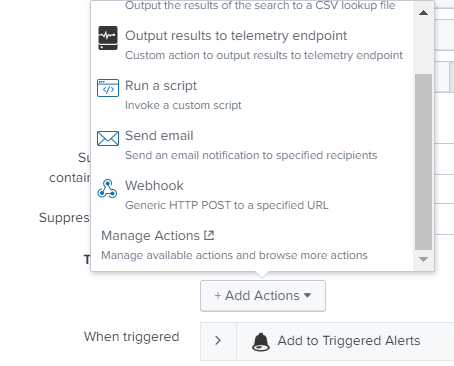
- Enter the email message parameters and save the changes.
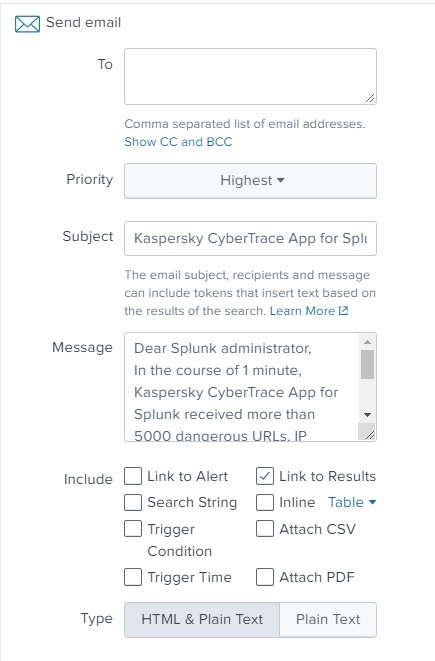
Step 3 (optional). Configuring the lookup script (single-instance deployment)
The lookup script is used to match individual URLs, IP addresses, and hashes to Kaspersky Threat Data Feeds. It can be invoked from the Indicators lookup tab in Kaspersky CyberTrace App.
To configure the lookup script:
- In Kaspersky CyberTrace App, go to the Indicators lookup tab.
- Specify Kaspersky CyberTrace connection strings:
- In the Kaspersky CyberTrace address field, specify the IP address of Kaspersky CyberTrace
- In the Kaspersky CyberTrace port field, specify the port that Kaspersky CyberTrace uses
The script is ready for use.
Page topStep 4. Performing the verification test (Splunk, single-instance integration)
This section explains how to check the capabilities of Kaspersky CyberTrace by performing the verification test.
Please make sure you perform the verification test before editing any matching process settings.
About the verification test
The verification test is a procedure that is used to check the capabilities of Kaspersky CyberTrace and to confirm the accuracy of the integration.
During this test you will check whether events from Splunk are received by Feed Service, whether events from Feed Service are received by Splunk, and whether events are correctly parsed by Feed Service using the regular expressions.
This section describes the verification scenario for the default integration scheme (in this scheme, the forwarder, indexer, and search head are installed on a single computer), but you can also use the verification test after changes were made to the configuration parameters to check that Kaspersky CyberTrace and the SIEM solution work correctly.
Verification test file
The %service_dir%/verification/kl_verification_test_cef.txt file is a verification test file. It contains a collection of events with URLs, IP addresses, and hashes.
Verification test scenario
To perform the verification test:
- Specify the Feed Service address in the Log Scanner utility configuration file.
- Send the verification file to Feed Service by using the Log Scanner utility.
If you run the Log Scanner utility, you cannot erase test data from the index.
- Compare the verification test results with the target numbers displayed on the Kaspersky CyberTrace Matches dashboard.
- Perform the Self-test.
The Self-test is an automatic feed test performed by Kaspersky CyberTrace App.
- Optionally, clear Splunk of events that arrived when the verification test was being performed.
Verification test scenario
The verification test scenario proceeds in stages:
Stage 1. Specifying the Feed Service address in the Log Scanner configuration file
Specify the address and port that Feed Service listens on in the Connection element of the Log Scanner configuration file.
Stage 2. Sending the verification file to Feed Service
You must send the verification file to Feed Service by using the Log Scanner utility.
Before you send the file, make sure that Feed Service is running.
The following commands send the contents of the kl_verification_test_cef.txt file to Feed Service:
- In Linux:
./log_scanner -p ../verification/kl_verification_test_cef.txt - In Windows:
log_scanner.exe -p ..\verification\kl_verification_test_cef.txt
After receiving data from Log Scanner, Feed Service sends the test results to Splunk. The address of Splunk is specified in the Service settings of Kaspersky CyberTrace. Also, this address is specified during the installation or reconfiguration of Kaspersky CyberTrace.
Stage 3. Checking the verification test results
In this step, you must verify that URLs, IP addresses, and hashes are processed correctly by Kaspersky CyberTrace App.
To check the verification test results:
- In Kaspersky CyberTrace App, on the navigation bar select Kaspersky CyberTrace Matches.
The Kaspersky CyberTrace Matches Dashboard opens.
- Compare numbers in the Matches by eventName panel to the numbers of the detected objects in the table shown below.
The verification test results depends on the feeds you use. The following table summarizes target numbers for the verification test when all commercial feeds are used.
Verification test results (commercial feeds)
Feed used
eventName value
Detected objects
Malicious URL Data Feed
KL_Malicious_URL
http://fakess123.nu
http://badb86360457963b90faac9ae17578ed.com
Phishing URL Data Feed
KL_Phishing_URL
http://fakess123ap.nu
http://e77716a952f640b42e4371759a661663.com
Botnet CnC URL Data Feed
KL_BotnetCnC_URL
http://fakess123bn.nu
http://a7396d61caffe18a4cffbb3b428c9b60.com
IP Reputation Data Feed
KL_IP_Reputation
192.0.2.0
192.0.2.3
Malicious Hash Data Feed
KL_Malicious_Hash_MD5
FEAF2058298C1E174C2B79AFFC7CF4DF
44D88612FEA8A8F36DE82E1278ABB02F
C912705B4BBB14EC7E78FA8B370532C9
Mobile Malicious Hash Data Feed
KL_Mobile_Malicious_Hash_MD5
60300A92E1D0A55C7FDD360EE40A9DC1
Mobile Botnet CnC URL Data Feed
KL_Mobile_BotnetCnC_Hash_MD5
001F6251169E6916C455495050A3FB8D
Mobile Botnet CnC URL Data Feed
KL_Mobile_BotnetCnC_URL
http://sdfed7233dsfg93acvbhl.su/steallallsms.php
Ransomware URL Data Feed
KL_Ransomware_URL
http://fakess123r.nu
http://fa7830b4811fbef1b187913665e6733c.com
Vulnerability Data Feed
KL_Vulnerable_File_Hash_MD5
D8C1F5B4AD32296649FF46027177C594
APT URL Data Feed
KL_APT_URL
http://b046f5b25458638f6705d53539c79f62.com
APT Hash Data Feed
KL_APT_Hash_MD5
7A2E65A0F70EE0615EC0CA34240CF082
APT IP Data Feed
KL_APT_IP
192.0.2.4
IoT URL Data Feed
KL_IoT_URL
http://e593461621ee0f9134c632d00bf108fd.com/.i
ICS Hash Data Feed
KL_ICS_Hash_MD5
7A8F30B40C6564EFF95E678F7C43346C
The following table summarizes target numbers for the verification test when only demo feeds are used.
Verification test results (demo feeds)
Feed used |
eventName value |
Detected objects |
DEMO Botnet_CnC_URL_Data_Feed |
KL_BotnetCnC_URL |
http://5a015004f9fc05290d87e86d69c4b237.com http://fakess123bn.nu |
DEMO IP_Reputation_Data_Feed |
KL_IP_Reputation |
192.0.2.1 192.0.2.3 |
DEMO Malicious_Hash_Data_Feed |
KL_Malicious_Hash_MD5 |
776735A8CA96DB15B422879DA599F474 FEAF2058298C1E174C2B79AFFC7CF4DF 44D88612FEA8A8F36DE82E1278ABB02F |
Stage 4. Performing the Self-test
The Self-test is an automatic feed test performed by Kaspersky CyberTrace App using the lookup script. You must verify that results of this test are correct.
To perform a Self-test:
- In Kaspersky CyberTrace App, on the navigation bar select Kaspersky CyberTrace Status.
The Kaspersky CyberTrace Status dashboard opens.
- For all the feeds that you use, check the
statusvalues in the Self-test panel:- If you use only demo feeds, the value for demo feeds must be
OKand values for all other feeds must beFALSE. - If you use commercial feeds, the value for all feeds that you use must be
OK. All other values including values for demo feeds must beFALSE.
- If you use only demo feeds, the value for demo feeds must be
The following figure shows an example of a Self-test results for commercial feeds. In this example, all commercial feeds are used, and demo feeds are not used. The value for demo feeds is FALSE, as expected.
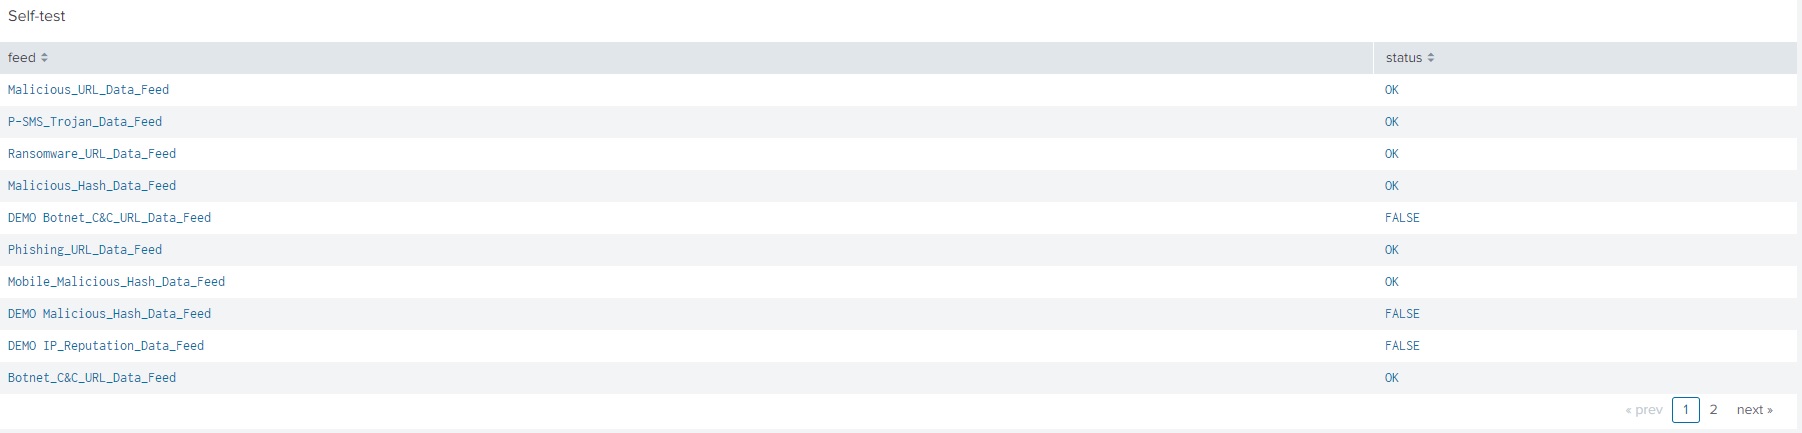
Self-test results
Stage 5 (optional). Clearing Splunk of events received when the verification test was performed
To clear Splunk of events received from Kaspersky CyberTrace when the verification test was performed:
- On the Search dashboard of the Splunk GUI, click the Search & Reporting button to run the Search & Reporting app.
- Delete the events from Kaspersky CyberTrace:
- In the Search field, type the following command:
index="main" sourcetype="kl_cybertrace_events" | delete - Click the All time split button next to the Search field.
If the split button has another name, click it and in the drop-down list select All time.
- Click Search (
 ).
).

Search & Reporting app
- In the Search field, type the following command:
Distributed integration scheme (Splunk)
This section contains instructions for integrating Kaspersky CyberTrace and Splunk in the distributed integration scheme.
For a description of the integration process, see Integration guide (Splunk).
For a description of distributed integration scheme, see About the distributed integration scheme.
About the distributed integration scheme
Kaspersky CyberTrace supports distributed Splunk environments. The integration scheme for distributed Splunk environments is called the distributed integration scheme.
About the apps and services used in the distributed integration scheme
In the distributed integration scheme, Kaspersky CyberTrace is divided into two apps and one service:
- Feed Service
This service matches Splunk events against Kaspersky Threat Data Feeds.
Feed Service sends the resulting events to a single indexer that keeps the index with events from Kaspersky CyberTrace.
This service can be installed on a separate computer.
- Kaspersky CyberTrace App Search Head (or Search Head App)
This app contains Kaspersky CyberTrace App dashboards, alert templates, and the lookup script.
This app is intended for installation on a Splunk instance that acts as a search head and sends search requests to the indexer that keeps the index with events from Kaspersky CyberTrace.
- Kaspersky CyberTrace App Forwarder (or Forwarder App)
This app contains rules for forwarding events from Splunk to Feed Service. It also receives events from Feed Service.
This app is intended for installation on Splunk instances that must forward events to Feed Service.
About the integration scheme variants
The following variants of the distributed integration scheme demonstrate a general approach to integrating Kaspersky CyberTrace with your distributed Splunk environment. Depending on how your distributed Splunk environment is organized, you may have to change or combine these variants.
One indexer, multiple forwarders variant
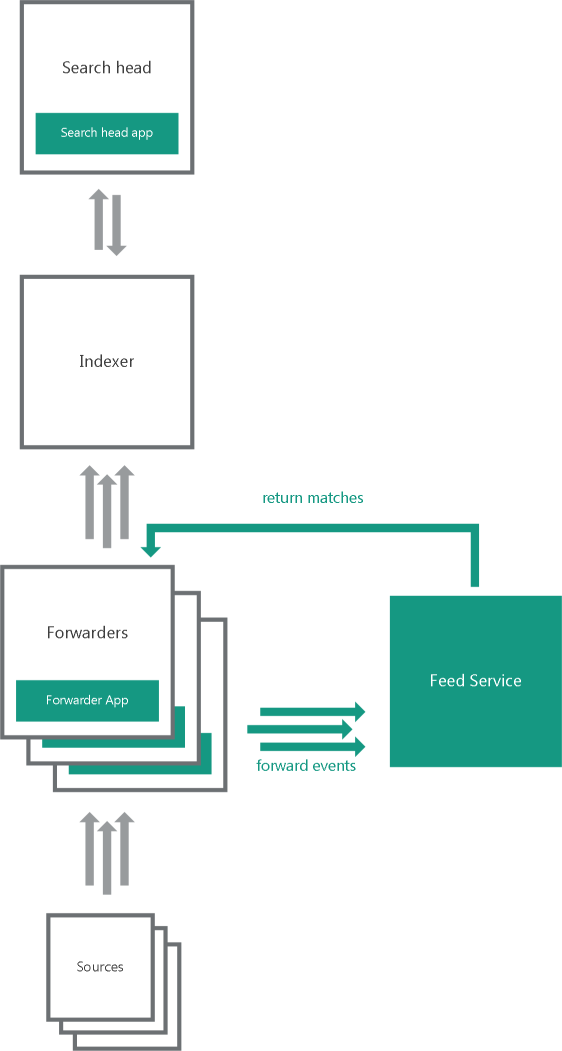
One indexer, multiple forwarders
In the one indexer, multiple forwarders variant, several heavy forwarders parse and send events directly to Feed Service. These forwarders must use Forwarder App. One of the forwarders receives matches from Feed Service. The forwarders send the matches to the indexers that store them in the index used by Kaspersky CyberTrace for Splunk Search Head App.
Multiple indexers, multiple forwarders variant
In the multiple indexers, multiple forwarders variant, several heavy forwarders parse and send events directly to Feed Service. These forwarders must use Forwarder App. One of the forwarders receives matches from Feed Service. The forwarders send the matches to the indexers that store them in the index used by Kaspersky CyberTrace App.
Default ports and addresses
By default, Forwarder App and Feed Service are configured to use certain addresses and ports for forwarding events and receiving matches. You must change these addresses and ports based on the organization of your distributed Splunk environment.
You must change the default addresses and ports that are used by Forwarder App and Feed Service.
By default, Forwarder App:
- Receives events at
:3000port. - Receives events from Kaspersky CyberTrace at
:9998port. These events are stored in themainindex. - Forwards events to
127.0.0.1:9999.
By default, Feed Service does the following:
- Receives events at
127.0.0.1:9999. - Sends its own events to
127.0.0.1:9998.
Event format
By default, Kaspersky CyberTrace App and Feed Service are configured to receive events in a certain format:
- Feed Service parses events with regular expressions defined in its configuration file (the regular expressions are also displayed in Kaspersky CyberTrace Web). These regular expressions are created for a specific format of inbound data. For example, the default regular expression for URLs will match a URL containing the protocol (for example, HTTP, HTTPS). If the URLs in the events generated by your devices do not contain the procotol, change the regular expression accordingly.
- The lookup script that comes with Kaspersky CyberTrace App (or Search Head App in the case of the distributed integration scheme) sends events to Feed Service in a format that matches the regular expressions used by Feed Service.
Step 1. Installing Forwarder and Search Head apps
In the distributed deployment scheme, you must install Forwarder App and Search Head App on the basis of the organization of your distributed Splunk environment. For more information about how to choose the computers where the apps must be installed, see the section about the distributed integration scheme.
Forwarder App is installed from the %service_dir%/integration/splunk/Kaspersky-CyberTrace-App-for-Splunk_Forwarder.tar.gz file. Search Head App is installed from the %service_dir%/integration/splunk/Kaspersky-CyberTrace-App-for-Splunk_Search-Head.tar.gz file.
Installing the apps
Forwarder App and Search Head App are installed from Splunk Web. The only difference in the installation process is the application file name.
To install Forwarder App or Search Head App:
- Open Splunk Web for the Splunk instance where you want to install the app.
- In Splunk Web, go to the home page.
- On the home page, click the Manage Apps button.
Manage Apps button
- On the Apps page, click the Install app from file button.
Install app from file button
- In the Upload an app window, click Choose File and select the application file mentioned above in this section.
Choose File button
- In the Upload an app window, click the Upload button.
Upload button
- In the Restart required window, click the Restart Splunk button.
This step can be skipped, depending on the Splunk version. If Splunk does not display the Restart required window, skip this step.
Restart Splunk button
- When Splunk starts again, the Forwarder App will be displayed in the list of installed apps. When Kaspersky Search Head App is installed, the Apps page will open with information about the successful installation of Kaspersky Search Head App. Kaspersky Search Head App will appear in the list of apps on the Splunk home page.
Kaspersky Search Head App for Splunk in the list of apps
Step 2. Configuring Forwarder and Search Head apps (distributed deployment)
In the distributed deployment scheme, you must configure Forwarder App on the basis of the organization of your distributed Splunk environment. For example, the configuration changes may include changing the Feed Service address used by the apps, or adding new event sources for Forwarder App. For Search Head App, you may have to configure the email addresses for alerts.
Configuration actions for Forwarder App and Search Head App
For Forwarder App, you may have to do the following:
- Change the address and port for forwarding events to Feed Service. See subsection "Changing the address and port for forwarding data to Feed Service" below.
- Configure Forwarder App to send events to the Indexer (or multiple Indexers). By default, events that are sent from Forwarder App to Feed Service are not registered in the indexes. See subsection "Configuring Forwarder App to send events to indexes" below.
- If several Forwarder Apps are used, only one Forwarder App must receive events from Kaspersky CyberTrace at port
9998. For all other Forwarder Apps, disable this rule by specifyingtruein thedisabledparameter for this rule in the Forwarder App configuration file. The IP address and port of the Forwarder App that will receive events from Kaspersky CyberTrace must be specified on the Settings > Service tab in Kaspersky CyberTrace Web. - Add new event sources. See subsection "Adding new event sources" below.
For Search Head App, you may have to do the following:
- Add email addresses to alert templates. See "Adding email addresses to alert templates" below.
Restart Splunk after you make changes to the configuration files.
Edit only those Forwarder App and Search Head App configuration files that are described in this section. Editing other configuration files may result in unpredictable behavior.
Configuration files (distributed deployment)
The following table summarizes configuration files used by Forwarder App and Search Head App in the following distributed deployment scheme variants:
- One indexer, multiple forwarders
- Multiple indexers, multiple forwarders
Configuration files of Forwarder App and Search Head App
Application
Configuration file
Default rules
Forwarder App
\default\inputs.confReceives data from sources at port
3000and forwards it as configured inoutputs.conf.Receives events from Kaspersky CyberTrace at
:9998port.Forwarder App
\default\outputs.confForwards data to
127.0.0.1:9999(Feed Service address).Forwarder App
\default\props.confParse data received at
:3000. For a description of default data parsing rules, see "Default data parsing rules" below.Search Head App
\default\savedsearches.confRules for alert templates.
Default data parsing rules
The way in which Forwarder App parses incoming data is defined in the props.conf file. By default, Forwarder App does the following:
- Defines how time stamps are extracted from incoming data.
- Defines a delimiter (line breaker) between events for incoming data.
For example, if the incoming data has the sequence
"%data_1%\n\n%data_2%"and the line breaker is one or more\nsymbols, Splunk splits this sequence into two events (%data_1%and%data_2%).
The following are the default rules used by Forwarder App to parse incoming data.
TIME_PREFIX = ^ MAX_TIMESTAMP_LOOKAHEAD = 17 TIME_FORMAT = %b %d %H:%M:%S LINE_BREAKER = ([\n]+) SHOULD_LINEMERGE = false |
Changing the address and port for forwarding data to Feed Service
By default, Forwarder App is configured to forward data to Feed Service at 127.0.0.1:9999.
To change the address and port for forwarding data to Feed Service,
In the outputs.conf configuration file, in the [tcpout:service9999] section, specify the new address and port for the server parameter that will be used by Feed Service.
In the following example, 192.0.2.100:9999 is specified as the Feed Service address.
[tcpout:service9999] disabled=false server = 192.0.2.100:9999 sendCookedData = false |
Adding new event sources
To add new event sources, edit the inputs.conf and props.conf configuration files of the app.
To add a new event source:
- In inputs.conf, specify a new event source that uses the
service9999TCP routing rule.All data from this input will be forwarded to Feed Service.
- In props.conf, specify how data from this source must be processed.
- Restart Splunk.
Make sure that data from the new event source matches the regular expressions used by Kaspersky CyberTrace.
Below is an example of adding the address :3001 as the event source; it specifies that data from the address :3001 must be processed as other input data in the default integration scheme (in this scheme, the forwarder, indexer, and search head are installed on a single computer).
# to inputs.conf [tcp://:3001] _TCP_ROUTING = service9999
# to props.conf [source::tcp:3001] TIME_PREFIX = ^ MAX_TIMESTAMP_LOOKAHEAD = 17 TIME_FORMAT = %b %d %H:%M:%S LINE_BREAKER = ([\n]+) SHOULD_LINEMERGE = false |
If Splunk Forwarder is already configured for receiving events from different event sources and you want to send events to Feed Service, perform the following procedure. This can be done if the server field of the outputs.conf configuration file of Forwarder App contains the IP address and port that are specified in the InputSettings > ConnectionString element of the Feed Service configuration file.
To forward events to Feed Service:
- In the outputs.conf file that is used for forwarding events from Splunk (it can be either the outputs.conf file of a custom Splunk application or the
%SPLUNK_DIR%/etc/system/local/inputs.conffile), in thedefaultGroupfield, add a comma and a stringservice9999.In this case, check the event forwarding logic and make sure that events that arrived from Feed Service are not sent again to Feed Service by Splunk.
If the inputs.conf configuratioin file contains the
_TCP_ROUTINGparameter for those event sources, the events from which are sent to Feed Service, add a comma and theservice9999string to the_TCP_ROUTINGparameter. - Restart Splunk.
Configuring Forwarder App to send events to indexes
By default, events that are sent from Forwarder App to Feed Service are not registered in the indexes. You can change this behavior by configuring Forwarder App.
To configure Forwarder App to send events to the main index:
- Locate the Forwarder that you want to configure. This Forwarder is typically a machine with Forwarder App installed. You must configure all Forwarders that are used in your distributed integration scheme.
- On the Forwarder, in the
%SPLUNK_HOME%\etc\system\local\outputs.conffile, locate the name of the target group that is used for sending events to the Indexer (or multiple Indexers). Here%SPLUNK_HOME%is the Splunk installation directory.By default, the name of this group is default-autogroup-lb:
[tcpout: default-autogroup-lb] - In the
inputs.conffile used by the Forwarder App, locate the section withservice9999TCP routing rule:_TCP_ROUTING = service9999 - Add the name of the target group to this rule.
For example, if the name of the target group is default-autogroup-lb, the rule must be changed in the following way:
_TCP_ROUTING=service9999, default-autogroup-lb - Restart Splunk on the Forwarder.
Configuring alert templates
For more information about configuring alert templates, see "Configuring alert templates" in Step 2 (optional). Configuring Kaspersky CyberTrace App.
Page topStep 3 (optional). Configuring the lookup script (distributed deployment)
The lookup script is used to match individual URLs, IP addresses, and hashes to Kaspersky Threat Data Feeds. It can be invoked from the Indicators lookup tab in Kaspersky CyberTrace App for Search Head.
To configure the lookup script:
- In Kaspersky CyberTrace App, go to the Indicators lookup tab.
- Specify Kaspersky CyberTrace connection strings:
- In the Kaspersky CyberTrace address field, specify the IP address of Kaspersky CyberTrace
- In the Kaspersky CyberTrace port field, specify the port that Kaspersky CyberTrace uses
The script is ready for use.
Page topStep 4. Performing the verification test (Splunk, distributed integration)
The verification test for the distributed integration of Kaspersky CyberTrace with Splunk is performed in the same way as the verification test for the single-instance integration.
Page topIntegration with ArcSight
This chapter describes how to integrate Kaspersky CyberTrace with ArcSight.
Integration steps (ArcSight)
This chapter describes how to integrate Kaspersky CyberTrace with ArcSight products.
About the integration schemes
Kaspersky CyberTrace can be integrated with ArcSight in several integration schemes. For more information about the integration schemes for ArcSight, see Integration schemes (ArcSight).
How to integrate with ArcSight
To integrate Kaspersky CyberTrace with ArcSight:
- Before you install Kaspersky CyberTrace, make sure that ArcSight SmartConnector is installed.
- Make sure that you have installed Kaspersky CyberTrace.
- Import the Kaspersky_CyberTrace_Connector.arb package.
- Install ArcSight Forwarding Connector using one of two options:
- Configure Kaspersky CyberTrace for interaction with ArcSight.
- Perform the verification test.
Please make sure you perform the verification test before editing any matching process settings.
Before you begin (ArcSight)
ArcSight SmartConnector must be installed before you install Kaspersky CyberTrace. This section describes how to install ArcSight SmartConnector.
Installing ArcSight SmartConnector (Linux)
This section describes how to install ArcSight SmartConnector.
To install ArcSight SmartConnector:
- Run the ArcSight SmartConnector installation application.
This application is a component of HP ArcSight and is not included in Kaspersky CyberTrace.
- Select the ArcSight SmartConnector installation directory (hereinafter referred to as
%ARCSIGHT_HOME%). - Instruct the installer not to create links.
- After the contents of the binary file are unpacked, select Add a Connector.
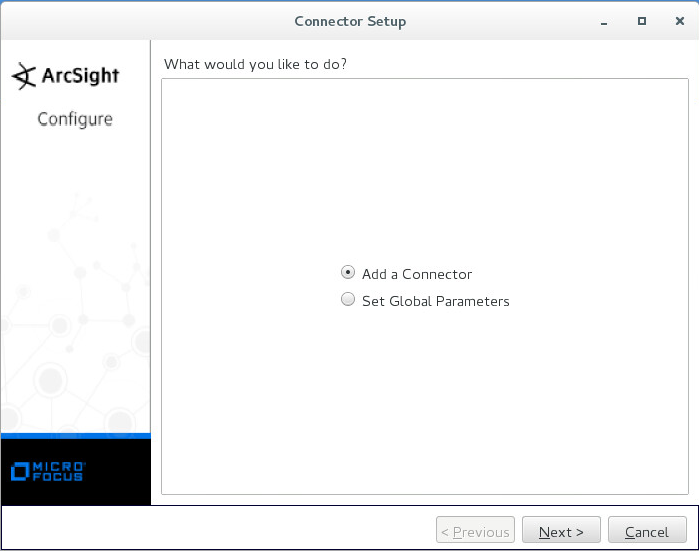
Adding a connector
If this window is not displayed, configure ArcSight SmartConnector manually. For this purpose, run the following command:
%ARCSIGHT_HOME%/current/bin/runagentsetup.sh - Select Syslog Daemon as the connector type.
- In the Enter the parameter details form, specify the following data:
- Network Port—Port to which Feed Service will send detection events.
It is the same port that is specified on the Settings > Service tab of Kaspersky CyberTrace Web (by default, it is
9998). - IP Address—IP address to which Feed Service will send detection events.
It is the same IP address that is specified on the Settings > Service tab of Kaspersky CyberTrace Web (by default, it is
127.0.0.1).You can specify
(ALL)if you want Arcsight SmartConnector to receive events from all network interfaces of the computer on which it runs. (Note that you cannot specify(ALL)in the Feed Service configuration file.) - Protocol—Specify
Raw TCP. - Forwarder—Specify
false.
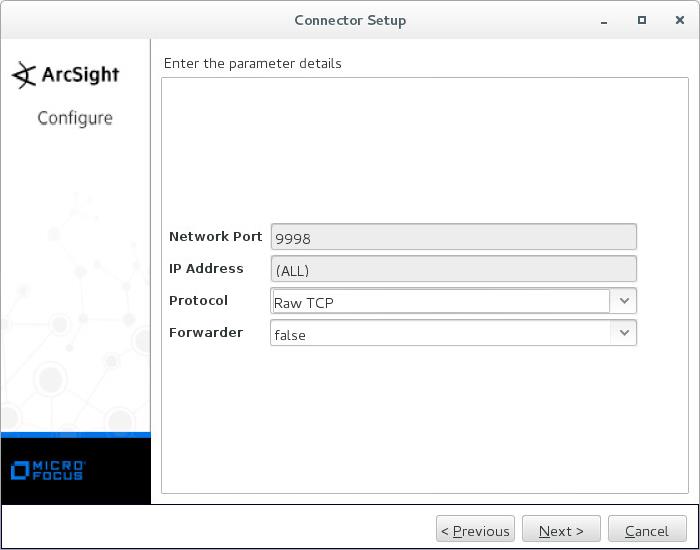
Parameters for sending detection events
Click Next.
- Network Port—Port to which Feed Service will send detection events.
- Specify ArcSight Manager (encrypted) as the type of destination.
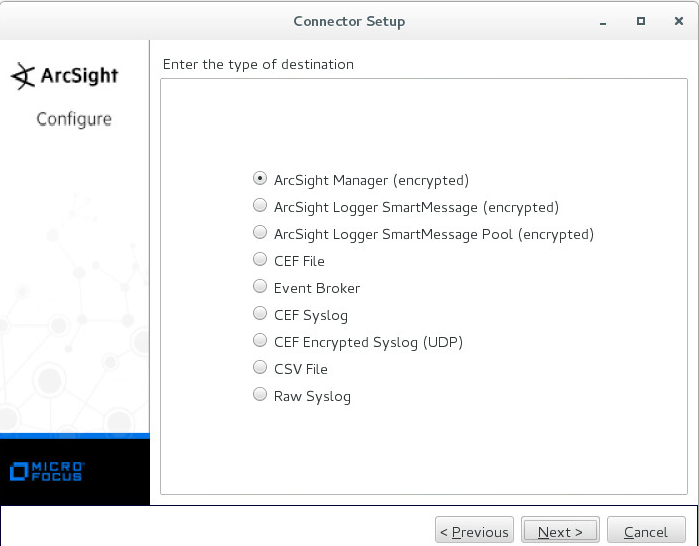
Type of destination
Click Next.
- Specify other destination settings:
- Manager Hostname—Host where ArcSight Manager is running.
- Manager Port—Port where ArcSight Manager is available.
By default, it is 8443.
- User—Name of the ArcSight ESM user that has rights for registering the connector.
- Password—Password of the ArcSight ESM user.
- AUP Master Destination—Specify false.
- Filter Out All Events—Specify false.
- Enable Demo CA—Specify false.
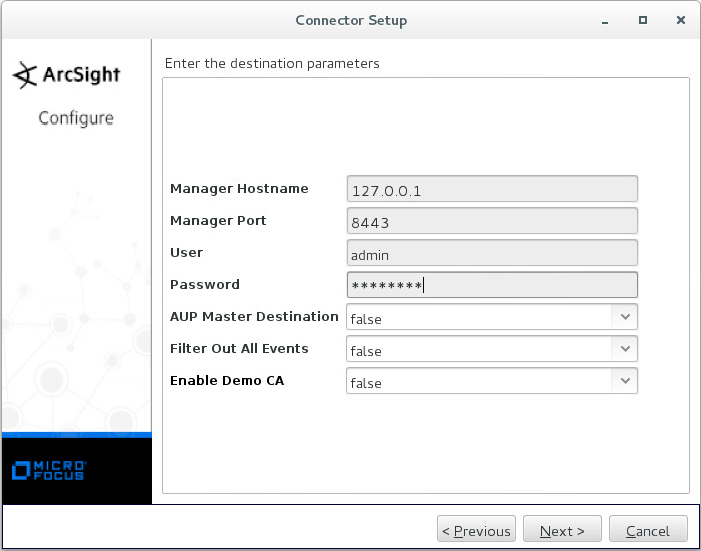
Destination parameters
Click Next.
- Specify the connector details: the name (arbitrary value permitted), location (arbitrary value permitted), location of the device that will send events to the connector (arbitrary value permitted, can be empty), and comment about the connector (arbitrary value permitted, can be empty).
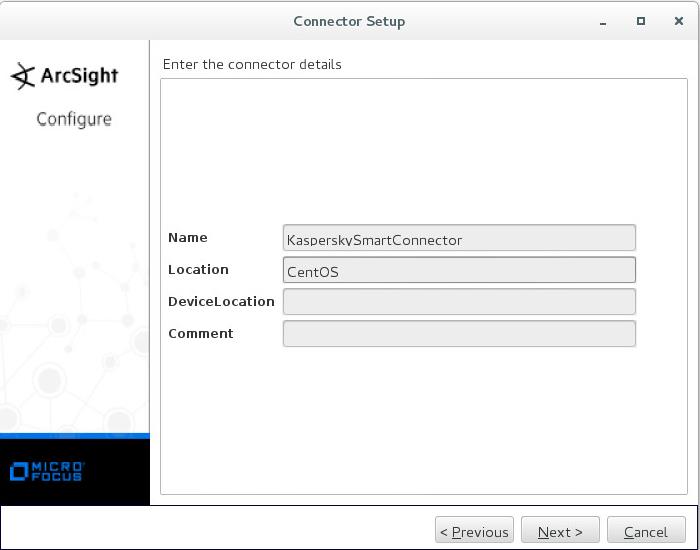
Connector details
Click Next.
- If the ArcSight Manager parameters are valid, accept importing the certificate from the destination.
- If the certificate is imported successfully, install the ArcSight SmartConnector service.
- If you do not run the installation as root, a warning will be displayed.
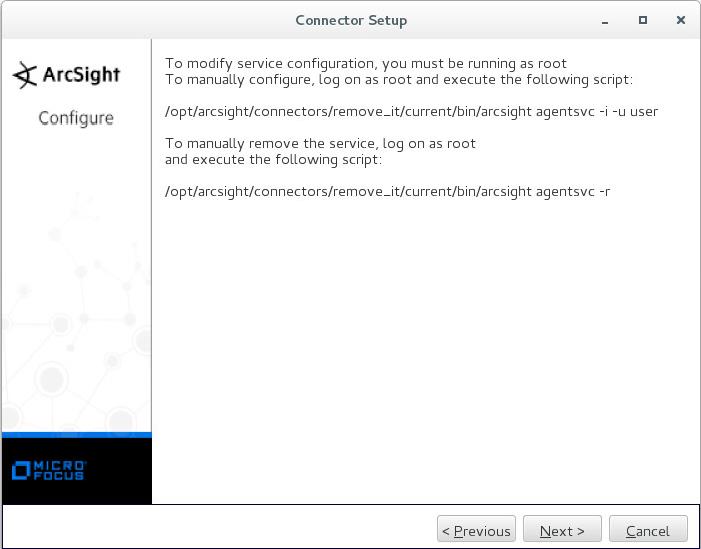
Warning about user privileges
You can either run the Connector Setup Wizard as root, or run the following command as root:
%ARCSIGHT_HOME%/current/bin/arcsight agentsvc -i -u $username -sn $service_nameHere
$usernameis the name of the operating system user that will run the service.$service_nameis the service name.We recommend that you set the service name to be the same as the connector name.
The
%ARCSIGHT_HOME%/current/logs/agent.loglog file will contain messages about the installation process.Skip the next step that describes how to specify the service parameters.
- If you run the installation as root, select Install as a service.
Click Next.
- Specify the service parameters.
We recommend that you set the service name to be the same as the connector name.
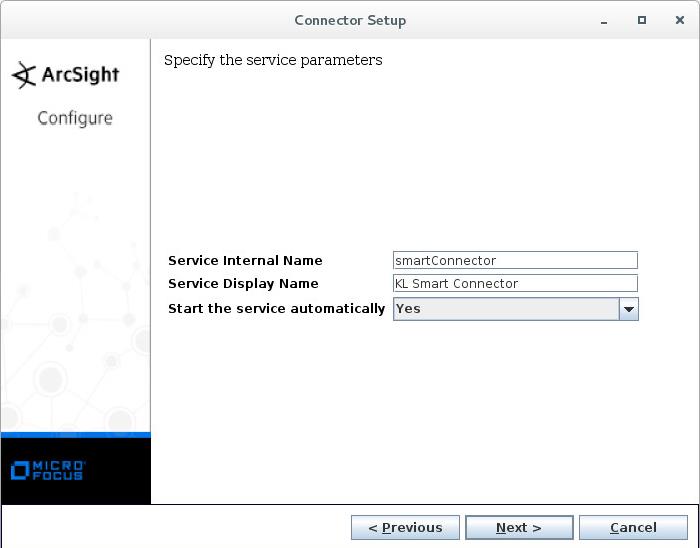
Specifying service parameters
Click Next.
- Start ArcSight SmartConnector by calling the following command:
/etc/init.d/arc_$service_name startIn this command,
$service_nameis the service name.
After you have installed ArcSight SmartConnector, you can install Feed Service and integrate it with ArcSight. For more information, see Integration steps (ArcSight).
Page topInstalling ArcSight SmartConnector by using the console (Linux)
You can install ArcSight SmartConnector on Linux by using the console instead of the GUI installer.
To install ArcSight SmartConnector by using the console:
- In the console, run the ArcSight SmartConnector installer.
- Read the Introduction section and press Enter.
- When prompted, select Choose Install Folder, and type the full path to the directory where ArcSight SmartConnector will be installed (
%ARCSIGHT_HOME%).The default value of the installation directory is
/root/ArcSightSmartConnectors. - When prompted, select Choose Link Location, and specify whether a link to the installation directory must be created.
We recommend that you specify
Don't create links. - Make sure that the Pre-Installation Summary section lists the correct values of the installation settings. Press Enter if the values are correct.
After ArcSight SmartConnector is installed, the following information will be displayed in the console:
Installation Complete---------------------The core components of the ArcSight SmartConnector have been successfully installed to:%ARCSIGHT_HOME%To finish the configuration of the SmartAgent, please go to the folder:%ARCSIGHT_HOME%/current/bin/and execute the script:./runagentsetup.sh - Run
%ARCSIGHT_HOME%/current/bin/runagentsetup.sh. - Run
Add a Connector. - Specify
Syslog Daemonas the connector type. - Specify the following settings of the connector:
- Network Port
Specify the port to which Feed Service sends events. This port is specified on the Settings > Service tab of Kaspersky CyberTrace Web (by default, it is
9998). - IP Address
Specify the IP address to which Feed Service sends events. This IP address is specified on the Settings > Service tab of Kaspersky CyberTrace Web (by default, it is
127.0.0.1).You can specify
ALLif you want Arcsight SmartConnector to receive events from all network interfaces of the computer on which it runs. (Note that you cannot specifyALLin the Feed Service configuration file.) - Protocol
Specify
Raw TCP. - Forwarder
Specify
false.
- Network Port
- Specify
ArcSight Manager (encrypted)as the destination type. - Specify whether to mask passwords.
It is recommended to specify
yes. - Specify the following connection settings of ArcSight Manager:
- Manager Hostname
ArcSight Manager host.
- Manager Port
ArcSight Manager port. By default, it is
8443. - User
Name of the user that has the right to register a connector in ArcSight.
- Password
Password of the specified user.
- AUP Master Destination
Specify
False. - Filter Out All Events
Specify
False. - Enable Demo CA
Specify
False.
- Manager Hostname
- Specify the following connector settings:
- Name
Arbitrary value can be specified.
- Location
Arbitrary value can be specified.
- DeviceLocation
Arbitrary value can be specified.
- Comment
Arbitrary value can be specified.
After this, the connector will be registered.
- Name
- Specify the following action for importing the certificate:
Import the certificate to connector from destination. - Make sure that the displayed data to check is correct.
If correct data is displayed, type
yes. - Specify how the connector must be installed:
Install as a service. - Specify the service settings:
- Service Internal Name
- Service Display Name
- Start the service automatically
Indicates whether the service will start on the system startup. We recommend that you specify
yes.
- Check the specified data. If it is correct, press Enter.
The connector will be installed as a service.
- Start the connector by calling the following command:
/etc/init.d/arc_$service_name startIn this command,
$service_nameis the service internal name that you specified.
After you have installed ArcSight SmartConnector, you can install Kaspersky CyberTrace and integrate it with ArcSight.
Page topInstalling ArcSight SmartConnector (Windows)
This section describes how to install ArcSight SmartConnector on Windows.
To install ArcSight SmartConnector:
- Run the ArcSight SmartConnector installation application.
This application is a component of HP ArcSight and is not included in Kaspersky CyberTrace.
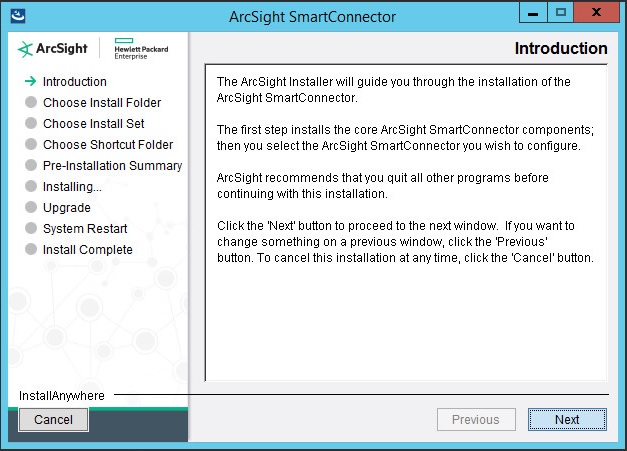
SmartConnector installation: Introduction
- Select the ArcSight SmartConnector installation folder (hereinafter referred to as
%ARCSIGHT_HOME%).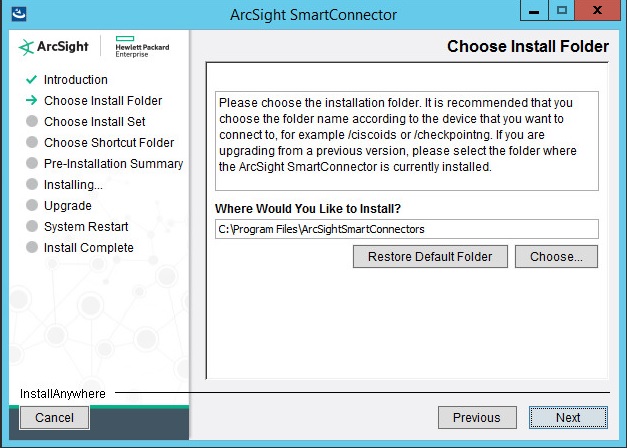
Choosing an installation folder
- Set the installation type to Typical.
- Select the location where a shortcut for the connector will be created.
You can also choose not to create icons.
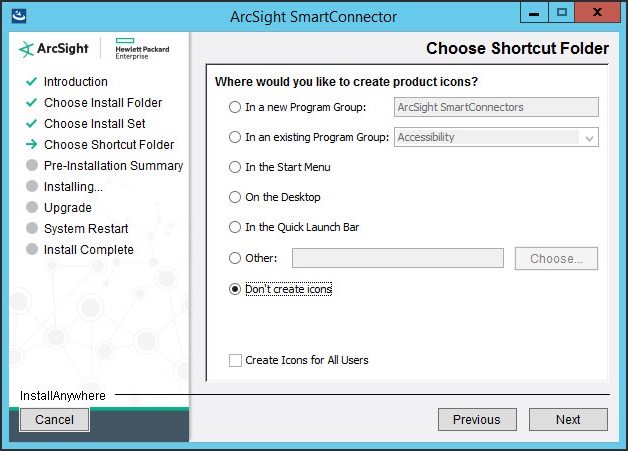
Choosing a shortcut folder
- After the contents of the binary file are unpacked, click Add a Connector.
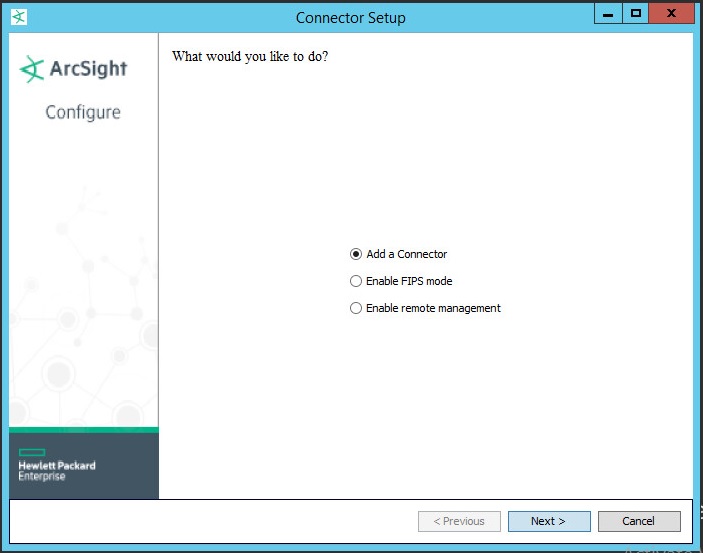
Adding a connector
If this window is not displayed, configure ArcSight SmartConnector manually. For this purpose, run the following command:
%ARCSIGHT_HOME%\current\bin\runagentsetup.bat - Select Syslog Daemon as the connector type.
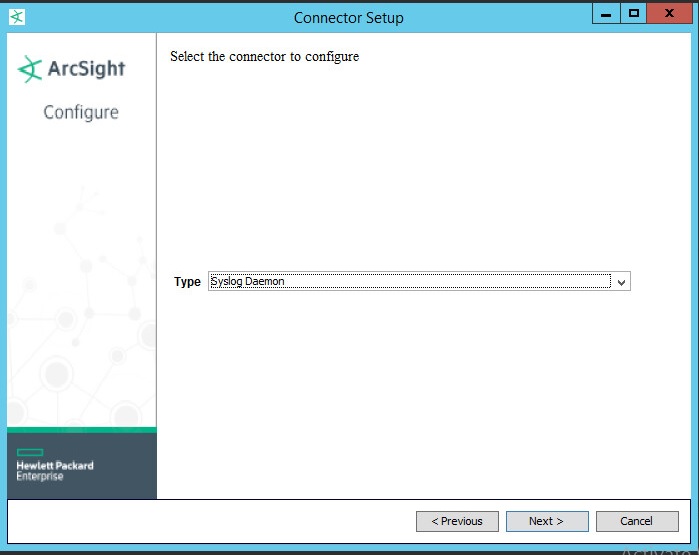
Selecting the connector type
Click Next.
- In the Enter the parameter details form, specify the following data:
- Network Port—Port to which Feed Service will send detection events.
It is the same port that is specified on the Settings > Service tab of Kaspersky CyberTrace Web (by default, it is
9998). - IP Address—IP address to which Feed Service will send detection events.
It is the same IP address that is specified on the Settings > Service tab of Kaspersky CyberTrace Web (by default, it is
127.0.0.1).You can specify
ALLif you want Arcsight SmartConnector to receive events from all network interfaces of the computer on which it runs. (Note that you cannot specifyALLin the Feed Service configuration file.) - Protocol—Specify
Raw TCP. - Forwarder—Specify
false.
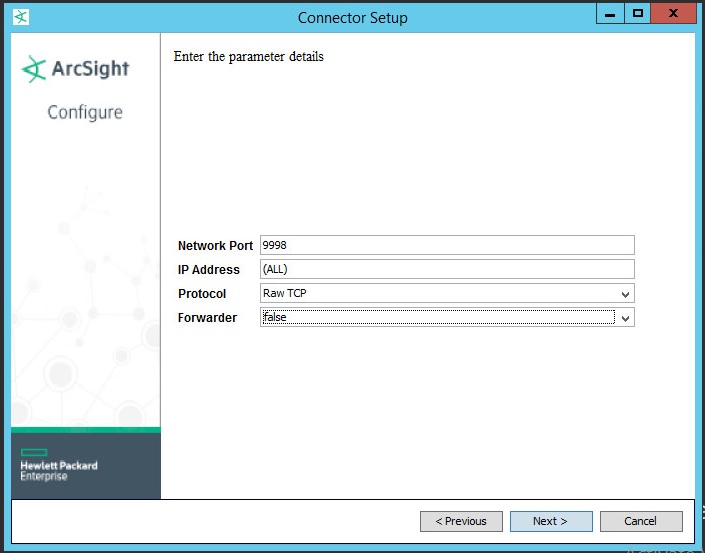
Parameters for sending detection events
Click Next.
- Network Port—Port to which Feed Service will send detection events.
- Specify ArcSight Manager (encrypted) as the type of destination.
Click Next.
- Specify other destination parameters:
- Manager Hostname—Host where ArcSight Manager is running.
- Manager Port—Port where ArcSight Manager is available.
By default, it is 8443.
- User—Name of the ArcSight ESM user that has rights for registering the connector.
- Password—Password of the ArcSight ESM user.
- AUP Master Destination—Specify false.
- Filter Out All Events—Specify false.
- Enable Demo CA—Specify false.
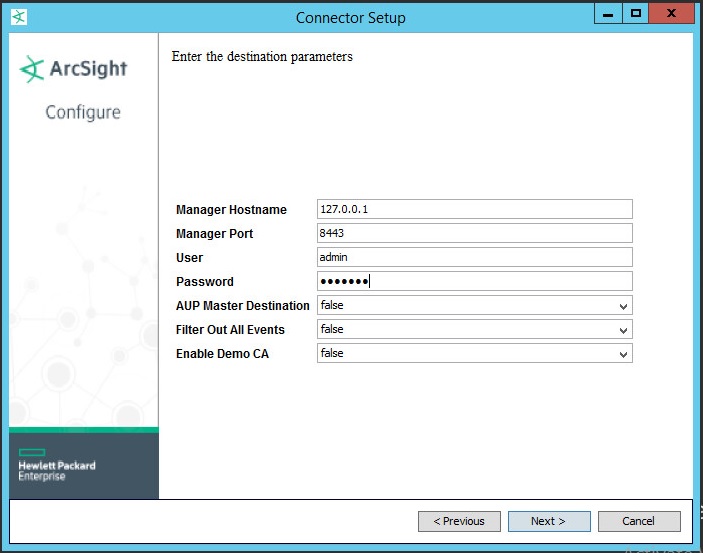
Destination parameters
Click Next.
- Specify the connector details: the name (arbitrary value permitted), location (arbitrary value permitted), location of the device that will send events to the connector (arbitrary value permitted, can be empty), and comment about the connector (arbitrary value permitted, can be empty).
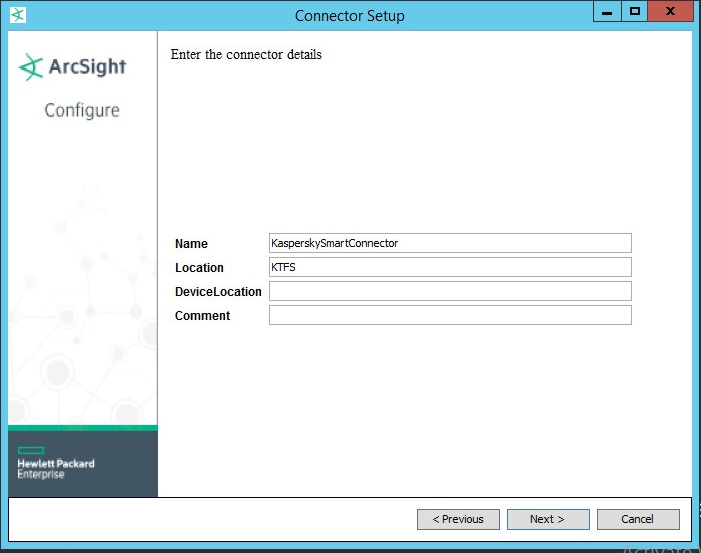
Connector details
Click Next.
- If the ArcSight Manager parameters are valid, accept importing the certificate from the destination.
- If the certificate is imported successfully, you will be asked to install ArcSight SmartConnector either as a service or as an application. We recommend that you install it as a service.
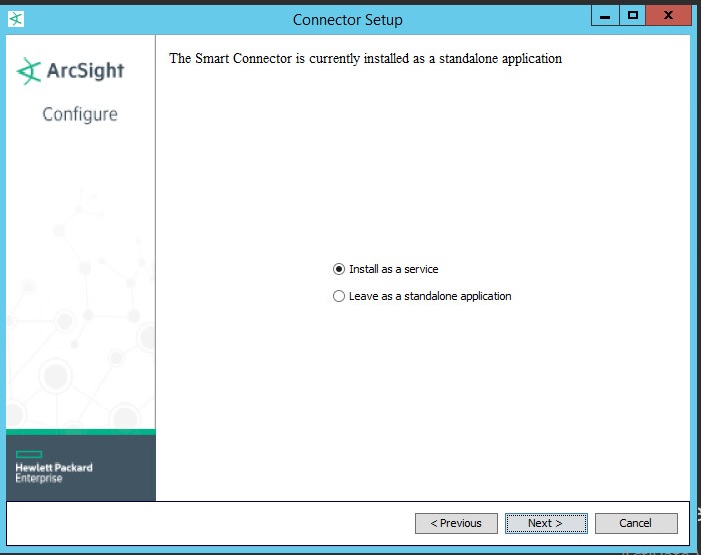
Choosing installation mode
Click Next.
- Specify the service parameters.
We recommend that you set the service name to be the same as the connector name.
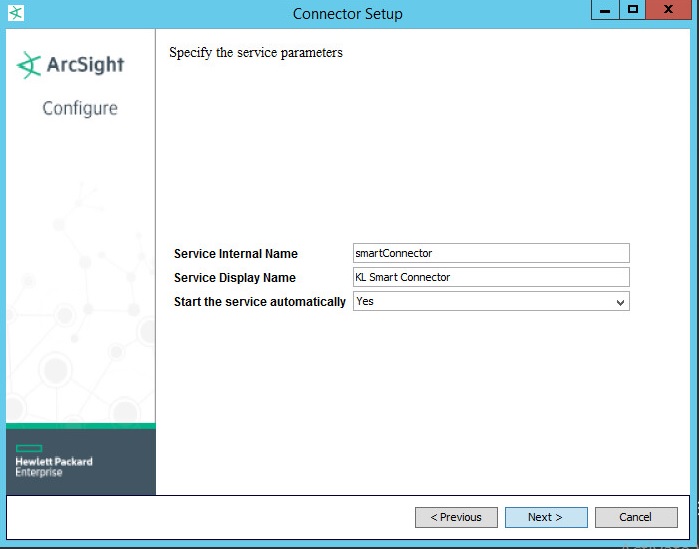
Specifying service parameters
Click Next.
The operation summary is displayed.
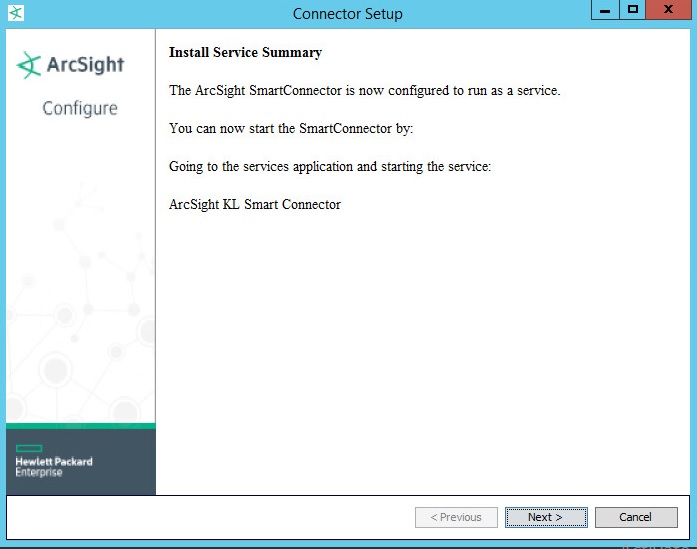
SmartConnector installation: Operation summary
- In the
%ARCSIGHT_HOME%/current/user/agent/agent.propertiesconfiguration file, specify30000in theagents[0].tcppeerclosedchecktimeoutparameter. - Make sure that the service named
ArcSight %ServiceDisplayName%is running (%ServiceDisplayName%is the name that you specified in the Service Display Name box in the previous step).For this purpose, open Windows Task Manager and check the status of the service. The status must be
Running. Using Windows Task Manager, you can stop or start the service.
Standard integration (ArcSight)
This section contains instructions for integrating Kaspersky CyberTrace with ArcSight in different integration schemes.
Integration schemes (ArcSight)
This section describes possible integration schemes of ArcSight products and Kaspersky CyberTrace.
About the components of the standard integration scheme
The following components are used in the integration schemes for ArcSight:
- ArcSight ESM
This SIEM solution is used in this integration.
- Forwarding Connector
This ArcSight component sends ArcSight events to Feed Service.
- Feed Service
This service matches ArcSight events against Kaspersky Threat Data Feeds.
- SmartConnector
This ArcSight component sends events generated by Feed Service to ArcSight.
- Security controls
These are sources of events for ArcSight such as firewalls, proxies, intrusion detection systems, and other networking devices. Security controls can send events to ArcSight via any method supported by ArcSight.
ArcSight ESM, ArcSight Forwarding Connector, ArcSight SmartConnector, and Feed Service can be installed on the same computer or connect over a network. ArcSight ESM and ArcSight Forwarding Connector run on Linux, so they must be installed separately from Feed Service.
The figures in the following sections show some of the possible integration schemes.
Single-computer installation
The figure below depicts all four components installed on a single computer.
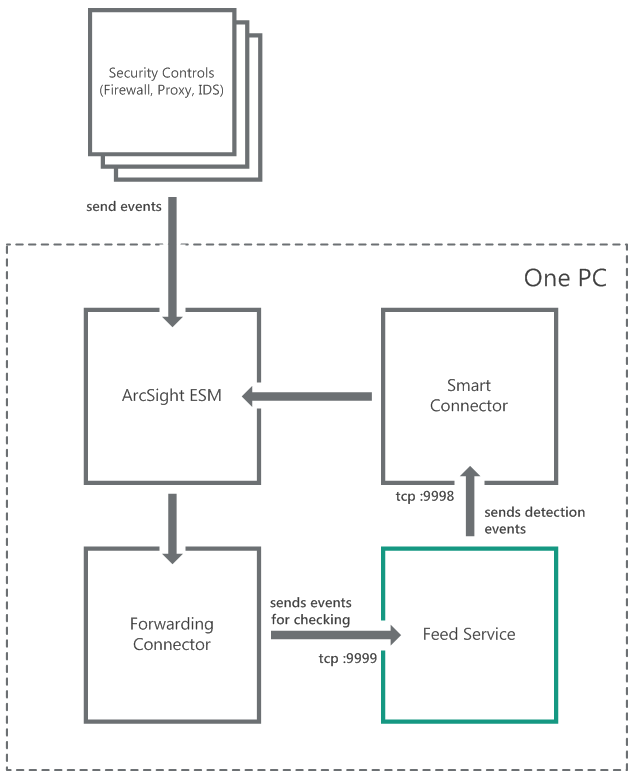
Single-computer installation
Two-computer installation (suggested integration)
The figure below depicts ArcSight ESM and Forwarding Connector installed on one computer, and Feed Service and SmartConnector installed on another.
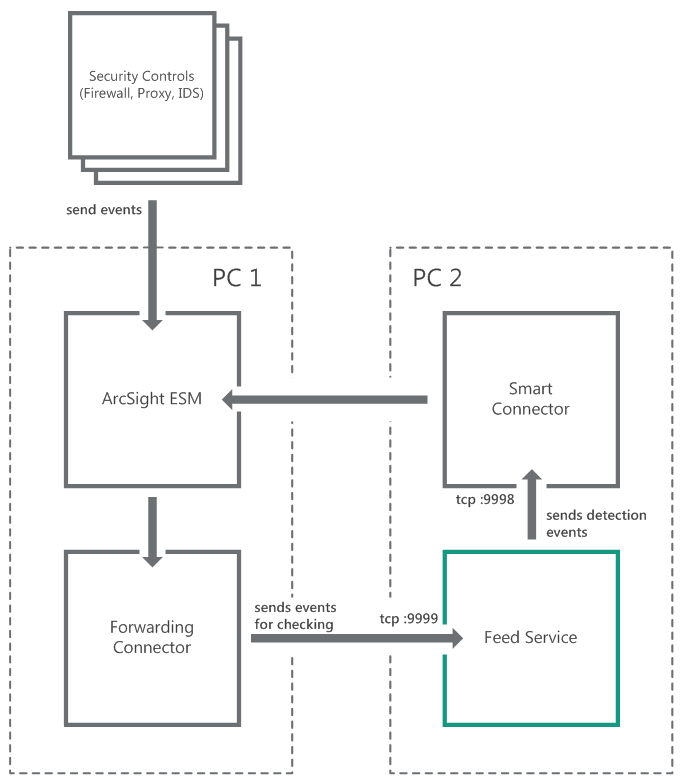
Two-computer installation (suggested integration)
Two-computer installation (second suggested integration)
The figure below depicts ArcSight ESM installed on one computer, and Forwarding Connector, Feed Service, and SmartConnector installed on another.
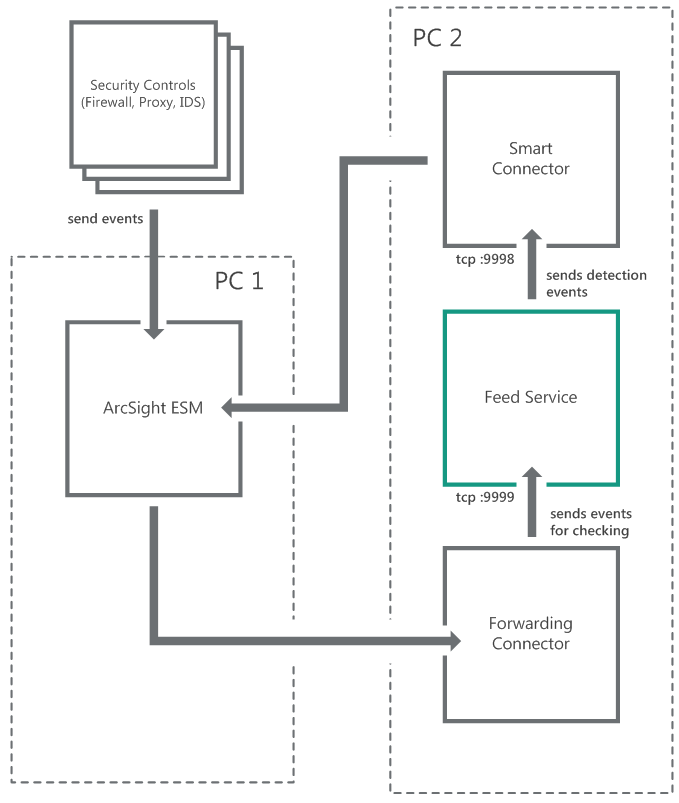
Two-computer installation (second suggested integration)
Two-computer installation (third suggested integration)
The figure below depicts Feed Service installed on one computer, and SmartConnector, ArcSight ESM, and Forwarding Connector installed on another.
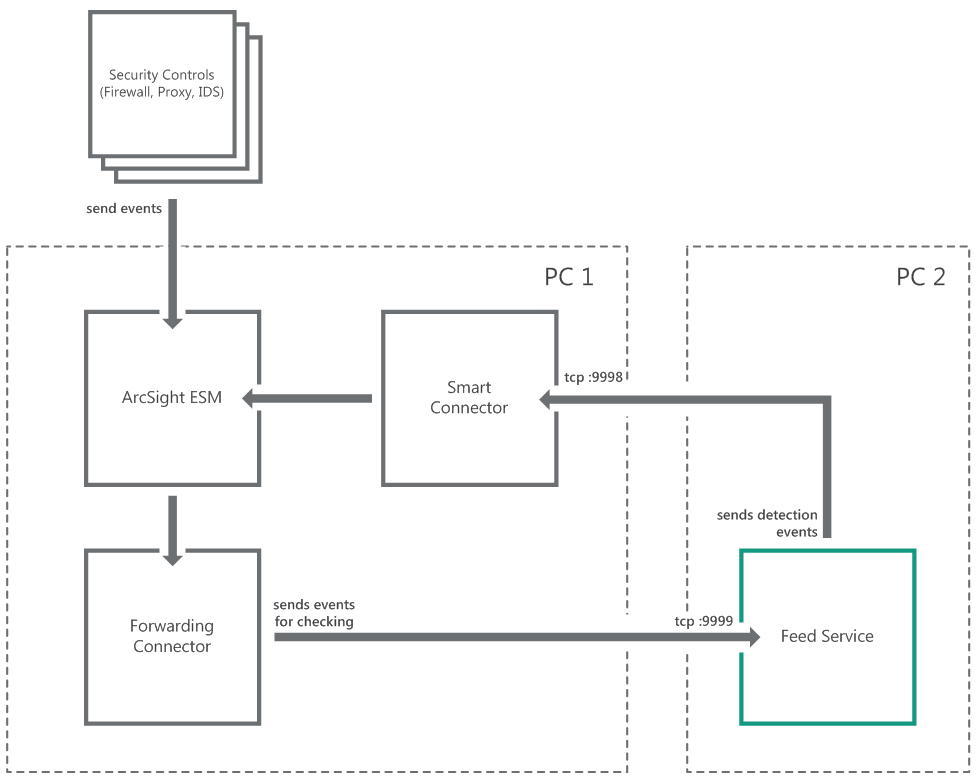
Two-computer installation (third suggested integration)
Three-computer installation
The figure below depicts ArcSight ESM installed on one computer, Forwarding Connector installed on another, and Feed Service and SmartConnector installed on still another.
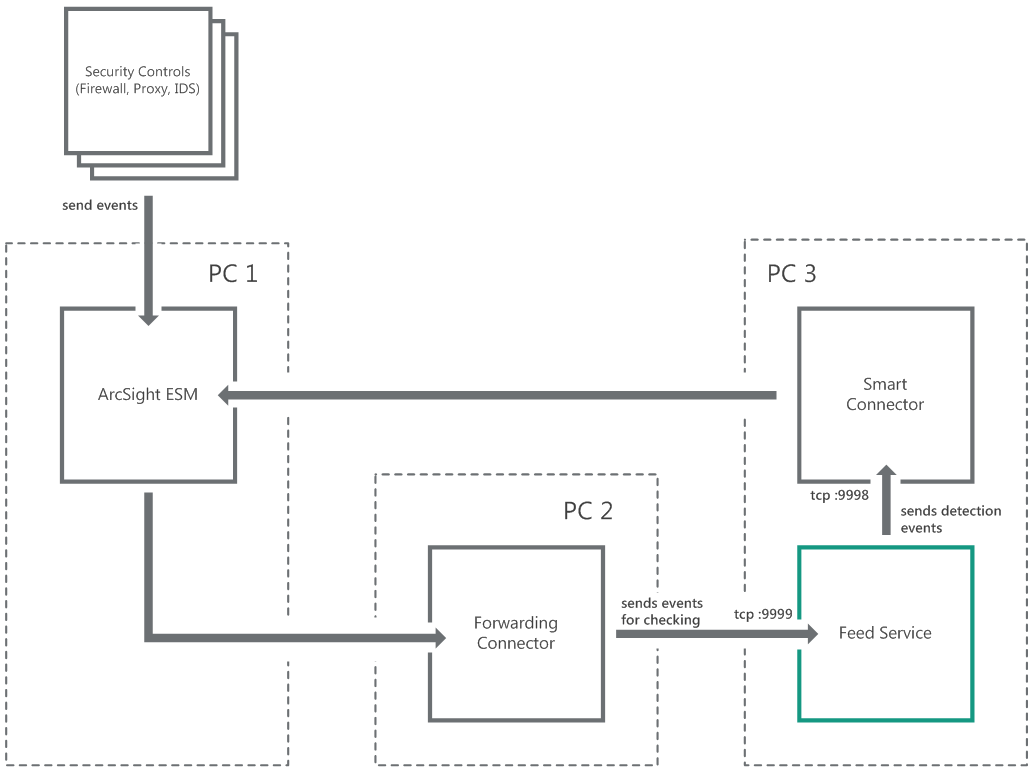
Three-computer installation
Page topStep 1. Importing the ARB package
This section describes how to import the ARB package to ArcSight.
The ARB package contains objects (active channels, dashboards, field sets, reports, rules, filters, users) that are necessary for integrating the service with ArcSight. When you import this file, these objects are created in ArcSight.
To import the ARB package:
- Run ArcSight Console.
- In the Navigator pane (tree view), select the Packages tab.
- Click the Import button.
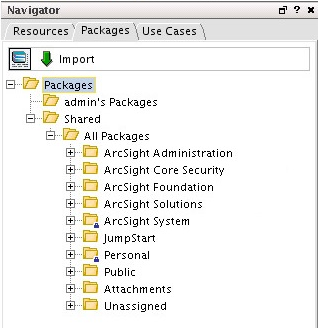
ArcSight packages
- In the Open window, select the Kaspersky_CyberTrace_Connector.arb file, located in the
integrationdirectory.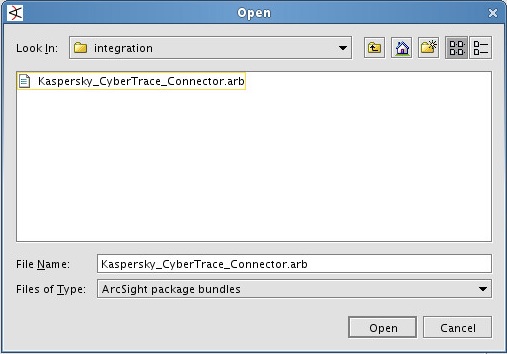
ARB file selection
The import process will be performed.
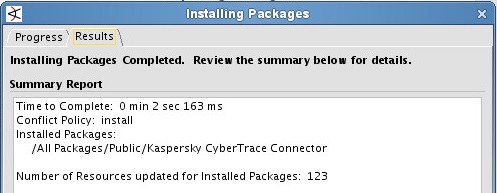
ARB import complete
After all objects from the ARB file are imported to ArcSight, all the imported rules are real-time rules, that is, they will be applied in real time.
To browse and manage the list of real-time rules:
- In the tree view, click the Resources tab.
- Open the Active Channels drop-down list and select Rules.
- In the tree, select Rules > Shared > All Rules > Real-time Rules.
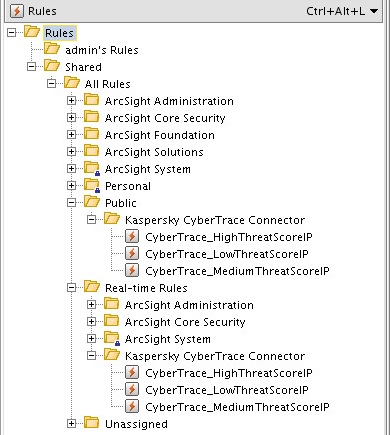
Real-time rules
- Expand Real-time Rules and remove unnecessary nested items from it.
After the ARB package is imported, new objects are created in ArcSight.
- When the Active Channels item in the tree view is selected, the following objects will be at the Active Channels > Shared > All Active Channels > Public > Kaspersky CyberTrace Connector location:
Object
Description
Default state
CyberTrace alerts
Displays service events from Kaspersky CyberTrace in real time.
Turned on
CyberTrace all matches
Displays detection events from Kaspersky CyberTrace in real time.
Turned on
CyberTrace hash matches
Displays hash detection events from Kaspersky CyberTrace in real time.
Turned off
CyberTrace URL matches
Displays URL detection events from Kaspersky CyberTrace in real time.
Turned off
CyberTrace IP matches
Displays IP detection events from Kaspersky CyberTrace in real time.
Turned off
- When the Dashboards item in the tree view is selected, the following objects will be at the Dashboards > Shared > All Dashboards > Public > Kaspersky CyberTrace Connector location:
Object
Description
Default state
CyberTrace detection map
Displays all devices that sent events containing malicious URLs, IP addresses, or hashes. Displays all feeds that were involved in the detection process.
Turned off
CyberTrace match statistics
Detection statistics: how many objects of a specific category were detected.
Turned on
CyberTrace Top 10 matched indicators
Top 10 detected indicators.
Turned off
The
CyberTrace detection mapandCyberTrace Top 10 matched indicatorsdashboards are turned off by default so as not to overload ArcSight. You can turn them on if you need these dashboards. - When the Field Sets item in the tree view is selected, the following objects will be at the Field Sets > Shared > All Field Sets > Public > Kaspersky CyberTrace Connector location:
Object
Description
Default state
CyberTrace alerts
Displayed fields of service events from Kaspersky CyberTrace.
Static
CyberTrace all matches
Displayed fields of detection events from Kaspersky CyberTrace.
Static
CyberTrace matched hashes
Displayed fields of hash detection events from Kaspersky CyberTrace.
Static
CyberTrace matched URLs
Displayed fields of URL detection events from Kaspersky CyberTrace.
Static
CyberTrace matched IPs
Displayed fields of IP address detection events from Kaspersky CyberTrace.
Static
- When the Reports item in the tree view is selected, the following objects will be at the Reports > Shared > All Reports > Public > Kaspersky CyberTrace Connector location:
Object
Description
Default state
CyberTrace all matches
Report that contains detection events from Kaspersky CyberTrace.
Static
- When the Rules item in the tree view is selected, the following object will be at the Rules > Shared > All Rules > Public > Kaspersky CyberTrace Connector location:
Object
Description
Default state
CyberTrace_HighThreatScoreIP
Rule for assigning high severity level and storing high priority IP detection events from Kaspersky CyberTrace.
Turned on
CyberTrace_MediumThreatScoreIP
Rule for assigning medium severity level and storing medium priority IP detection events from Kaspersky CyberTrace.
Turned on
CyberTrace_LowThreatScoreIP
Rule for assigning low severity level and storing low priority IP detection events from Kaspersky CyberTrace.
Turned on
- When the Filters item in the tree view is selected, the following objects will be at the Filters > Shared > All Filters > Public > Kaspersky CyberTrace Connector location:
Object
Description
Default state
CyberTrace all matches
Filter for selecting detection events sent by Kaspersky CyberTrace.
Static
CyberTrace forwarding events
Filter for forwarding to Kaspersky CyberTrace those events that contain URLs, IP addresses, or hashes.
Static
CyberTrace matched hashes
Filter for selecting hash detection events sent by Kaspersky CyberTrace.
Static
CyberTrace matched URLs
Filter for selecting URL detection events sent by Kaspersky CyberTrace.
Static
CyberTrace matched IPs
Filter for selecting IP detection events sent by Kaspersky CyberTrace.
Static
- When the Users item in the tree view is selected, the following objects will be at the Users > Shared > Custom User Groups > Kaspersky CyberTrace Connector location:
Object
Description
Default state
FwdCyberTrace
Account that is used for configuring ArcSight event forwarding.
Static
After the import is finished, make sure that the FwdCyberTrace user is created. To check, navigate to Users > Shared > Custom User Groups > Kaspersky CyberTrace Connector in ArcSight Console. If there is no FwdCyberTrace user, create it manually.
Step 2. Installing ArcSight Forwarding Connector
This section describes how to install ArcSight Forwarding Connector.
ArcSight Forwarding Connector is a component of HP ArcSight and is not included in Kaspersky CyberTrace. You can receive this application in one of the following ways:
- Contact the HP support team to get ArcSight Forwarding Connector.
- Contact a Kaspersky technical account manager (TAM) to get ArcSight Forwarding Connector.
To install ArcSight Forwarding Connector:
- Run the ArcSight Forwarding Connector installation application.
- Select the ArcSight Forwarding Connector installation directory (hereinafter referred to as
%ConnectorInstallDir%). - After the installation files are unpacked, select Add a Connector.
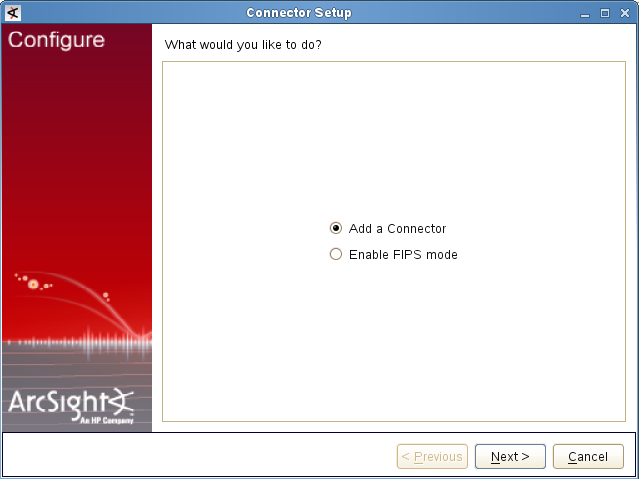
Adding a connector
Click Next.
- In the Type drop-down list, select ArcSight Forwarding Connector (Enhanced).
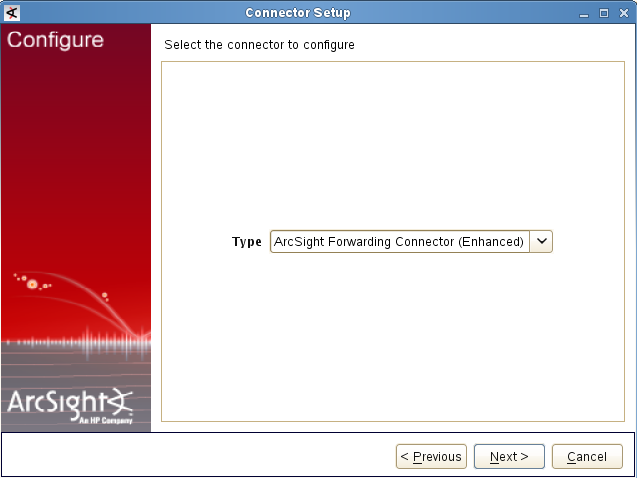
Selecting the connector type
Click Next.
- Specify the following connection parameters of ArcSight Source Manager:
- Host Name
ArcSight Source Manager host.
- Port
ArcSight Source Manager port (by default, it is
8443). - User Name
User name of the account intended for use by ArcSight Forwarding Connector (by default, it is
FwdCyberTrace).You can also specify a user other than
FwdCyberTrace. To do so, specify а custom ArcSight user in the ArcSight Forwarding Connector settings. - Password
Password for the account intended for use by ArcSight Forwarding Connector (by default, it is
KasperskyLab!).
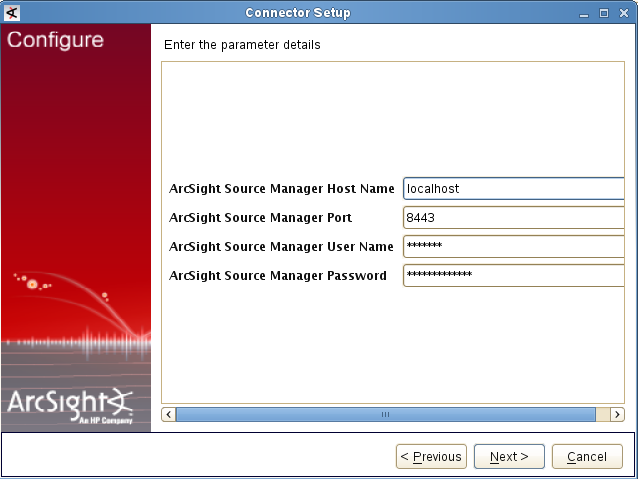
ArcSight Source Manager parameters
If an authentication error occurs (user name or password is incorrect), we recommend that you verify the
FwdCyberTraceuser is present in ArcSight Console. If not, create it manually.Click Next.
- Host Name
- If valid connection parameters are specified, import the required certificate.
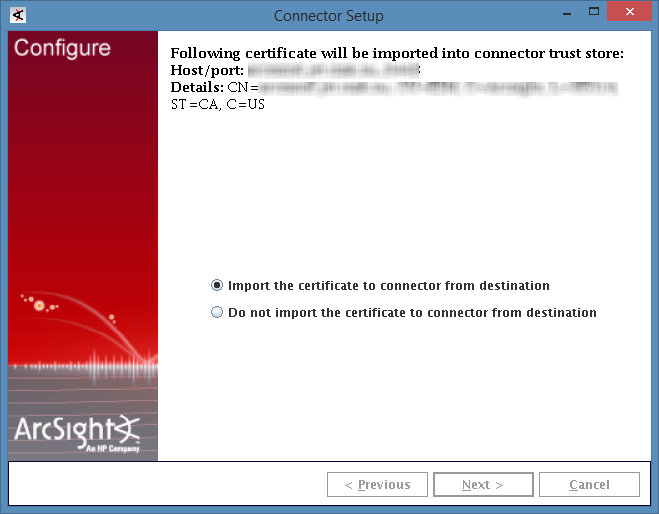
Importing the certificate
Click Next.
- Specify CEF Syslog as the event format that will be used for events sent to Feed Service.
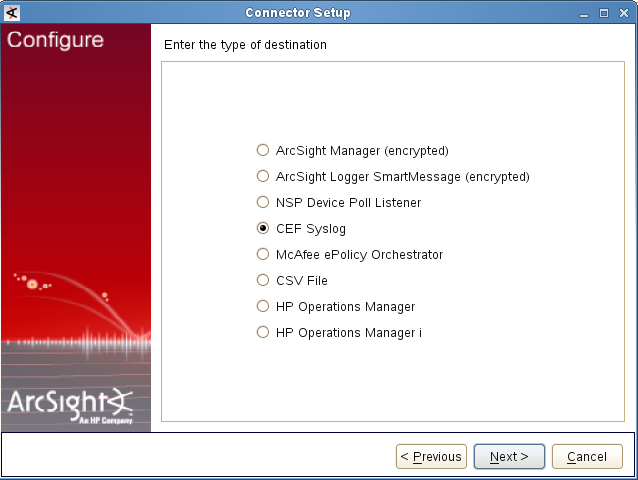
Specifying event format
Click Next.
- Specify the IP address (or host) and port that Feed Service will listen on for events. Specify Raw TCP as the protocol.
The IP address and port are the same as specified on the Settings > Service tab of Kaspersky CyberTrace Web. By default,
127.0.0.1:9999is used as the IP address and port for receiving events from ArcSight.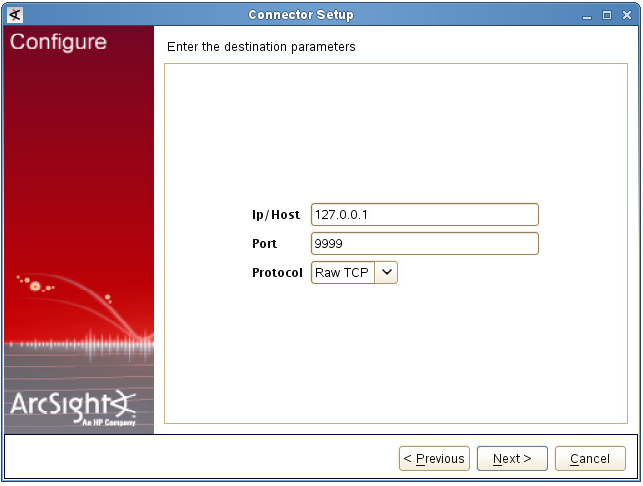
Specifying event destination
Click Next.
- Specify the details of the new ArcSight Forwarding Connector object: the name (arbitrary value permitted), location (arbitrary value permitted), location of the device that will send events to the connector (arbitrary value permitted, can be empty), and comment about the connector (arbitrary value permitted, can be empty).
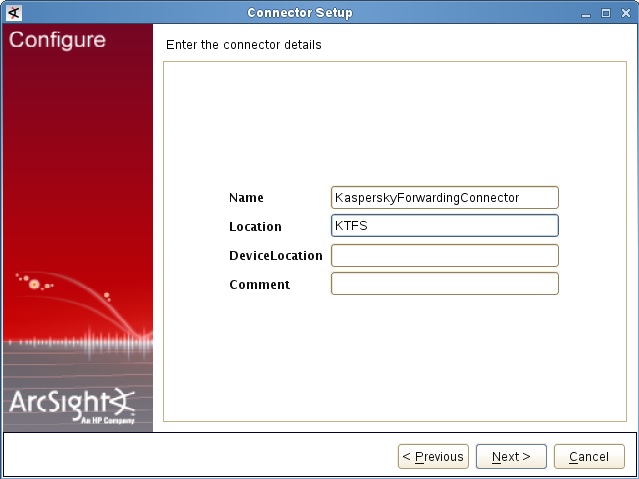
Connector details
Click Next.
- Install the ArcSight Forwarding Connector service.
- If you do not run the Connector Setup Wizard as root, a warning will be displayed.
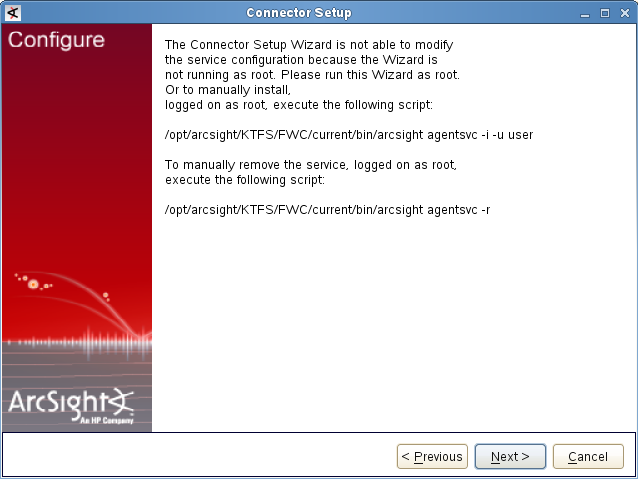
Warning about user privileges
You can either run the Connector Setup Wizard as root, or run the following command as root:
%ConnectorInstallDir%/current/bin/arcsight agentsvc -i -u $username -sn $service_nameHere
$usernameis the name of the operating system user that will run the service.$service_nameis the service name.We recommend that you set the service name to be the same as the connector name.
Log file
%ConnectorInstallDir%/current/logs/agent.logwill contain messages about the installation process.Skip the next step, which describes how to specify the service parameters.
- If you run the installation as root, select Install as a service.
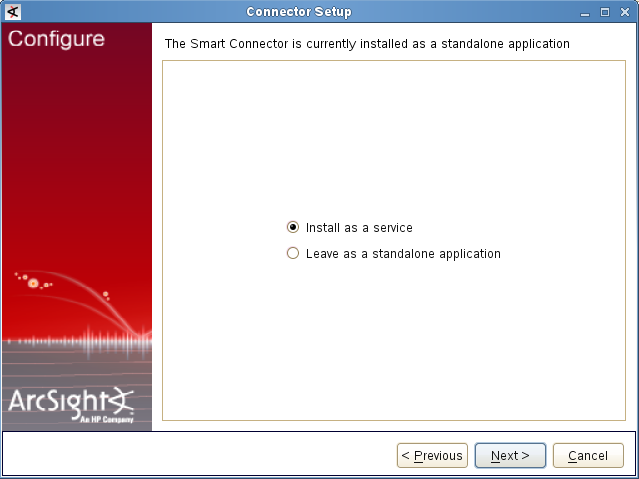
Choosing installation mode
Click Next.
- Specify the service parameters.
We recommend that you set the service name to be the same as the connector name.
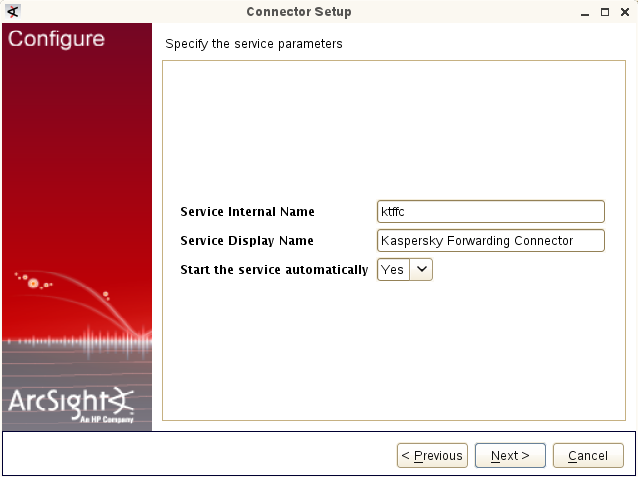
Specifying service parameters
Click Next.
After this, the Connector Setup Wizard informs you that the new forwarding connector is installed.
- Make sure that the connector is running (see the section about ArcSight troubleshooting on how you can do this). If it is not running, start it by using the following command:
/etc/init.d/arc_%FORWARDING% startHere
%FORWARDING%is the name of the connector.
If the forwarding connector sends a large amount of events (more than 1000 events per second) to Feed Service, we recommend that you do the following: in the %ConnectorInstallDir%/current/user/agentagent.wrapper.conf file, set the wrapper.java.maxmemory field to 512 and restart the forwarding connector.
Step 2 (alternative). Installing ArcSight Forwarding Connector by using the console
You can install ArcSight Forwarding Connector by using the console instead of the GUI installer.
To install ArcSight Forwarding Connector by using the console:
- In the console, run the ArcSight Forwarding Connector installer.
- Read the Introduction section and press Enter.
- When prompted, select Choose Install Folder, and type the full path to the directory where ArcSight Forwarding Connector will be installed (
%ConnectorInstallDir%).The default value of the installation directory is
/root/ArcSightSmartConnectors - When prompted, select Choose Install Set, and type
1(stands forTypical). - When prompted, select Choose Link Location, and specify whether a link to the installation directory must be created.
We recommend that you specify
Don't create links. - Make sure that the Pre-Installation Summary section lists the correct values of the installation settings. Press Enter if the values are correct.
After ArcSight Forwarding Connector is installed, the following information will be displayed in the console:
Installation Complete---------------------The core components of the ArcSight SmartConnector have been successfully installed to:%ConnectorInstallDir%To finish the configuration of the SmartAgent, please go to the folder:%ConnectorInstallDir%/current/bin/and execute the script:./runagentsetup.sh - Run
%ConnectorInstallDir%/current/bin/runagentsetup.sh. - At the prompt, select
Add a Connector. - Specify
ArcSight Forwarding Connectoras the connector type. - Specify whether to mask passwords.
We recommend that you specify
yes. - Specify the following connection parameters of ArcSight Source Manager:
- Host Name
ArcSight Source Manager host.
- Port
ArcSight Source Manager port (by default, it is
8443). - User
Username of the account intended for use by ArcSight Forwarding Connector (by default, it is
FwdCyberTrace).You can also specify a user other than
FwdCyberTrace. To do so, specify а custom ArcSight user in the ArcSight Forwarding Connector settings. - Password
Password for the account intended for use by ArcSight Forwarding Connector (by default, it is
KasperskyLab!).
- Host Name
- Specify the following action for importing the certificate:
Import the certificate to connector from destination. - Specify the destination type:
CEF Syslog. - Specify the following settings:
- Ip/Host
IP address that Feed Service listens on for events.
- Port
Port through which Feed Service receives events. By default, it is
9999. - Protocol
Specify
Raw TCP.
The IP address and port are the same as specified in the Connection settings section of the Service tab of Kaspersky CyberTrace Web.
- Ip/Host
- Specify the following connector settings:
- Name
Arbitrary value can be specified.
- Location
Arbitrary value can be specified.
- DeviceLocation
Arbitrary value can be specified.
- Comment
Arbitrary value can be specified.
After this, the connector will be registered.
- Name
- Specify the way in which the connector must be installed:
Install as a service. - Specify the service settings:
- Service Internal Name
- Service Display Name
- Start the service automatically
Indicates whether the service will start on the system startup. We recommend that you specify
yes.
- Check the specified data. If it is correct, press Enter.
The connector will be installed as a service.
- Make sure that the connector is running (see the section about ArcSight troubleshooting on how you can do this). If it is not running, start it by using the following command:
/etc/init.d/arc_%FORWARDING% startHere
%FORWARDING%is the name of the connector.
If the forwarding connector sends a large amount of events (more than 1000 events per second) to Feed Service, we recommend that you do the following: in the %ConnectorInstallDir%/current/user/agentagent.wrapper.conf file, set the wrapper.java.maxmemory field to 512 and restart the forwarding connector.
Step 3. Configuring CyberTrace for interaction with ArcSight
This section describes how to configure CyberTrace for interaction with ArcSight during normal work.
To configure CyberTrace for interaction with ArcSight:
- Open Kaspersky CyberTrace Web.
- Select the Settings > Service tab.
- In the Connection settings section, for Service listens on, select the IP address and port that Feed Service listens on for incoming events. The IP address and port are set when ArcSight Forwarding Connector is installed (its default value is
127.0.0.1:9999). - Select the Matching tab, and then select the Edit default rules link.
The Default properties form opens.
- On the Normalizing rules tab, do the following:
- In the Regexp to replace field, enter the symbol sequence
\= - In the Replace with field,enter the symbol
=
After you make the changes, the Normalizing rules tab must look like this:
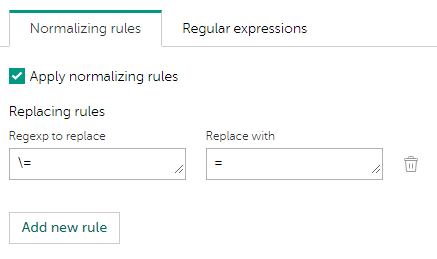
Normalizing rules tab
- In the Regexp to replace field, enter the symbol sequence
- Select the Regular expressions tab. This tab contains universal regular expressions that match URLs (with protocol), hashes, IP addresses (src and dst), device name, vendor name, device IP address, user name, and event ID. Change these regular expressions to match the events.
- Close the Default properties form.
- On the Events format tab, in the Alert events format field, enter the following string:
CEF:0|Kaspersky|Kaspersky CyberTrace for ArcSight|2.0|1|CyberTrace Service Event|4| reason=%Alert% msg=%RecordContext% - In the Detection events format field, specify the following string:
CEF:0|Kaspersky|Kaspersky CyberTrace for ArcSight|2.0|2|CyberTrace Detection Event|8| reason=%Category% dst=%DST_IP% src=%DeviceIp% fileHash=%RE_HASH% request=%RE_URL% sourceServiceName=%Device% sproc=%Product% suser=%UserName% msg=CyberTrace detected %Category% externalId=%Id% %ActionableFields% cs5Label=MatchedIndicator cs5=%MatchedIndicator% cn3Label=Confidence cn3=%Confidence% cs6Label=Context cs6=%RecordContext%
ArcSight and actionable fields
The following actionable fields are used in Kaspersky Data Feeds. You can review the actionable fields on the Settings > Feeds tab. For more information, see section "Adding actionable fields to a feed".
- For Demo Botnet CnC URL Data Feed and Botnet CnC URL Data Feed:
Field name
Output
CEF field
mask
cs1
deviceCustomString1
first_seen
flexString1
flexString1
last_seen
flexString2
flexString2
popularity
cn2
deviceCustomNumber2
threat
cs3
deviceCustomString3
urls/url
cs4
deviceCustomString4
whois/domain
cs2
deviceCustomString2
- For Demo Malicious Hash Data Feed and Malicious Hash Data Feed:
Field name
Output
CEF field
first_seen
flexString1
flexString1
last_seen
flexString2
flexString2
popularity
cn2
deviceCustomNumber2
threat
cs3
deviceCustomString3
urls/url
cs4
deviceCustomString4
file_size
fsize
file_size
- For Demo IP Reputation Feed and IP Reputation Data Feed:
Field name
Output
CEF field
first_seen
flexString1
flexString1
last_seen
flexString2
flexString2
popularity
cn2
deviceCustomNumber2
threat_score
cn1
deviceCustomNumber1
domains
cs2
deviceCustomString2
urls/url
cs4
deviceCustomString4
files/threat
cs3
deviceCustomString3
- For Malicious URL Data Feed:
Field name
Output
CEF field
mask
cs1
deviceCustomString1
first_seen
flexString1
flexString1
last_seen
flexString2
flexString2
popularity
cn2
deviceCustomNumber2
files/threat
cs3
deviceCustomString3
category
cs4
deviceCustomString4
whois/domain
cs2
deviceCustomString2
- For Mobile Malicious Hash Data Feed:
Field name
Output
CEF field
first_seen
flexString1
flexString1
last_seen
flexString2
flexString2
popularity
cn2
deviceCustomNumber2
threat
cs3
deviceCustomString3
file_size
fsize
file_size
- For Phishing URL Data Feed:
Field name
Output
CEF field
mask
cs1
deviceCustomString1
first_seen
flexString1
flexString1
last_seen
flexString2
flexString2
popularity
cn2
deviceCustomNumber2
industry
deviceFacility
deviceFacility
whois/domain
cs2
deviceCustomString2
- For Mobile Botnet Data Feed:
Field name
Output
CEF field
threat
cs3
deviceCustomString3
- For Vulnerability Data Feed:
Field name
Output
CEF field
severity
cs3
deviceCustomString3
detection_date
flexString1
flexString1
- For APT URL Data Feed:
Field name
Output
CEF field
detection_date
flexString1
flexString1
publication_name
cs3
deviceCustomString3
- For APT IP Data Feed:
Field name
Output
CEF field
detection_date
flexString1
flexString1
publication_name
cs3
deviceCustomString3
- For APT Hash Data Feed:
Field name
Output
CEF field
detection_date
flexString1
flexString1
publication_name
cs3
deviceCustomString3
- For IoT URL Data Feed:
Field name
Output
CEF field
mask
cs1
deviceCustomString1
first_seen
flexString1
flexString1
last_seen
flexString2
flexString2
popularity
cn2
deviceCustomNumber2
files/threat
cs3
deviceCustomString3
Clearing ArcSight fields occupied by information from Kaspersky Data Feeds
If you want to use a CEF field for data other than information from Kaspersky Data Feeds, you must clear this field.
To clear a CEF field:
- Select the Settings tab of Kaspersky CyberTrace Web.
- Select the Feeds tab.
- In the Filtering rules for feeds section, make sure the Kaspersky feeds tab is selected and then click the Kaspersky Threat Data Feed that contains the field that you want to clear.
- In the Actionable fields section, find the Output field containing the name of the CEF field that you want to clear.
- Click the Delete icon (
 ) next to the Output field that you found in the previous step.
Step 4. Performing the verification test (ArcSight)
After you install Kaspersky CyberTrace and the necessary ArcSight software, you can test their performance.
Please make sure you perform the verification test before editing any filtering rules in the Feed Utility configuration file.
To check whether Kaspersky CyberTrace is correctly integrated with ArcSight:
- Configure Log Scanner to send events to ArcSight SmartConnector.
For this purpose, set the host and port of ArcSight SmartConnector in the
Connectionelement of the Log Scanner configuration file. - Send the
%service_dir%/verification/kl_verification_test_cef.txtfile to ArcSight SmartConnector.For this purpose, run the following command (in Linux):
./log_scanner -p ../verification/kl_verification_test_cef.txtFor this purpose, run the following command (in Windows):
log_scanner.exe -p ..\verification\kl_verification_test_cef.txtDo not specify the
-rflag in this command: send the test results to the SIEM solution by using the parameters for outbound events specified in the Service settings of Kaspersky CyberTrace. - Make sure that you have the test results below.
You can view the test results in the CyberTrace all matches active channel. For this purpose, set the following inline filter for the Source Service Name field:
Kaspersky Lab|CyberTrace Verification Kit.
Verification test results
The verification test results depends on the feeds you use. The verification test results are listed in the following table.
Verification test results
Feed used |
Detected objects |
Malicious URL Data Feed |
http://fakess123.nu http://badb86360457963b90faac9ae17578ed.com |
Phishing URL Data Feed |
http://fakess123ap.nu http://e77716a952f640b42e4371759a661663.com |
Botnet CnC URL Data Feed |
http://fakess123bn.nu http://a7396d61caffe18a4cffbb3b428c9b60.com |
IP Reputation Data Feed |
192.0.2.0 192.0.2.3 |
Malicious Hash Data Feed |
FEAF2058298C1E174C2B79AFFC7CF4DF 44D88612FEA8A8F36DE82E1278ABB02F (EICAR Standard Anti-Virus Test File) C912705B4BBB14EC7E78FA8B370532C9 |
Mobile Malicious Hash Data Feed |
60300A92E1D0A55C7FDD360EE40A9DC1 |
Mobile Botnet CnC URL Data Feed |
001F6251169E6916C455495050A3FB8D (MD5 hash) sdfed7233dsfg93acvbhl.su/steallallsms.php (URL mask) |
Ransomware URL Data Feed |
http://fakess123r.nu http://fa7830b4811fbef1b187913665e6733c.com |
Vulnerability Data Feed |
D8C1F5B4AD32296649FF46027177C594 |
APT URL Data Feed |
http://b046f5b25458638f6705d53539c79f62.com |
APT Hash Data Feed |
7A2E65A0F70EE0615EC0CA34240CF082 |
APT IP Data Feed |
192.0.2.4 |
IoT URL Data Feed |
http://e593461621ee0f9134c632d00bf108fd.com/.i |
Demo Botnet CnC URL Data Feed |
http://5a015004f9fc05290d87e86d69c4b237.com http://fakess123bn.nu |
Demo IP Reputation Data Feed |
192.0.2.1 192.0.2.3 |
Demo Malicious Hash Data Feed |
776735A8CA96DB15B422879DA599F474 FEAF2058298C1E174C2B79AFFC7CF4DF 44D88612FEA8A8F36DE82E1278ABB02F |
ICS Hash Data Feed |
7A8F30B40C6564EFF95E678F7C43346C |
Integration with QRadar
This chapter describes how to integrate Kaspersky CyberTrace with QRadar.
Integration steps (QRadar)
This chapter describes how to integrate Kaspersky CyberTrace with QRadar.
About the integration schemes
Kaspersky CyberTrace can be integrated with QRadar in two integration schemes:
- Standard integration
Use this scenario if it is possible to get QRadar updates. For more information about the standard integration scheme, see About the standard integration scheme (QRadar).
- Integration when QRadar cannot get updates
This is an additional scenario for a case when it is not possible to get QRadar updates. The procedure is outlined in Integration with QRadar when QRadar cannot get updates.
How to integrate Kaspersky CyberTrace with QRadar
Make sure that you have installed Kaspersky CyberTrace (see Part 1: Installing Kaspersky CyberTrace).
To integrate Kaspersky CyberTrace with QRadar in the standard integration scenario:
- Step 1. Configure QRadar to receive latest updates.
- Step 2. Send a set of events to QRadar so that QRadar will automatically add new log sources.
- Step 3. Forward events from QRadar to Feed Service.
- Step 4. Perform the verification test.
Please make sure you perform the verification test before editing any matching process settings.
- Step 5. Configure QRadar to retrieve custom event properties.
- Step 6. Configure QRadar to create a search filter for CyberTrace events.
- Step 7 (optional). Configure QRadar to display events in a dashboard.
After you have successfully integrated Kaspersky CyberTrace with QRadar, install Kaspersky Threat Feed App:
- Step 8 (optional). Configure QRadar to notify about incoming service events.
- Step 9 (optional). Install Kaspersky Threat Feed App.
- Step 10 (optional). Enable the indexes of the added custom event properties.
- Step 11 (optional). Configure Kaspersky Threat Feed App.
Standard integration (QRadar)
This section contains instructions for integrating Kaspersky CyberTrace with QRadar in the standard integration scheme.
About the standard integration scheme (QRadar)
This section describes the standard integration scheme for QRadar and Kaspersky CyberTrace.
For the standard integration scheme to work properly, you must install the update DSM-KasperskyCyberTrace-%version%-20180802144954.noarch.rpm, where %version% is the version of QRadar. Usually, you receive these updates as part of the auto-update process, but you can also visit IBM Fix Central and download them manually.
About the components of the standard integration scheme
The following components are used in the standard integration scheme for QRadar:
- Feed Service
This service matches QRadar events against Kaspersky Threat Data Feeds.
- QRadar
The SIEM solution used in this integration.
- Security controls
These are sources of events for QRadar such as firewalls, proxies, intrusion detection systems, and other networking devices.
Security controls can send events to QRadar by any method supported by QRadar.
Standard integration scheme
In the standard integration scheme, Feed Service by default is configured to listen for incoming events from QRadar on 0.0.0.0:9999 (аll interfaces).
Feed Service sends detection events to port 514 of the interface defined in QRadar configuration. The address of this interface is specified when you install Kaspersky CyberTrace.
Security controls can send events to QRadar in any format that is supported by QRadar, for example, Syslog, JDBC, OPSEC, File, or SNMP.
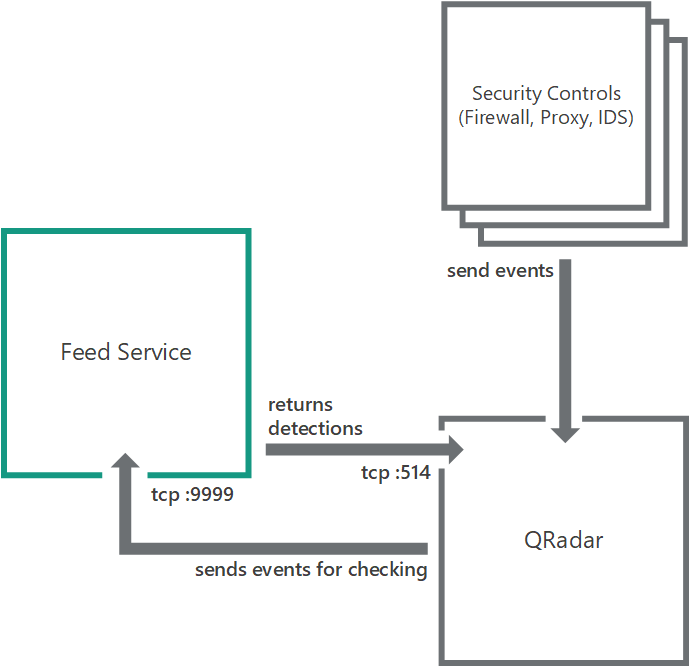
Standard integration scheme for QRadar
Page topStep 1. Configuring QRadar to receive latest updates
This section describes how you can receive the latest updates of QRadar.
To configure QRadar for getting latest updates:
- In QRadar Console, select Admin > Auto-Update.
The Update Configuration form opens.
- On the Basic tab, in the Configuration Updates section, select Auto Integrate in the Update Type drop-down list.
- In the DSM, Scanner, Protocol Updates section, select the Auto Install update type.
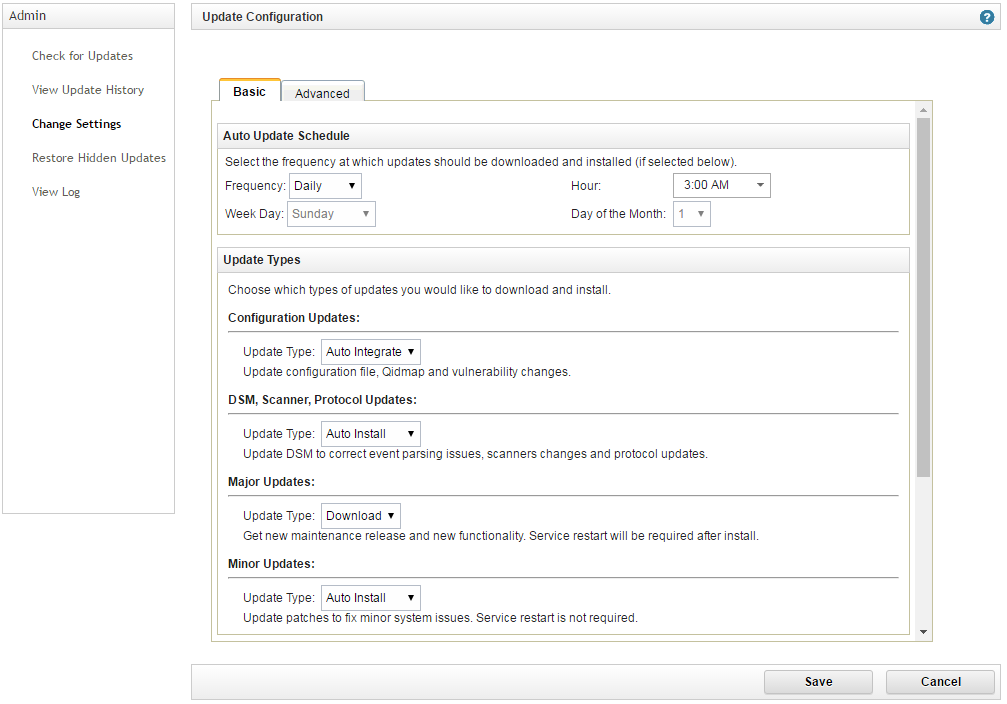
Update configuration
- Click Save.
- Wait for installation of the updates.
- In QRadar Console, select Admin > Log Sources > Add.
The Add a log source form opens.
- Make sure that Kaspersky CyberTrace appears in the Log Source Type drop-down list.
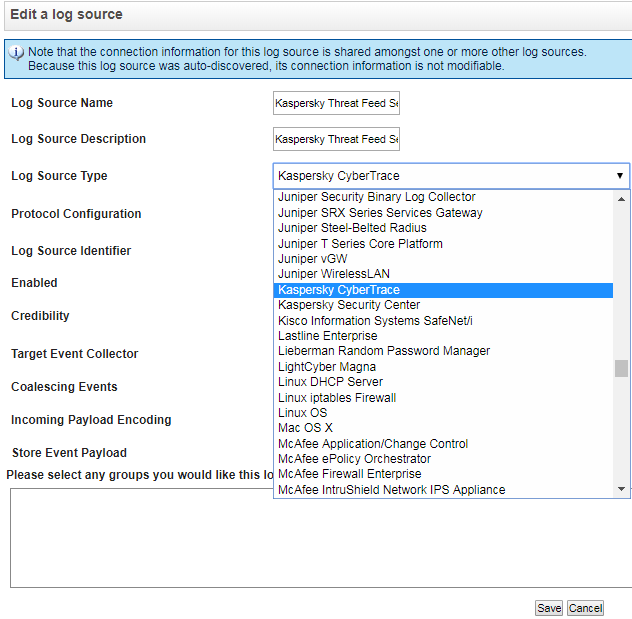
Kaspersky CyberTrace log source type
As an alternative to auto-updating QRadar, you can visit IBM Fix Central to manually download and install the DSM package that is specified in section "About the standard integration scheme (QRadar)", and then configure QRadar, as described in section "Integration with QRadar when QRadar cannot get updates".
Page topStep 2. Sending a set of events to QRadar
On this step, you must send two sets of events to QRadar so that QRadar will automatically add two new log sources—one for verification and the other for events from Feed Service.
To add new log sources:
- Send the verification test log file.
Send the
verification/kl_verification_test_leef.txtfile to QRadar, as described in the procedure in subsection "Sending a set of events" below.After you send the verification test file, QRadar will contain the
KL_Verification_Toollog source. - Send the sample log file.
For testing and final adjustments of integration with QRadar, send the
integration/qradar/sample_initiallog.txtsample log file to QRadar, as described in the procedure in subsection "Sending a set of events" below.After you send the sample log file, QRadar will contain the
KL_Feed_Service_v2log source.Up to 25 events can be missed after a new log source is added, according to the QRadar documentation. So you may have to send sample_initiallog.txt several times. This ensures that some events will be displayed by QRadar and handled by Feed Service.
Sending a set of events
To send events to QRadar:
- In the
Connectionelement of the Log Scanner configuration file, specify the IPv4 address and port of your QRadar server (usually it is514). - Invoke the following command from the Log Scanner directory.
In Linux:
./log_scanner -p <log_file> [-p <log_file2> ...]In Windows:
log_scanner.exe -p <log_file> [-p <log_file2> ...]<log_file>,<log_file2>are log files to send. Alternatively, you can specify a directory containing log files to send. - In QRadar Console (which is the web interface for QRadar), select Admin > Log Sources.
A new log source of the
Kaspersky CyberTracetype appears in the log sources list. - In the settings form of the new log source, clear the Coalescing Events check box and click Save.
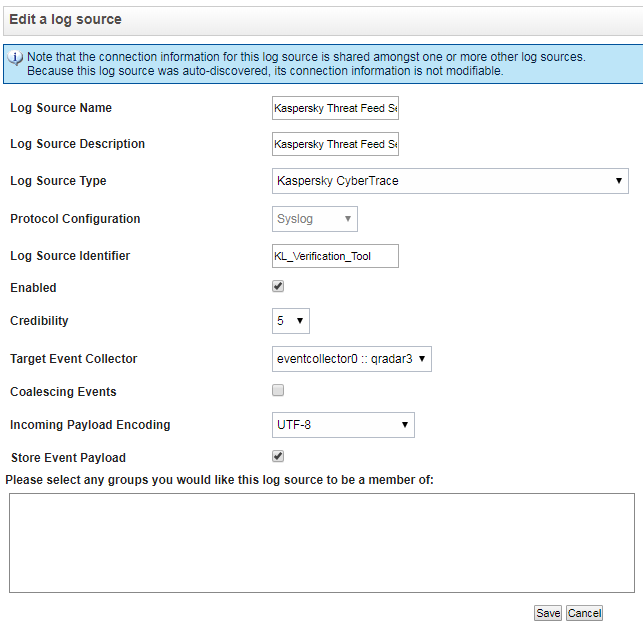
Editing a log source
- If necessary, deploy the changes by selecting the Admin > Deploy Changes menu item in QRadar Console.
Step 3. Forwarding events from QRadar to Feed Service
To check events that arrive in QRadar by way of Feed Service, you must configure QRadar to forward the events to Feed Service.
To forward events from QRadar to Feed Service:
- Select Admin > System Configuration > Forwarding Destinations > Add.
- In the Forwarding Destination Properties window, type the identifier of the destination (for example,
"KL_Threat_Feed_Service_v2"). - Type the destination address (the host where Feed Service runs).
- Select
Payloadas the events format andTCPas the protocol.The
Payloadformat can contain less information, in comparison with theJSONformat. For example, if event source names are used, QRadar may remove them from the event. You can specify theJSONformat instead, but make sure to configure it properly. For the instructions on how to configure events in theJSONformat to forward to Kaspersky CyberTrace, see subection "Recommendations on configuring events in JSON format" below. - Set the port according to the parameters for inbound events of Kaspersky CyberTrace. You can see this information on the Settings >Service tab of Kaspersky CyberTrace Web.
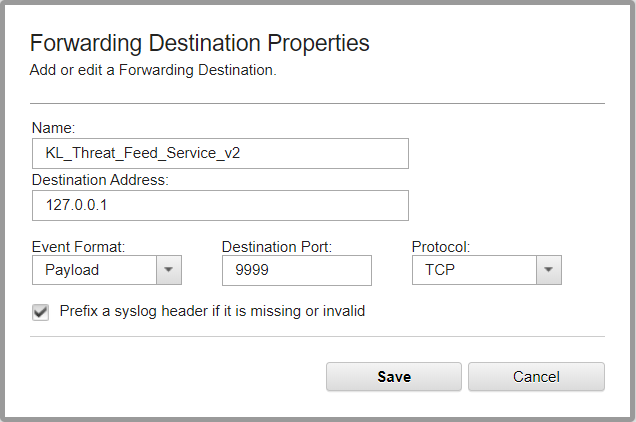
Adding a forwarding destination
- Click Save.
- Select Admin > Routing rules > Add.
- In the Routing Rule window, type the rule name (for example,
KL_Threat_Feed_Service_v2_Rule). - Select
Onlineas the mode. - Leave the default value in the Forwarding Event Collector drop-down list.
- Select
Eventsas the data source. - In the Event Filters group, set the event filter.
Choose the log sources together with
KL_Verification_Tool, and use theEquals any ofoperator in the filter. Also, to achieve maximum performance of the service, you are advised to select only those events that contain indicators to look up in the feeds (such as URLs, hashes (MD5, SHA1, SHA256), and IP addresses).Clear the Match all incoming events check box or leave it cleared so that the detection events received from Feed Service will not be sent back to Feed Service.
- Select the Forward check box. In the table, next to the Name column, select the check box next to the item added in step 1 (in this case, it is
KL_Threat_Feed_Service_v2).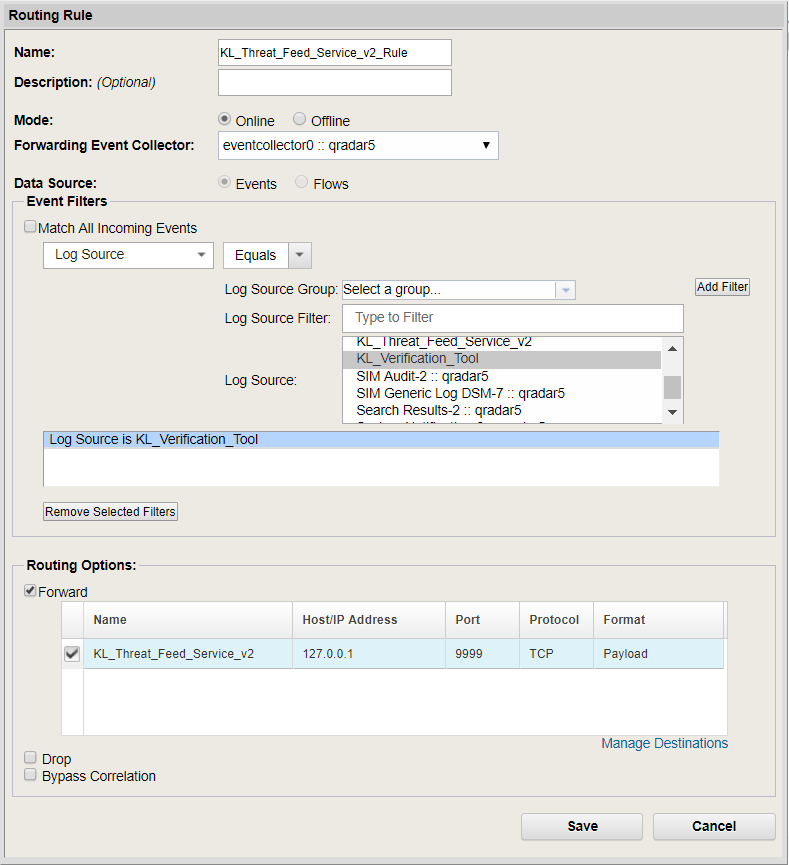
Adding a routing rule
- Click Save.
Recommendations for configuring events in the JSON format
A number of QRadar versions (such as, 7.3.2 Patch 6 and 7.4.0) can drop some forwarded events in the JSON format, which may lead to incorrect results. To prevent this, we recommend that you exclude some fields from the event in JSON (for an exact list of such fields, contact IBM's QRadar Support team or try to determine this list manually). You must specify additional normalizing rules in Kaspersky CyberTrace Web (see below).
Therefore, use the JSON format instead of the Payload format if the event in the Payload format does not contain the necessary fields. In this case, make sure that the following conditions are met:
- In the Forwarding Destination Properties window, only fields that you need are selected. QRadar does not drop forwarded events. To enable or disable fields that will be forwarded within an event, open the Forwarding Profile Properties window by clicking the button near the Profile field.
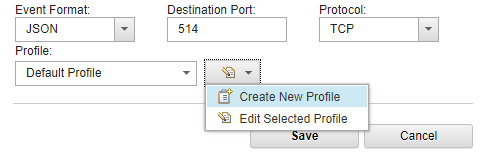
Configuring events in JSON format
- On the Settings > Matching tab of Kaspersky CyberTrace Web, the following normalizing rules are specified:
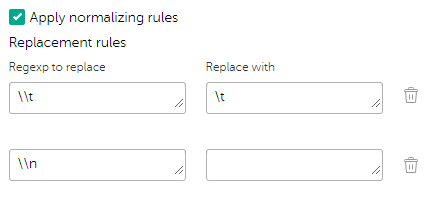
Configuring additional normalizing rules
Step 4. Performing the verification test (QRadar)
This section explains how to check the capabilities of Kaspersky CyberTrace by performing the verification test.
Please make sure you perform the verification test before editing any matching process settings.
What is the verification test
The verification test is a procedure that is used to check the capabilities of Kaspersky CyberTrace and to confirm the accuracy of the integration.
During this test you will check whether events from QRadar are received by Feed Service, whether events from Feed Service are received by QRadar, and whether events are correctly parsed by Feed Service using the regular expressions.
About the verification test file
The verification test file is a file that contains a collection of events with URLs, IP addresses, and hashes. This file is located in the ./verification directory in the distribution kit. The name of this file is kl_verification_test_leef.txt.
Verification procedure
To verify the installation:
- Make sure that the
"KL_Verification_Tool"log source is added to QRadar and routing rules are set in such a way that events from"KL_Verification_Tool"are sent to Feed Service. - Open QRadar Console and select the Log Activity tab.
- Add a filter:
- Click the Add Filter button.
- In the Parameter drop-down list, select
Log Source. - In the Operator drop-down list, select
Equals. - In the Value group, in the Log Source drop-down list select the required service name.
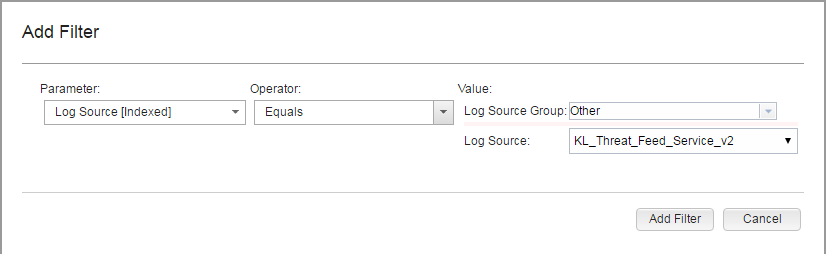
Adding a filter for browsing events
- Click the Add Filter button.
The
Log Source is KL_Threat_Feed_Service_v2string will be displayed under Current Filters. - In the View drop-down list, select
Real Timeto clear the event area.You now can browse information about the service events.
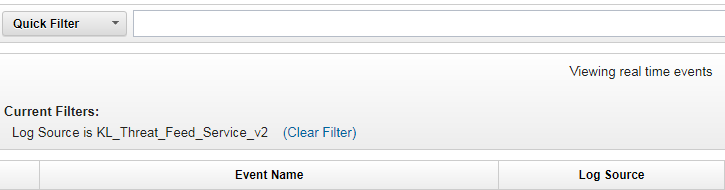
Browsing filtered information
- Send the
kl_verification_test_leef.txtfile to QRadar by using Log Scanner, by running the following command:For Linux:
./log_scanner -p ../verification/kl_verification_test_leef.txtFor Windows:
log_scanner.exe -p ..\verification\kl_verification_test_leef.txtIf you specify the
-rflag in this command, the test results are written to the Log Scanner report file. If you do not specify the-rflag, the test results are sent to the SIEM solution by using the settings for outbound events specified for Feed Service.The expected results to be displayed by QRadar depend on the feeds you use. The verification test results are listed in the following table.
Verification test results
Feed used
Detected objects
Malicious URL Data Feed
http://fakess123.nu
http://badb86360457963b90faac9ae17578ed.com
Phishing URL Data Feed
http://fakess123ap.nu
http://e77716a952f640b42e4371759a661663.com
Botnet CnC URL Data Feed
http://fakess123bn.nu
http://a7396d61caffe18a4cffbb3b428c9b60.com
IP Reputation Data Feed
192.0.2.0
192.0.2.3
Malicious Hash Data Feed
FEAF2058298C1E174C2B79AFFC7CF4DF
44D88612FEA8A8F36DE82E1278ABB02F (stands for EICAR Standard Anti-Virus Test File)
C912705B4BBB14EC7E78FA8B370532C9
Mobile Malicious Hash Data Feed
60300A92E1D0A55C7FDD360EE40A9DC1
Mobile Botnet CnC URL Data Feed
001F6251169E6916C455495050A3FB8D (MD5 hash)
http://sdfed7233dsfg93acvbhl.su/steallallsms.php (URL mask)
Ransomware URL Data Feed
http://fakess123r.nu
http://fa7830b4811fbef1b187913665e6733c.com
Vulnerability Data Feed
D8C1F5B4AD32296649FF46027177C594
APT URL Data Feed
http://b046f5b25458638f6705d53539c79f62.com
APT Hash Data Feed
7A2E65A0F70EE0615EC0CA34240CF082
APT IP Data Feed
192.0.2.4
IoT URL Data Feed
http://e593461621ee0f9134c632d00bf108fd.com/.i
Demo Botnet CnC URL Data Feed
http://5a015004f9fc05290d87e86d69c4b237.com
http://fakess123bn.nu
Demo IP Reputation Data Feed
192.0.2.1
192.0.2.3
Demo Malicious Hash Data Feed
776735A8CA96DB15B422879DA599F474
FEAF2058298C1E174C2B79AFFC7CF4DF
44D88612FEA8A8F36DE82E1278ABB02F
ICS Hash Data Feed
7A8F30B40C6564EFF95E678F7C43346C
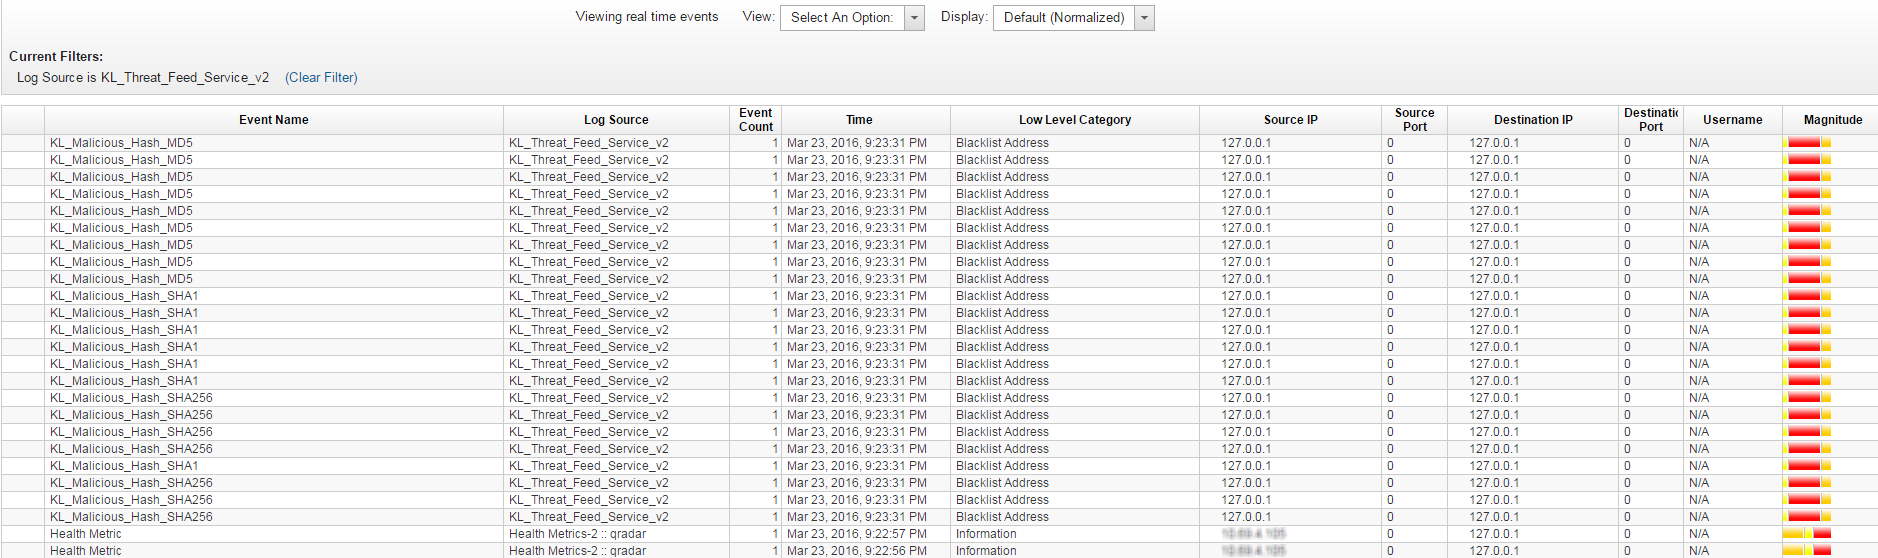
Browsing events from Feed Service
If the actual results of the test are the same as those expected, the integration of Feed Service with QRadar is correct.
Page topStep 5. Retrieving custom event properties
This section describes how to configure retrieval of custom event properties from Kaspersky CyberTrace outgoing events, in addition to standard fields. As a result of this setting, the MD5, SHA1, and SHA256 hashes will be extracted and the extraction rule of the Source IP field will be redefined.
To configure retrieval of custom event properties:
- Select the Log Activity tab, and then click Add Filter.
The Add Filter form opens.
- Fill in the form:
- In the Parameter drop-down list, select
Log Source [Indexed]. - In the Operator drop-down list, select
Equals. - In the Log Source list, select
KL_Threat_Feed_Service_v2.The selection
KL_Threat_Feed_Service_v2is the log source name that is set in theOutputSettings > EventFormatelement and theOutputSettings > AlertFormatelement of the Feed Service configuration file (you can also set them by using Kaspersky CyberTrace Web).
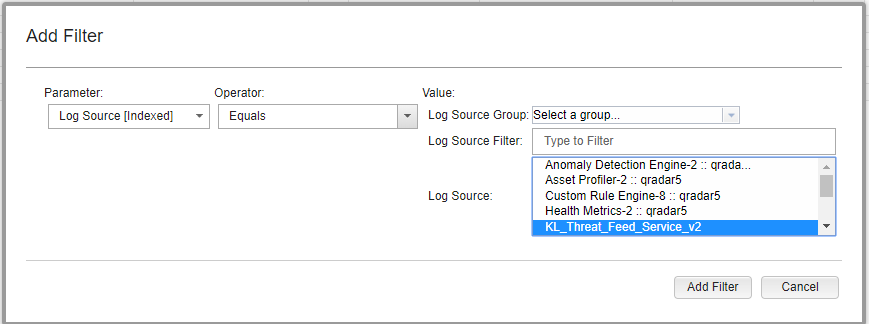
Adding a filter
- In the Parameter drop-down list, select
- Click Add Filter.
- Run the verification test, and then stop the events flow by clicking Pause (
 ) in the upper-right area of the window.
 - Press Ctrl (or Shift) to select several records, and then select Actions > DSM editor.
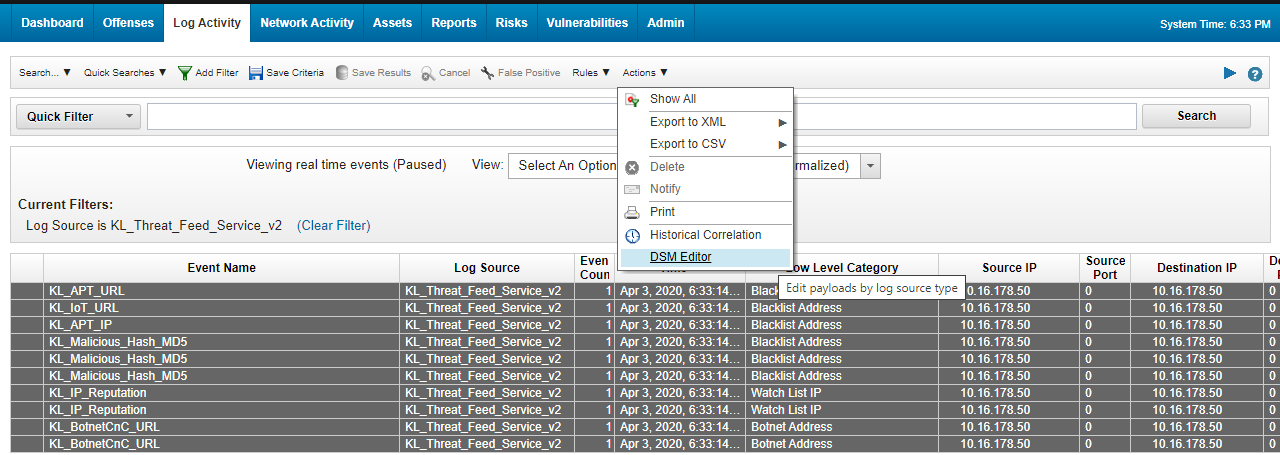
The Log Activity window
The DSM Editor window opens.
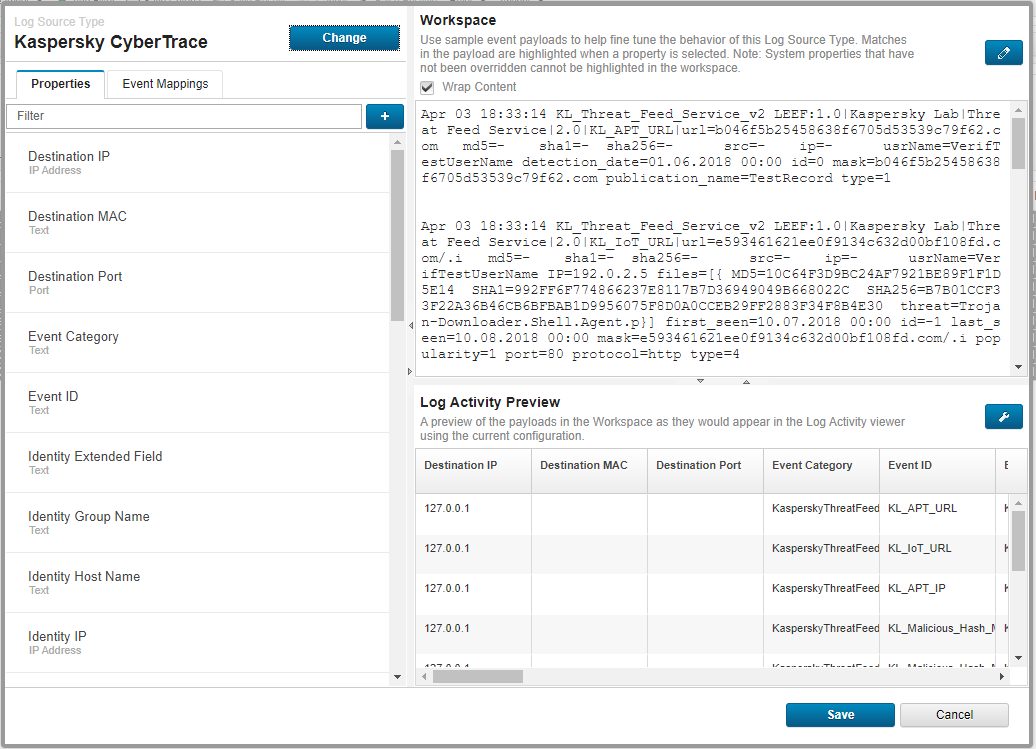
The DSM Editor window
- In the DSM Editor window, click the + button near the Filters text box.
The Choose a Custom Property Definition to Express form opens.
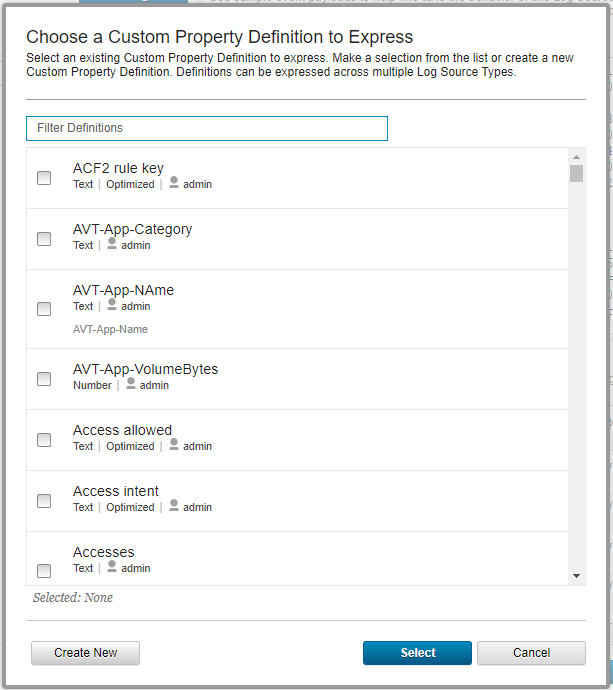
Choosing a custom property
- Click Create new.
The Create a new Custom Property Definition form opens.
- Fill in the form:
- In the Name field, enter
MD5. - In the Field Type drop-down list, select
Text. - In the Description field, enter a description of the property.
- Select the Enable this Property for Use in Rules and Search Indexing checkbox.
- Click Save.
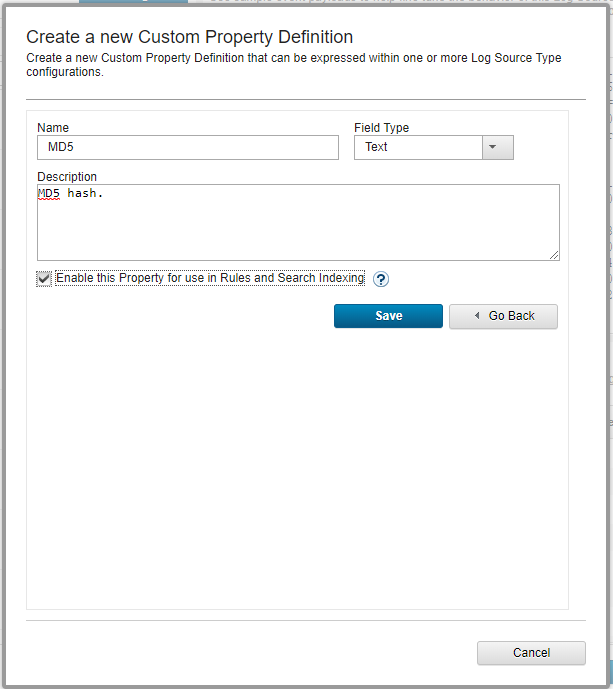
Creating a new custom property definition
- In the Name field, enter
- Add the
SHA1andSHA256properties similarly. - In the Choose a Custom Property Definition to Express window, select the created properties, add URL and Source IP, and then click Select.
- In the Log Activity Preview section, click Configure and then select the following properties:
Event NameIP (custom)MD5 (custom)SHA1 (custom)SHA256 (custom)Source IPURL (custom)Username
Click Update.
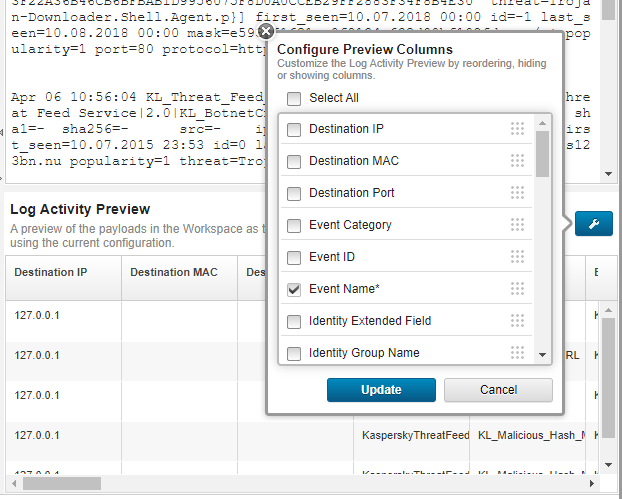
Configuring preview columns
- On the Properties tab, configure regular expressions as described in the table below:
Custom property
Regular expression
MD5
md5=([\da-fA-F]{32})SHA1
sha1=([\da-fA-F]{40})SHA256
sha256=([\da-fA-F]{64})URL
url=([-a-zA-Z0-9()@:%_\+.~#?&\/\/=]{2,})Source IP
src=(\d{1,3}\.\d{1,3}\.\d{1,3}\.\d{1,3})If necessary, type
1in the Capture Group field. - For the Source IP property, select the Override system behavior checkbox.
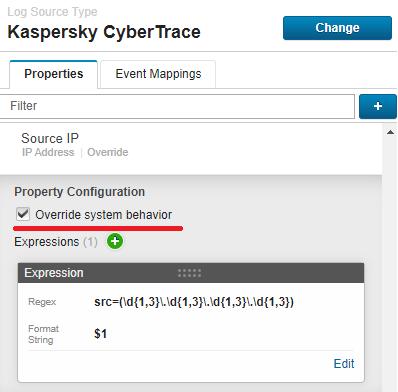
Source IP configuration
When changing the format for outgoing detection events in Kaspersky CyberTrace, the regular expressions that are specified above may require corresponding changes.
If all of the settings above are specified correctly, you will find the configured Custom properties in the Log Activity Preview section.
- Click Save and close the window.
- On the Log Activity tab, perform the new verification test.
After that, if you open the event received from
KL_Threat_Feed_Service_v2, the configured custom properties will be displayed.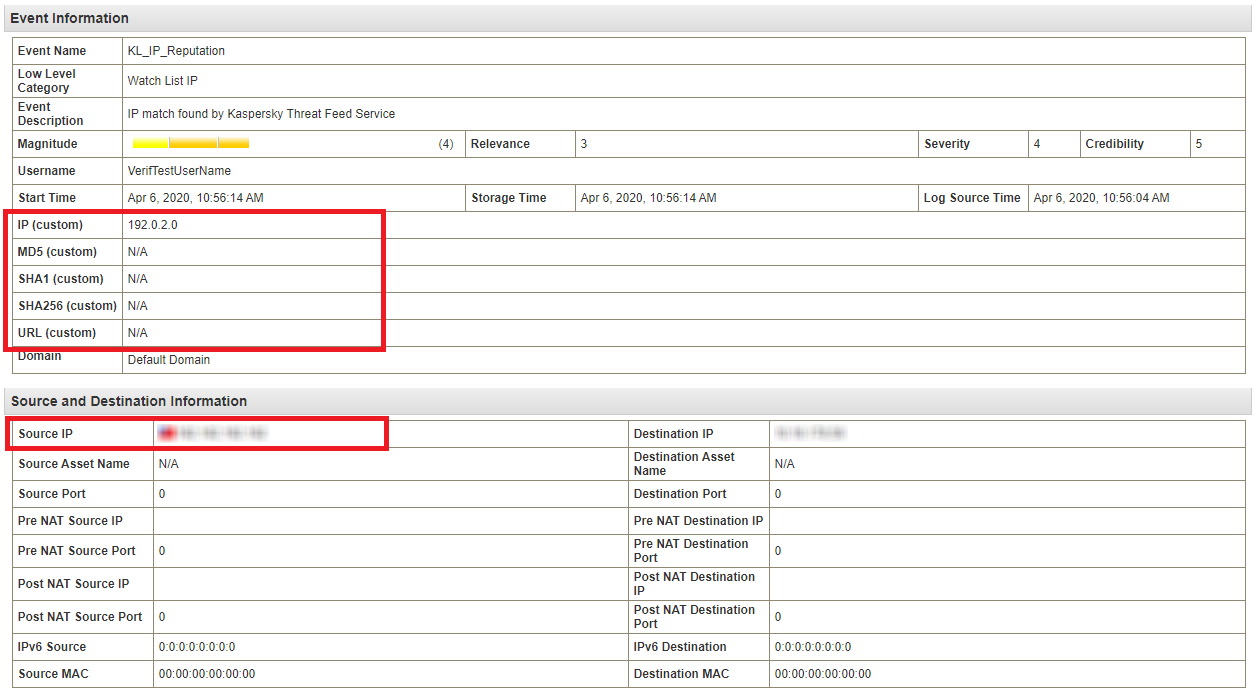
Event information
Step 6. Creating a search filter for CyberTrace events
This section describes how to create an event search.
To create an event search:
- Stop the events flow by clicking Pause () in the upper-right area of the window.
- In QRadar Console, select the Log Activity tab.
- Select Search > New Search.
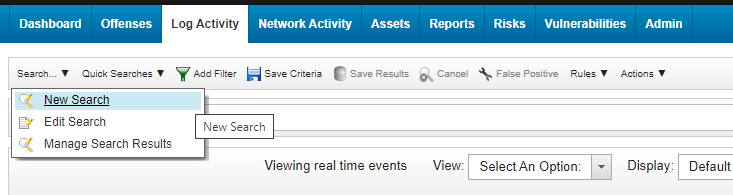
New search
- In the Column Definition form, add
MD5 (custom),SHA1 (custom),SHA256 (custom),URL (custom),IP (custom)from the Available Columns to the Columns list.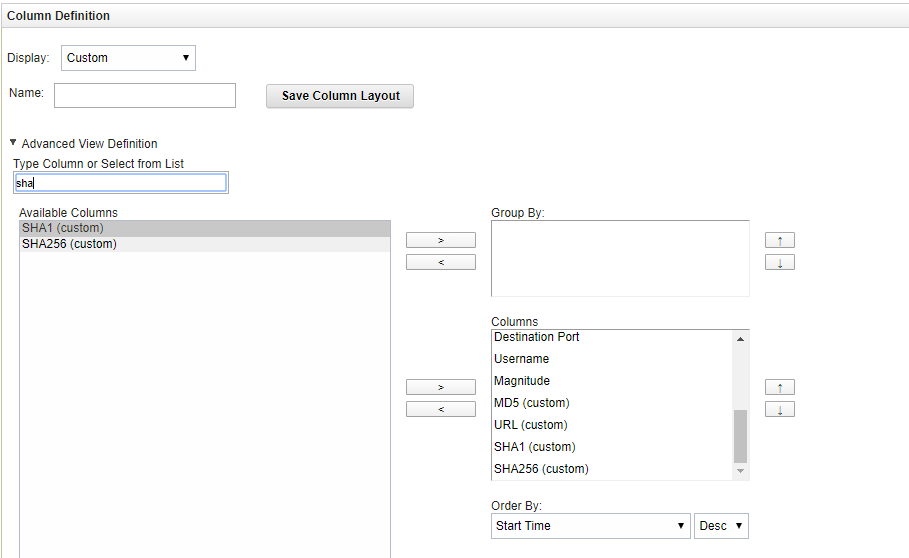
Defining columns
- Scroll down the page and in the Search Parameters form, set
KL_Threat_Feed_Service_v2as the log source:- In the Parameter drop-down list, select
Log Source [Indexed]. - In the Operator drop-down list, select
Equals. - In the Log Source list, select
KL_Threat_Feed_Service_v2.The selection
KL_Threat_Feed_Service_v2is the log source name that is set in theOutputSettings > EventFormatelement and theOutputSettings > AlertFormatelement of the Feed Service configuration file (you can also set them by using Kaspersky CyberTrace Web). - Click the Add Filter button.
The
Log Source is KL_Threat_Feed_Service_v2string will be added to the Current Filters list.
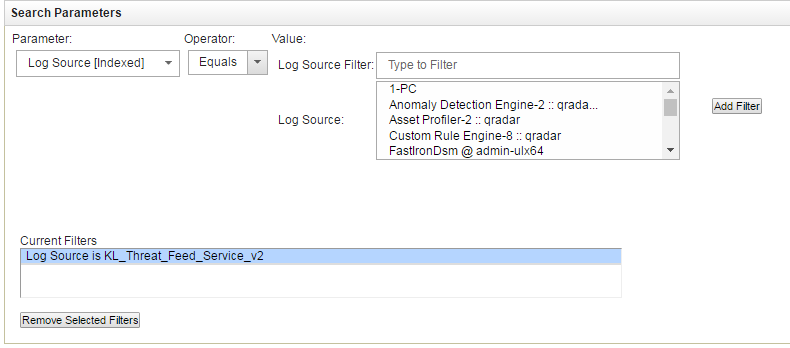
Setting the log source
- In the Parameter drop-down list, select
- Click either the Search button to display the search result.
- Click the Save Criteria button.

Save Criteria button
- In the Save Criteria form, type the name of the search in the Search Name text box, select the Include in my Quick Searches checkbox and then specify the analyzed interval for created search (for example, Real Time).
- Click OK.
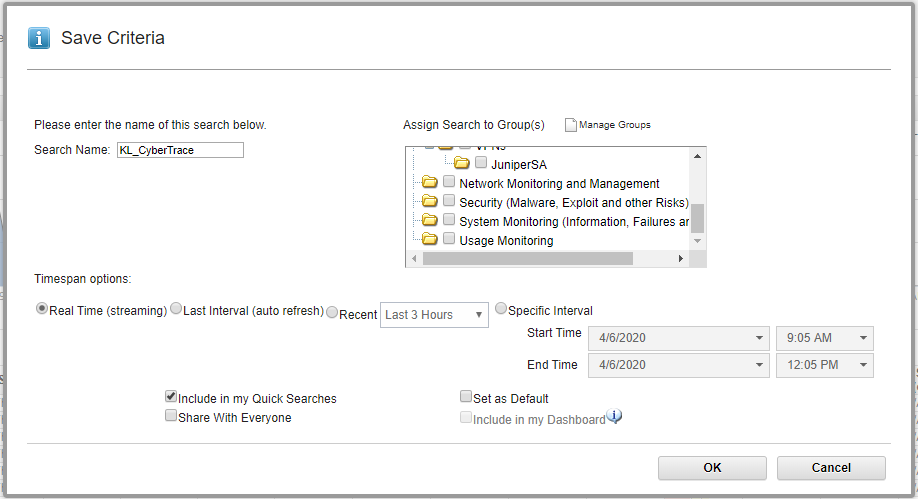
Saving criteria
Step 7 (optional). Displaying events in a dashboard
A QRadar dashboard presents detection results in visual format. For example, a chart displays the ratio of the number of events of different types.
QRadar 7.2.6 Patch 3 or later is required. Using an earlier version can lead to incorrect results.
Adding a chart that displays the detection results of Feed Service in visual format involves three procedures:
- Create an event search.
- Add a chart to a dashboard.
- Adjust the added chart.
Creating an event search
The following procedure describes how to create an event search.
To create an event search:
- In QRadar Console, select the Log Activity tab.
- Select Search > New Search.
- In the Column Definition form, delete
Event Namefrom the Available Columns list and addEvent Nameto the Group By list.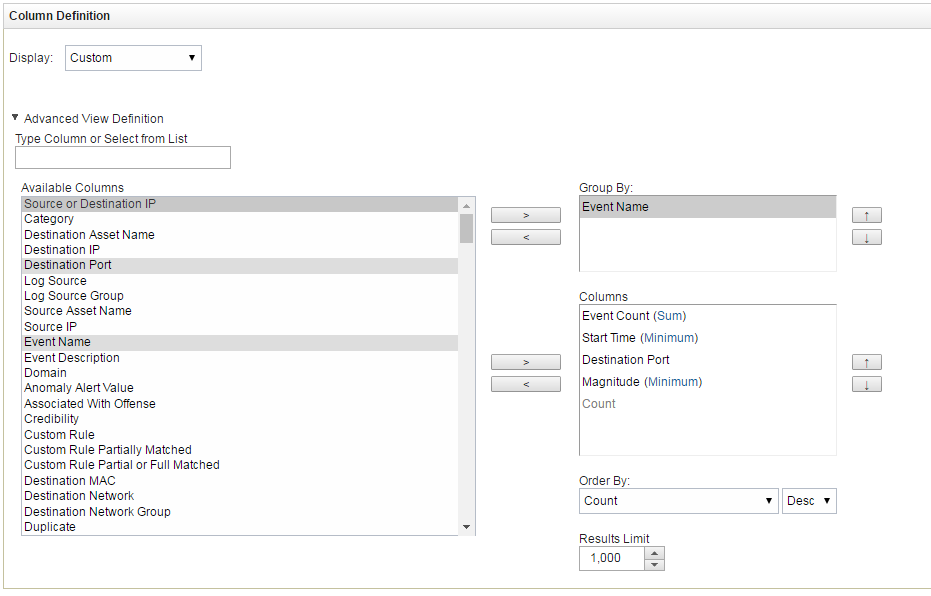
Defining columns
- Scroll down the page and in the Search Parameters form, set
KL_Threat_Feed_Service_v2as the log source:- In the Parameter drop-down list, select
Log Source [Indexed]. - In the Operator drop-down list, select
Equals. - In the Log Source list, select
KL_Threat_Feed_Service_v2.The selection
KL_Threat_Feed_Service_v2is the log source name that is set in the detection events format and alert events format parameters on the Events format tab of Kaspersky CyberTrace Web. - Click the Add Filter button.
The
Log Source is KL_Threat_Feed_Service_v2string will be added to the Current Filters list.
Setting the log source
- In the Parameter drop-down list, select
- Click either the Filter button or the Save button to display the search result.
- Click the Save Criteria button.
Save Criteria button
- In the Save Criteria form, select the Include in my Dashboard check box, type the name of the search in the Search Name text box, and then click OK.
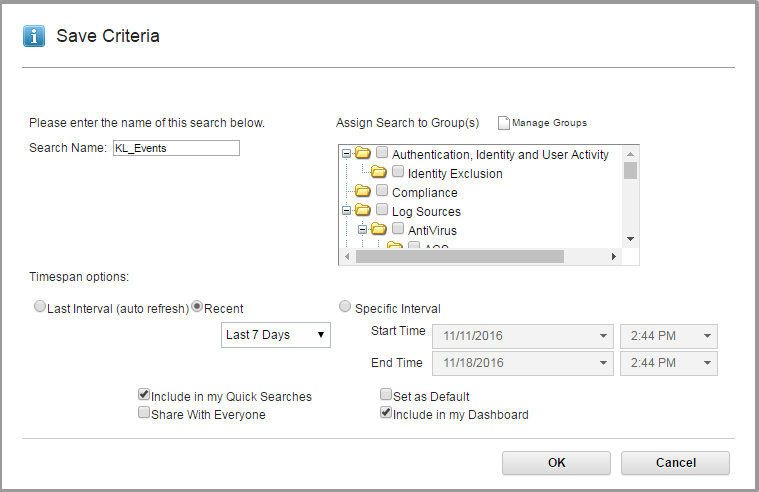
Saving criteria
Adding a diagram to a dashboard
The following procedure describes how to add a diagram to a dashboard.
To add a diagram to a dashboard:
- In QRadar Console, select the Dashboard tab.
- Select Add Item > Log Activity > Event Searches > KL_Events.
Here,
KL_Eventsis the name of the search that you set.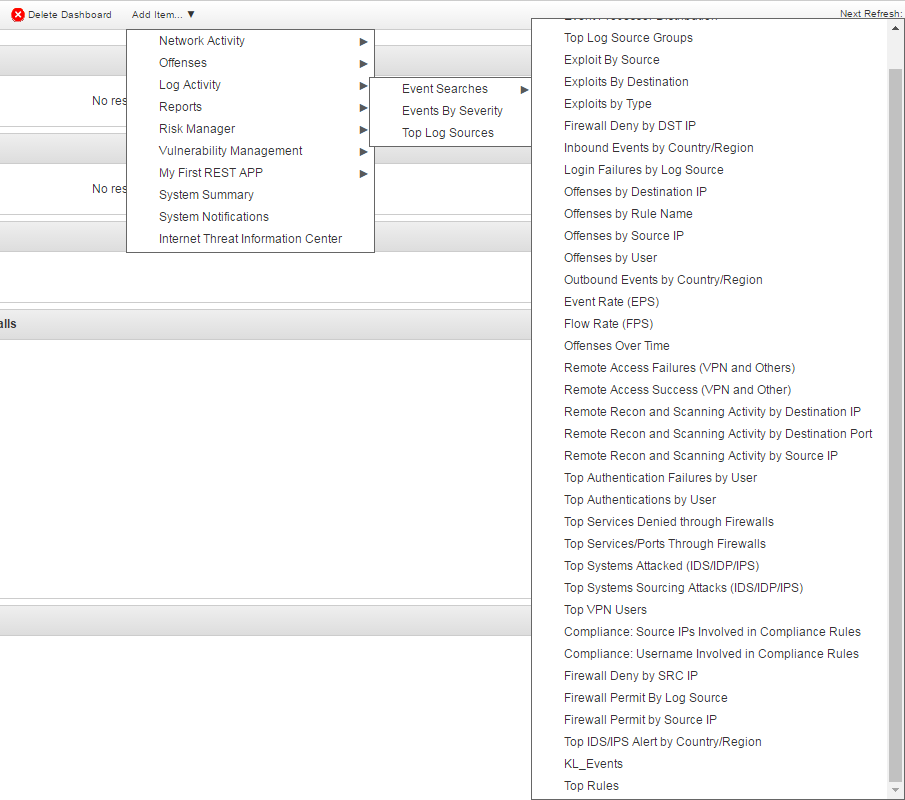
Adding an item to the dashboard
A chart will appear on the dashboard.
New chart
Adjusting the added chart
The following procedure describes how to adjust the chart that has been added to the dashboard.
To adjust the added chart:
- Click the Settings button (
 ) in the upper-right corner of the chart box.
 - Specify the settings of the chart.
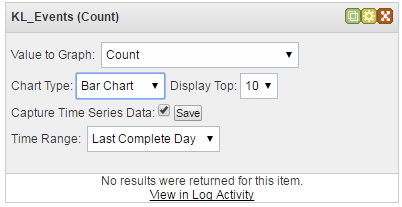
Chart settings
If you select the Capture Time Series Data check box, the chart will display all incoming data received after this check box is selected; the item selected in the Time Range drop-down list will be ignored. If you clear the Capture Time Series Data check box, only the information received during the time range selected in the Time Range drop-down box will be displayed.
After events arrive, the chart displays them.
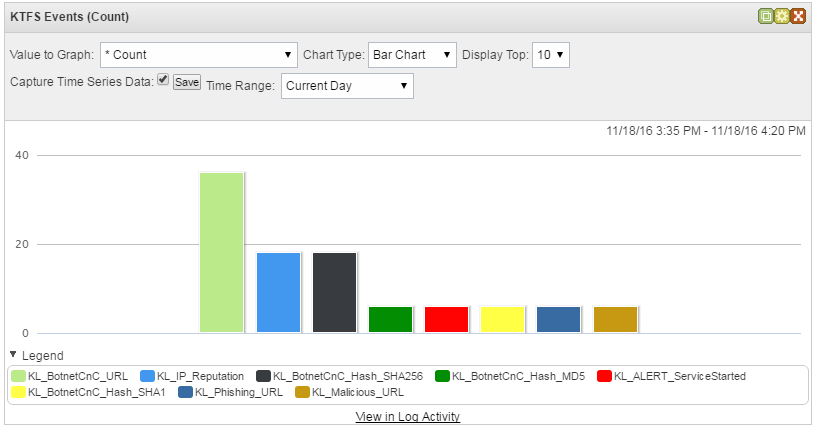
Bar chart
In the Chart Type drop-down list you can select the type of chart in which the data will be displayed.
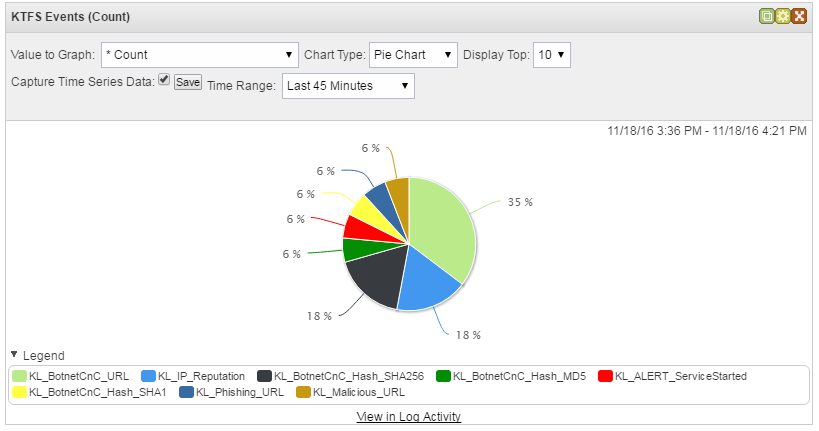
Pie chart
You can also get information about charts, which are based on the search results, from QRadar Help (section "Dashboard management" > "Adding search-based dashboard items to the Add Items list").
Page topStep 8 (optional). Creating notifications about incoming service events
You can create notifications about issues with Kaspersky CyberTrace by configuring alert rules.
To create notifications about service events from Kaspersky CyberTrace in QRadar:
- Run QRadar Console.
- Select any of the Offenses, Log Activity or Network Activity tabs, and then select Rules.
- In the Actions drop-down list, select New Event Rule.
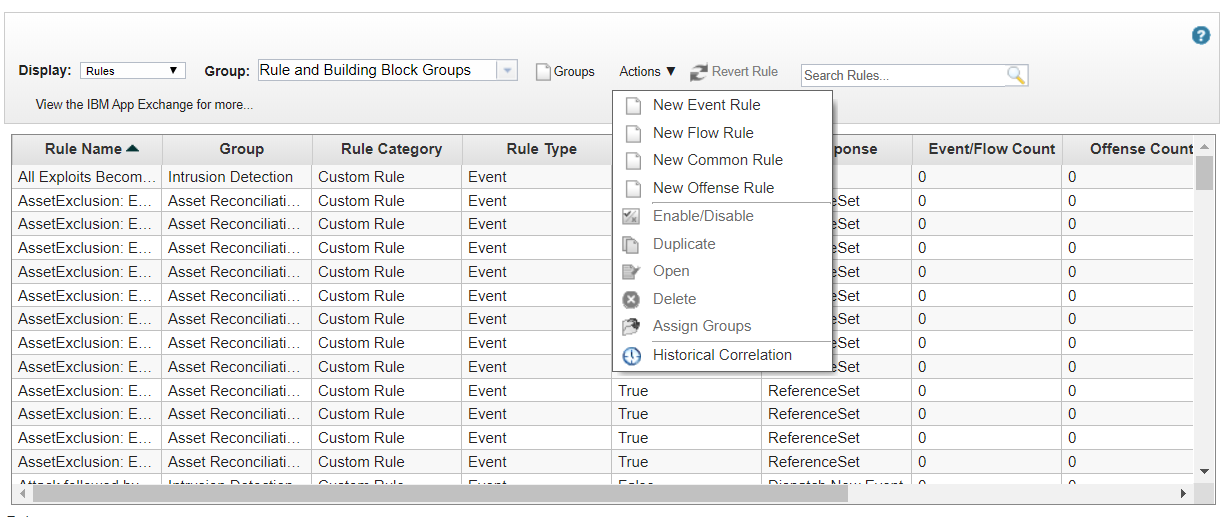
The Rules page
The Rule Wizard page opens.
- On the Rule Wizard page, click Next to select the source from which you want the rule to be generated.
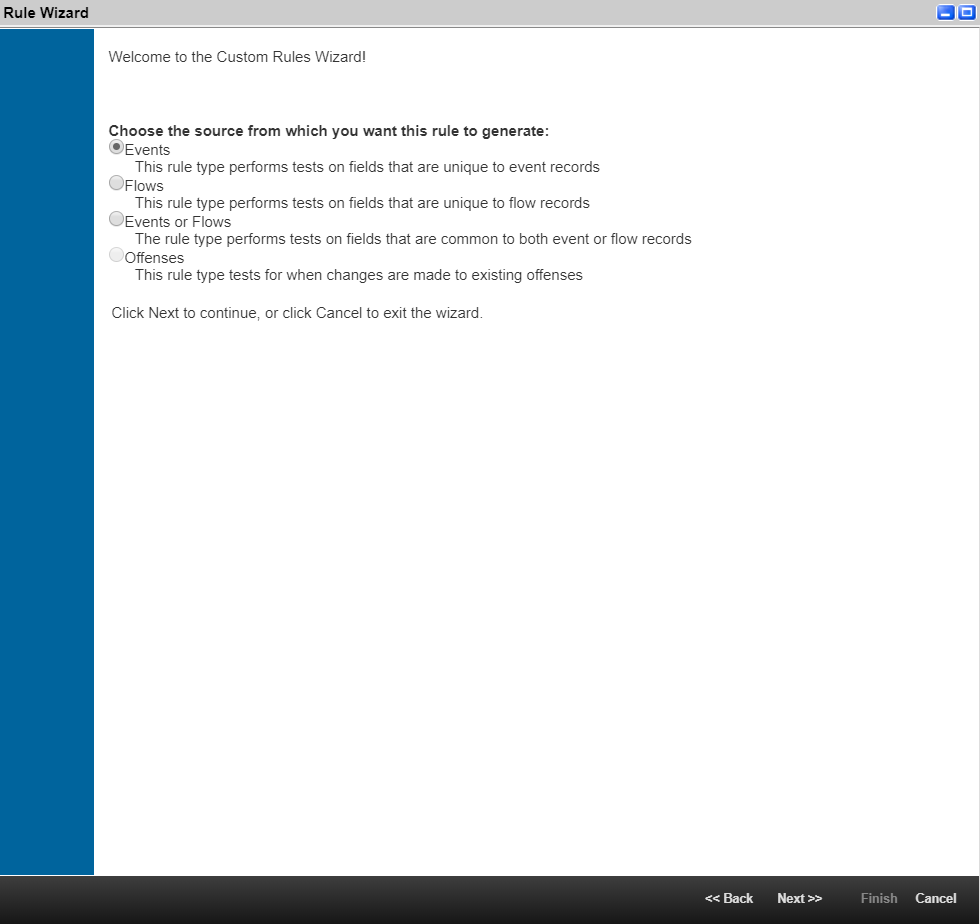
The Rules Wizard window
- Select Events, and then click Next.
- On the Rule Test Stack Editor page, perform the following actions:
- Add the following test conditions for a new rule:
when the event(s) were detected by one or more of these log sourceswhen the event matches this search filter
- For each specified condition, set a logical
andoperator. - For the
when the event(s) were detected by one or more of these log sourcescondition, specify Log Source that is equal toKL_Threat_Feed_Service_v2. If this event source is absent, add Feed Service as a log source. - For the
when the event matches this search filtercondition, specify a filter for comparing Event Name with the value of the event source name by performing the following actions:- In the list of the event fields, select Event Name.
- In the list of conditions, select Equals.
- Click Browse to choose the name of the service event for which the rule is created.
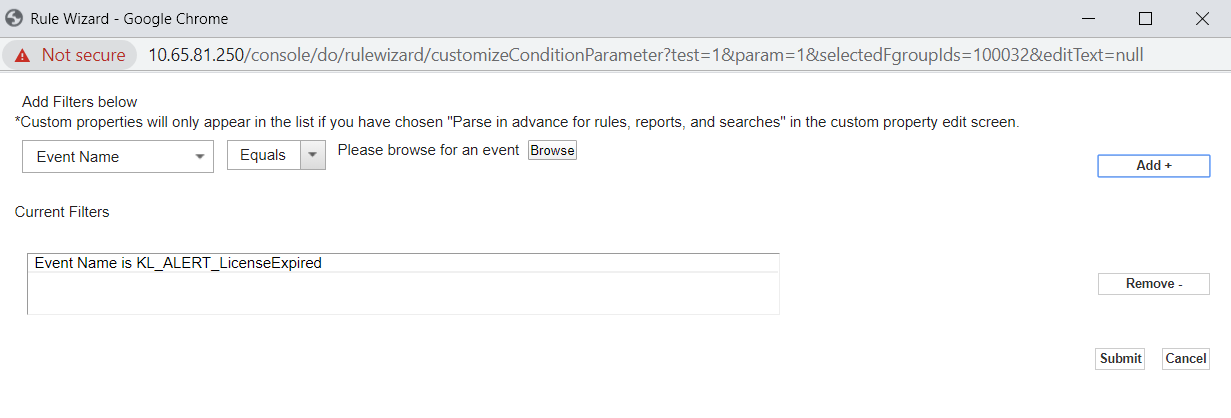
- Click Add+, and then Submit.
If the necessary event is absent, add it to the QRadar Identifiers (QID) list.
- Enter the name of the rule and select the way in which this rule will be applied to the incoming events (Local or Global). For more information about the Local and Global rules, see IBM documentation.
- Select the group that you need for the rule.
- Add a description for the rule.
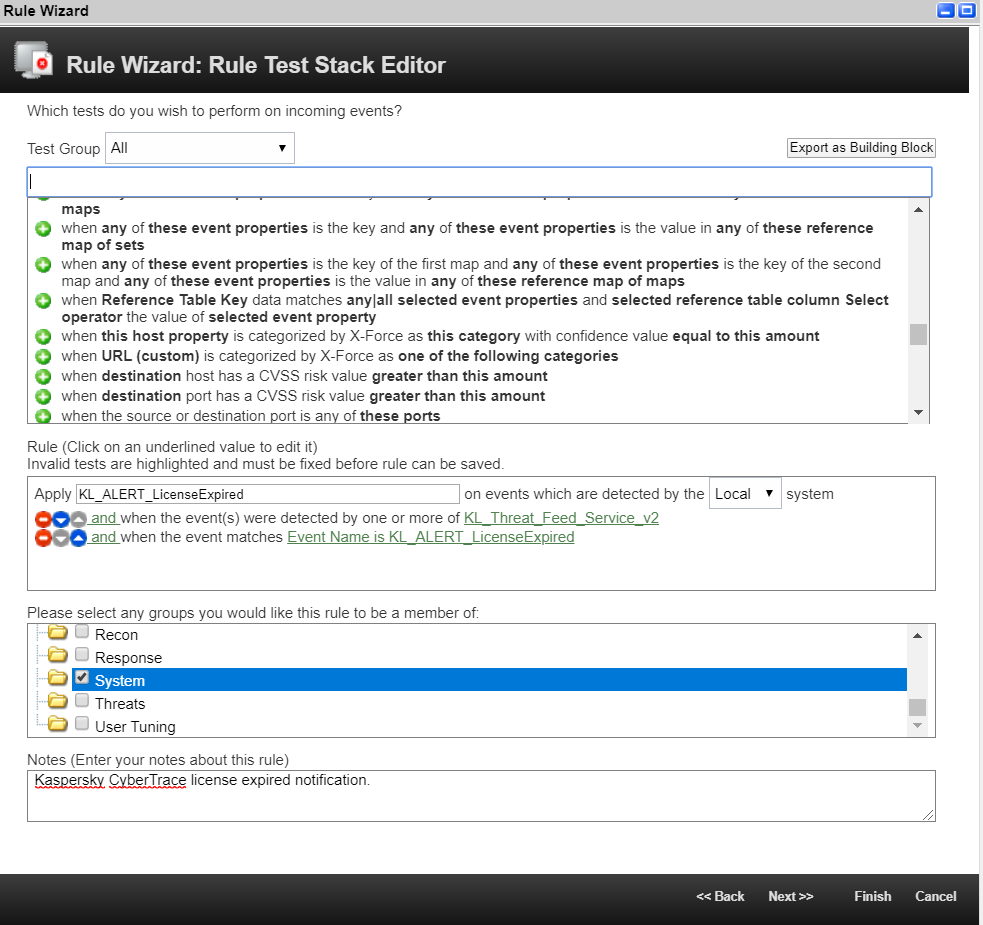
The Rule Editor window
- Click Next.
- Add the following test conditions for a new rule:
- On the Rule Response page, perform the following actions:
- Select Notify.
- If necessary, specify a limit on a rule triggering in the Response Limiter section.
- Check the Enable Rule section.
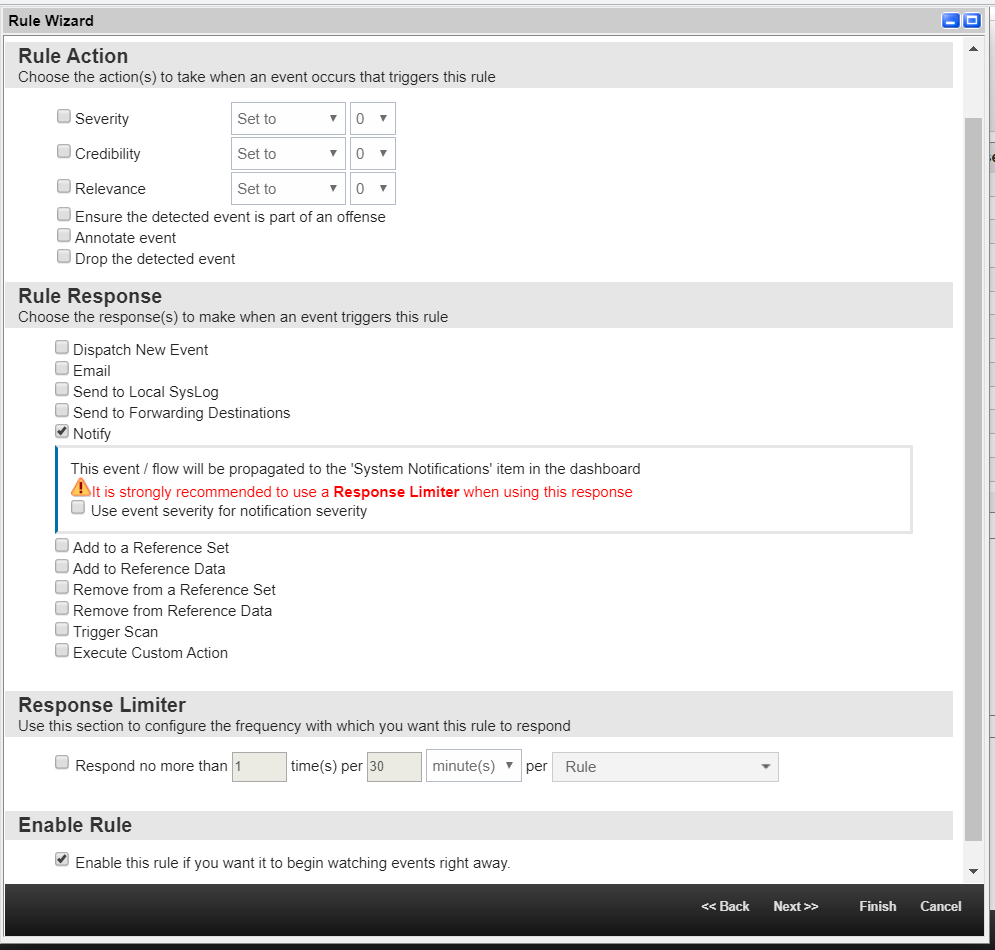
The Rule Editor page
- Click Next
- On the Rule Summary page, make sure that all settings are specified correctly, and click Finish.
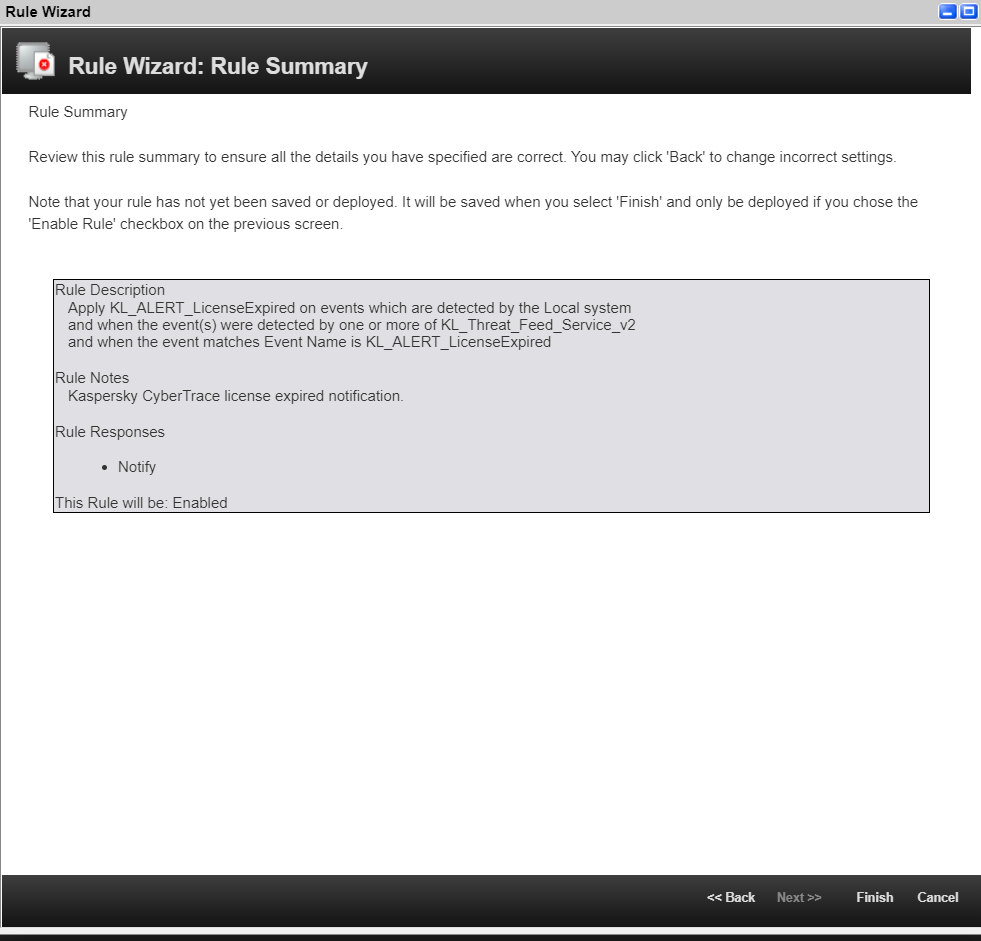
The Rule Summary page
The rule will now be added to the Rules list.
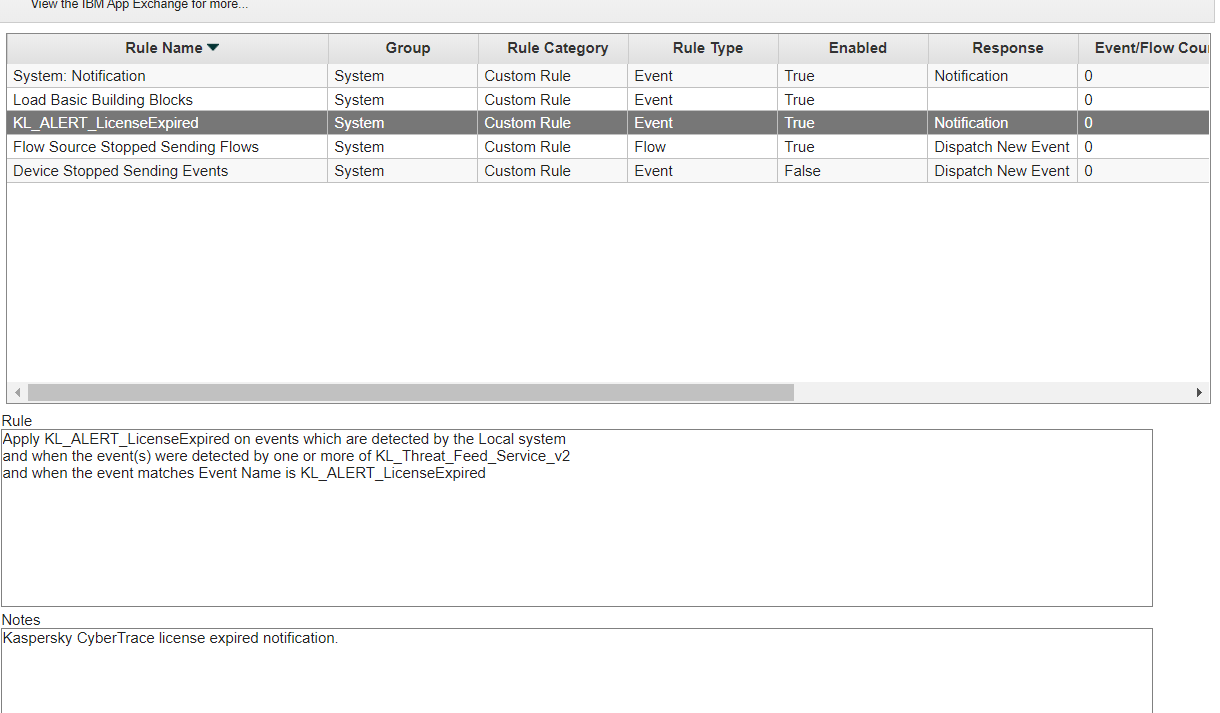
The Rules list
The added rule generates a notification about an incoming service event. You can browse these notifications by clicking the Messages drop-down list. Also, notifications are displayed in QRadar Console as a pop-up message.
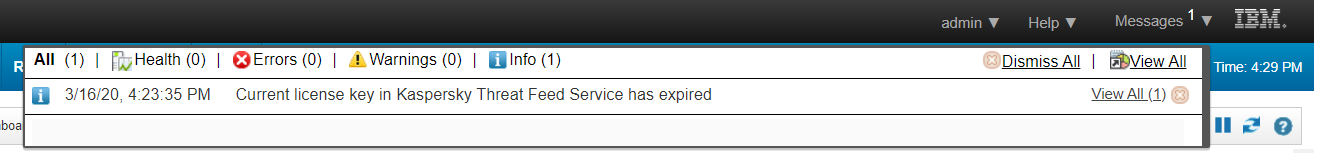
The Messages drop-down list
You can configure displaying of notifications on the Dashboard tab.
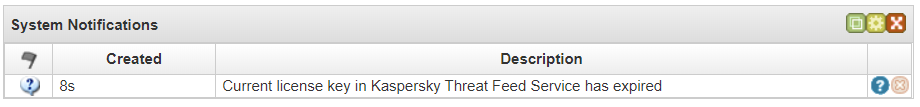
System notifications on the Dashboard tab
To configure displaying of notifications on the Dashboard tab:
- Select the Dashboard tab.
- In the Add Item drop-down list, select System Notifications.
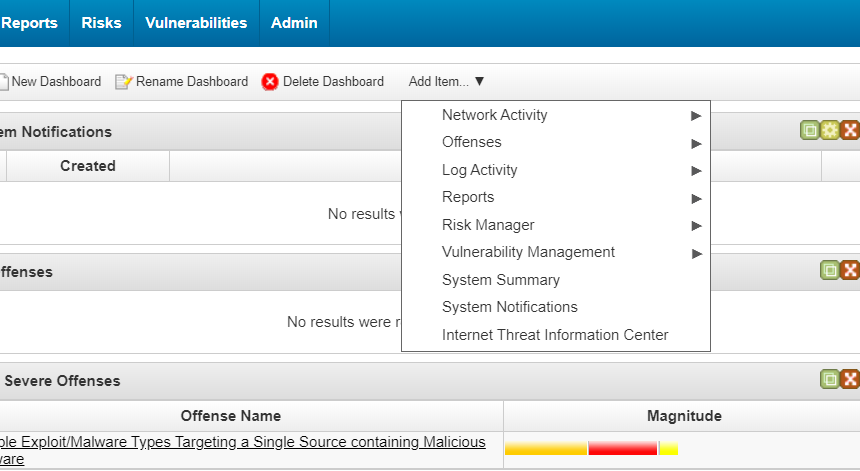
Adding system notifications on the Dashboard tab
Step 9 (optional). Installing Kaspersky Threat Feed App
This section describes how to install Kaspersky Threat Feed App.
Only a user account that has the System Administrator role can manage Kaspersky Threat Feed App.
Getting Kaspersky Threat Feed App
You can get the Kaspersky Threat Feed App installation package from IBM Security App Exchange.
Installing Kaspersky Threat Feed App
To install Kaspersky Threat Feed App:
- In QRadar, select Admin and then Extensions Management.
- In the Extensions Management form, click the Add button.

Extensions Management form
- Select the application file archive.
- Select the Install immediately check box.
- Click Add.
- Click Install.
A list of changes to be made is displayed. In particular, the custom event properties that will be added are displayed.
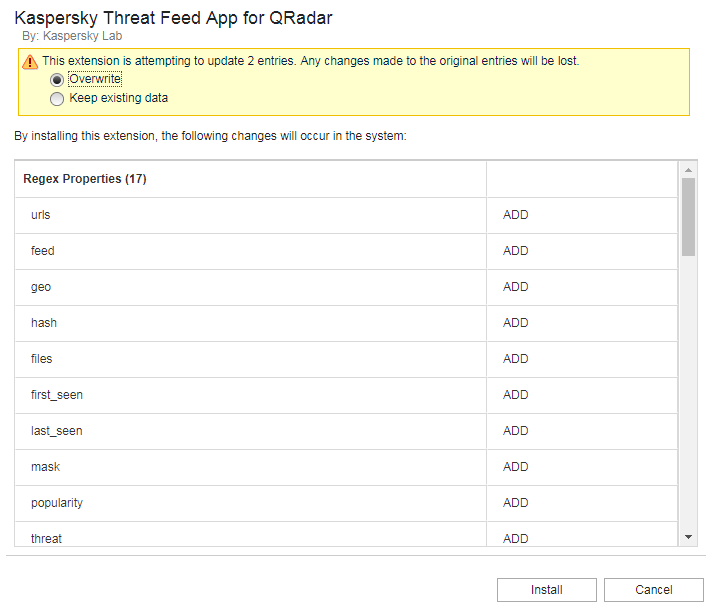
Custom event properties to be added
The following custom event properties are added when the app is installed:
urlsfeedgeohashfilesfirst_seenlast_seenmaskpopularitythreatwhoisURLSHA1 HashSHA256 HashMD5 Hashiprecords_count
You will use these properties to enable the indexes of the added custom event properties and to specify the log source type.
- Click Install again.
Kaspersky Threat Feed App appears in the Extensions Management form after it is installed.
- Refresh the browser window before you use the app.
After Kaspersky Threat Feed Service App is installed, its name will appear as a tab—Kaspersky Data Feeds—in QRadar Console.

Kaspersky Data Feeds tab
- In QRadar Console, select Kaspersky Data Feeds tab.
The Configuration required form will appear.
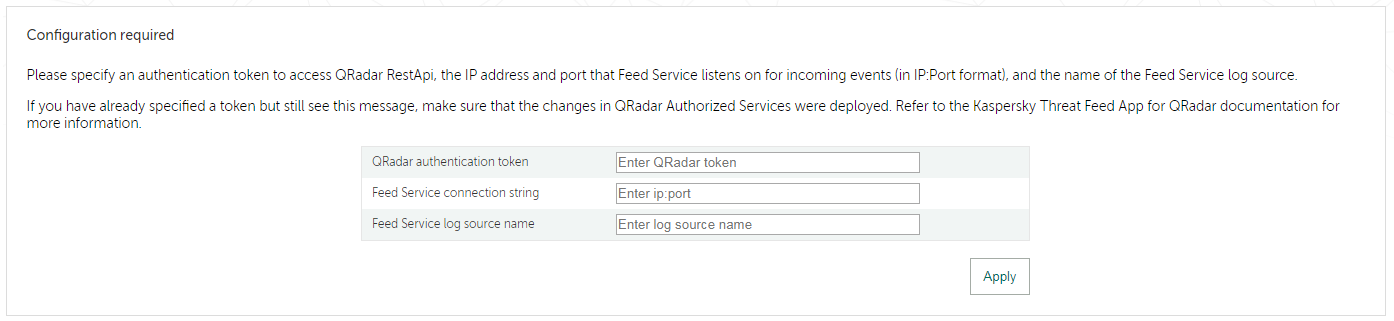
Configuration required form
- In the Configuration required form:
- In the QRadar authentication token field, specify an authentication token to access QRadar REST API.
You can specify an existing token or create a new token.
If the specified token expires, the Configuration required form will appear again the next time you select Kaspersky Data Feeds. In this case, you must specify a new token.
- In the Feed Service connection string field, specify the IP address and port that Feed Service listens on for incoming events.
You cannot specify the
127.0.0.1IP address, even if Kaspersky Threat Feed App is installed on the QRadar computer. Instead, specify the external IP address of the QRadar computer. - In the Feed Service log source name field, specify the log source name of Feed Service as it is registered in QRadar.
This name is displayed in the Name column of the window that opens after Admin > Log Sources is selected in QRadar Console. For example,
KL_Threat_Feed_Service_v2.For more information about specifying log sources, see the section about configuring Kaspersky Threat Feed App.
- In the QRadar authentication token field, specify an authentication token to access QRadar REST API.
Step 10 (optional). Enabling the indexes of the added custom event properties
We recommend that you enable the indexes of the added custom event properties. This will increase the performance of Kaspersky Threat Feed App.
To enable the indexes of the added custom event properties:
- In QRadar, select Admin and under System Configuration select Index Management.
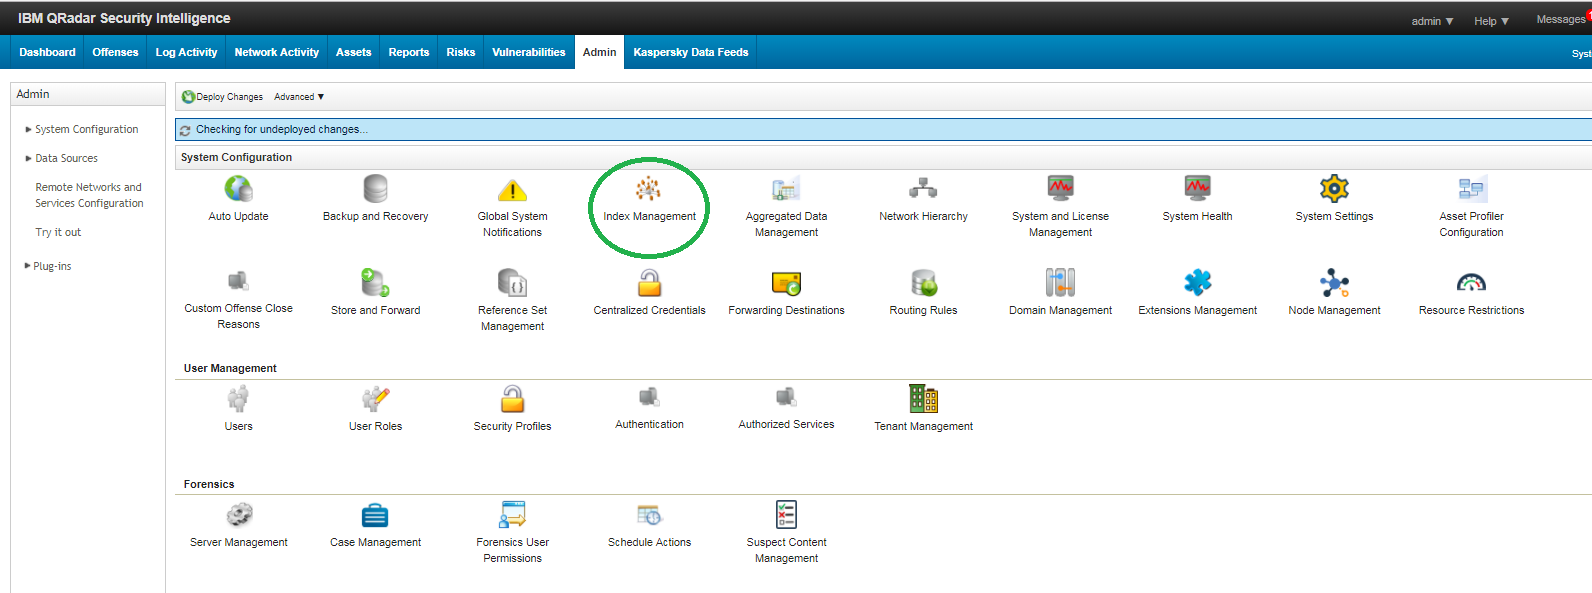
Admin tab of QRadar Console (system configuration tools)
The Index Management window opens.
- Optionally, specify the filter to find the added properties.
- Select one or several table rows, and click Enable Index.
- Click Save.
A message box appears that asks you whether you want to save the changes you made.
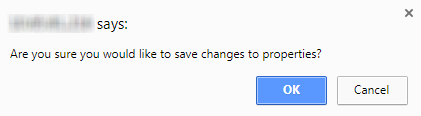
Saving changes to the indexes
- Click OK to save changes to the properties.
Step 11 (optional). Configuring Kaspersky Threat Feed App
You can configure Kaspersky Threat Feed App by selecting the Settings link in QRadar Console.

Settings link
You specify the settings in a form that appears after you select the Settings link.
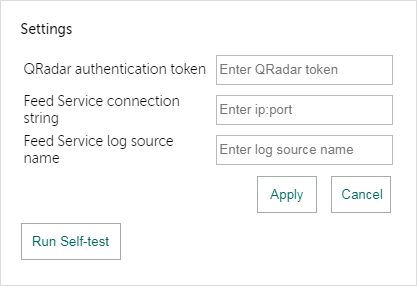
Settings form
The following settings fields are available:
- QRadar authentication token
The authentication token to access QRadar RestApi.
You can specify an existing token or create a new token.
- Feed Service connection string
The IP address and port that Feed Service listens on for incoming events.
If you have installed Kaspersky CyberTrace on the same computer on which QRadar is installed, Kaspersky Threat Feed App will not be able to connect to QRadar because the iptables rules forbid the communication of a Docker container, in which Kaspersky Threat Feed App is running, and the QRadar computer.
To make Kaspersky Threat Feed App work on the QRadar computer, connect to the QRadar computer using the SSH protocol and run the following command:
iptables -I INPUT -i <D_interface> -p tcp --destination-port <FS_port> -j ACCEPTThis command includes:
-
<D_interface>—Interface of the Docker container that contains Kaspersky Threat Feed App for QRadar.To find the
<D_interface>name, perform the following:- Find the identifier of Kaspersky Threat Feed App by running the following command:
psql -U qradar -c "select id, name from installed_application;"A table appears. Find the value for the identifier of Kaspersky Threat Feed App (hereinafter
<app_id>) from theidcolumn. - Find the identifier of the Docker container in which Kaspersky Threat Feed App is contained by running the following command:
docker psIn the output result, find the image with the
.../qapp/<app_id>:x.x.xname, wherex.x.xis the installed version of Kaspersky Threat Feed App, and find itsCONTAINER IDvalue (hereinafter<container_id>). - Find the interface name for the Docker image that contains Kaspersky Threat Feed App, by running the following command:
docker inspect <container_id> | grep NetworkModeThe output result appears, in the format
"NetworkMode": "<D_interface>". Substitute this result for<D_interface>in the command above.
- Find the identifier of Kaspersky Threat Feed App by running the following command:
<FS_port>—Port that Feed Service listens on for incoming events.
If you run the above command, the added rule will be present in iptables only until iptables is restarted, or the QRadar computer is restarted. To add this rule permanently, add it to the
/etc/sysconfig/iptablesfile (the path to the iptables file depends on the environment configuration).Also note that you cannot specify the
127.0.0.1IP address even if Kaspersky Threat Feed App is installed on the QRadar computer. Specify the external IP address of the QRadar computer instead. -
- Feed Service log source name
The log source name of Feed Service as it is registered in QRadar. This name is displayed in the Name column of the window that opens after Admin > Log Sources is selected in QRadar Console.
If the Feed Service log source was added automatically when you sent the initial set of Feed Service events to QRadar, the log source name is
Kaspersky Threat Feed Service @ [id], where[id]is the identifier of Feed Service events. (By default,[id]isKL_Threat_Feed_Service_v2). If you had to add Feed Service to QRadar as a log source manually because you did not have the latest QRadar updates, the log source name is[id];that is,KL_Threat_Feed_Service_v2by default.It takes some time to visualize the requested data after you have changed the log source name or the installed Kaspersky Threat Feed App. While the data is being loaded, a progress bar is displayed. The time required for getting all the data depends on the selected period over which the data is visualized.
After you configure Kaspersky Threat Feed App, you can run the verification test by clicking the Run self-test button.
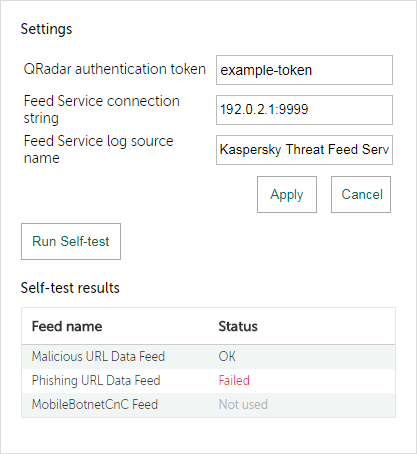
Self-test results
A test result of Failed for any feed means that a tested object is assigned to an incorrect category. The error can originate, for example, in an incorrect configuration file.
Integration with RSA NetWitness
This chapter describes how to integrate Kaspersky CyberTrace with RSA NetWitness.
Integration steps (RSA NetWitness)
This chapter describes how to integrate Kaspersky CyberTrace with RSA NetWitness.
About the integration schemes
The recommended integration scheme for integrating Kaspersky CyberTrace with RSA NetWitness is the standard integration scheme.
How to integrate with RSA NetWitness
Before you start to integrate Kaspersky CyberTrace with RSA NetWitness:
- Before you install Kaspersky CyberTrace, make sure that the RSA NetWitness services meet the software requirements.
- Make sure that you have installed Kaspersky CyberTrace.
To integrate Kaspersky CyberTrace with RSA NetWitness:
- Step 1. Configure RSA NetWitness so that it will forward the received events to Feed Service.
- Step 2. Configure RSA NetWitness to receive events from Feed Service.
- Step 3 (optional). Import a meta group for browsing all fields in RSA NetWitness that are filled by Feed Service.
- Step 4 (optional). Import the Feed Service rules to RSA NetWitness.
- Step 5 (optional). Import a preconfigured report to RSA NetWitness.
This step requires importing Feed Service rules (Step 4).
- Step 6 (optional). Import preconfigured charts and a dashboard to RSA NetWitness.
This step requires importing Feed Service rules (Step 4).
- Step 7. Perform the verification test.
Please make sure you perform the verification test before editing any matching process settings.
Before you begin (RSA NetWitness)
This section describes additional requirements that must be met before you integrate Kaspersky CyberTrace with RSA NetWitness.
Checking software settings (RSA NetWitness)
This section describes the requirements that the RSA NetWitness services must meet.
Check that the following conditions are met:
- The index file (index-concentrator-custom.xml) of the Concentrator which receives Feed Service events must contain the following metafields:
virusnameThis and other metafields (except for
msg) must have theIndexValueslevel. Also, set thedefaultActionvalue of these metafields toOpen.user.srcip.srcactionmsgThis metafield must have the
IndexKeys(the presence of the metafield in an event is indexed) orIndexNone(the metafield is not indexed) level in the index-concentrator-custom.xml file. If you set theIndexValueslevel for this metafield, the hard disk space will be consumed rapidly.event.sourcedevice.ipip.dsturlchecksum
If any of these fields are absent from the index file, add them there and restart the Concentrator, as described in the section about RSA NetWitness troubleshooting.
If you do not have a Concentrator but you use a Log Decoder for storing data from Feed Service, change the index-logdecoder-custom.xml file and restart the Log Decoder as described above.
Update only the index file of a Concentrator (index-concentrator-custom.xml) if the Concentrator receives data from a Log Decoder. For more information, refer to https://community.rsa.com/docs/DOC-41760. Also, update the index file of a Log Decoder (index-logdecoder-custom.xml) if you use the Log Decoder as the source of data in which you search for events or if you use the Log Decoder to create reports or dashboards.
- The table-map-custom.xml configuration file (the configuration file of a Log Decoder) must contain the following metafields:
virusnamec_usernamesaddrdaddrurlchecksummsgevent_sourcehostipaction
The value of the
flagsattribute must beNonefor each of these metafields.If any of these fields are absent from the index files, refer to the section about RSA NetWitness troubleshooting.
Detection events sent by Feed Service contain the context from the feeds in separate fields. You can display and use these fields in RSA NetWitness. (In RSA NetWitness, the names of these fields will have the kl. prefix.)
To display the context fields:
- Add the contents of
%service_dir%/integration/rsa/additional_elements/table-map-custom.xmlto thetable-map-custom.xmlfile of the log decoder to which Feed Service will send detection events. - Add the contents
%service_dir%/integration/rsa/additional_elements/index-concentrator-custom.xmlto theindex-concentrator-custom.xmlfile of the Concentrator that will store the events from Feed Service.
You can specify all the settings described above by using the RSA NetWitness web user interface in the Services (Log Decoder and Concentrator) > Config view.
Restart the log decoder and Concentrator after you have edited the table-map-custom.xml and index-concentrator-custom.xml files.
Page topStandard integration (RSA NetWitness)
This section contains instructions for integrating Kaspersky CyberTrace and RSA NetWitness in the standard integration scheme.
About the standard integration scheme (RSA NetWitness)
This section describes the standard integration scheme for RSA NetWitness and Kaspersky CyberTrace.
About the components of the standard integration scheme
The following components are used in the standard integration scheme for RSA NetWitness:
- Feed Service
This service matches RSA NetWitness events against Kaspersky Threat Data Feeds.
- RSA NetWitness
The SIEM solution used in this integration.
- Security controls
These are sources of events for RSA NetWitness such as firewalls, proxies, intrusion detection systems, and other networking devices.
Security controls can send events to RSA NetWitness by any method supported by RSA NetWitness.
Standard integration scheme
In the standard integration scheme, Feed Service by default is configured to listen for incoming events from RSA NetWitness on 127.0.0.1:9999.
Feed Service sends detection events to IP address 127.0.0.1 and port 514 of the interface defined in RSA configuration. The address of this interface is specified when you install Kaspersky CyberTrace. Security controls also send events to port 514 of the interface defined in the RSA NetWitness configuration.
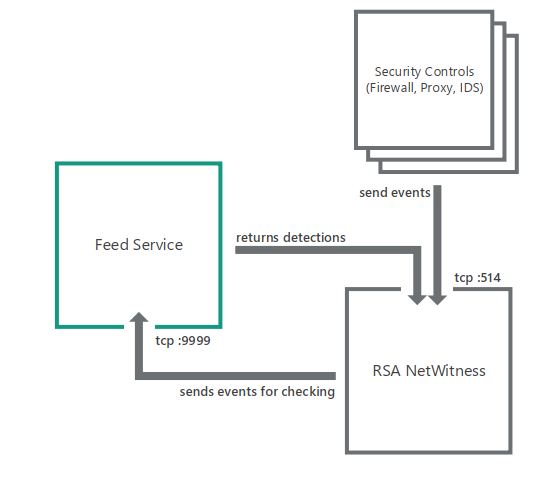
Standard integration scheme for RSA NetWitness
Page topStep 1. Forwarding events from RSA NetWitness
This section describes how to configure RSA NetWitness so that it will forward the received events to Feed Service.
To forward events from RSA NetWitness to Feed Service:
- In the RSA NetWitness main window, select Administration > Services.
- In the Services table, below, select the relevant Log Decoder (the Log Decoder that receives events containing a URL, hash, or IP address).
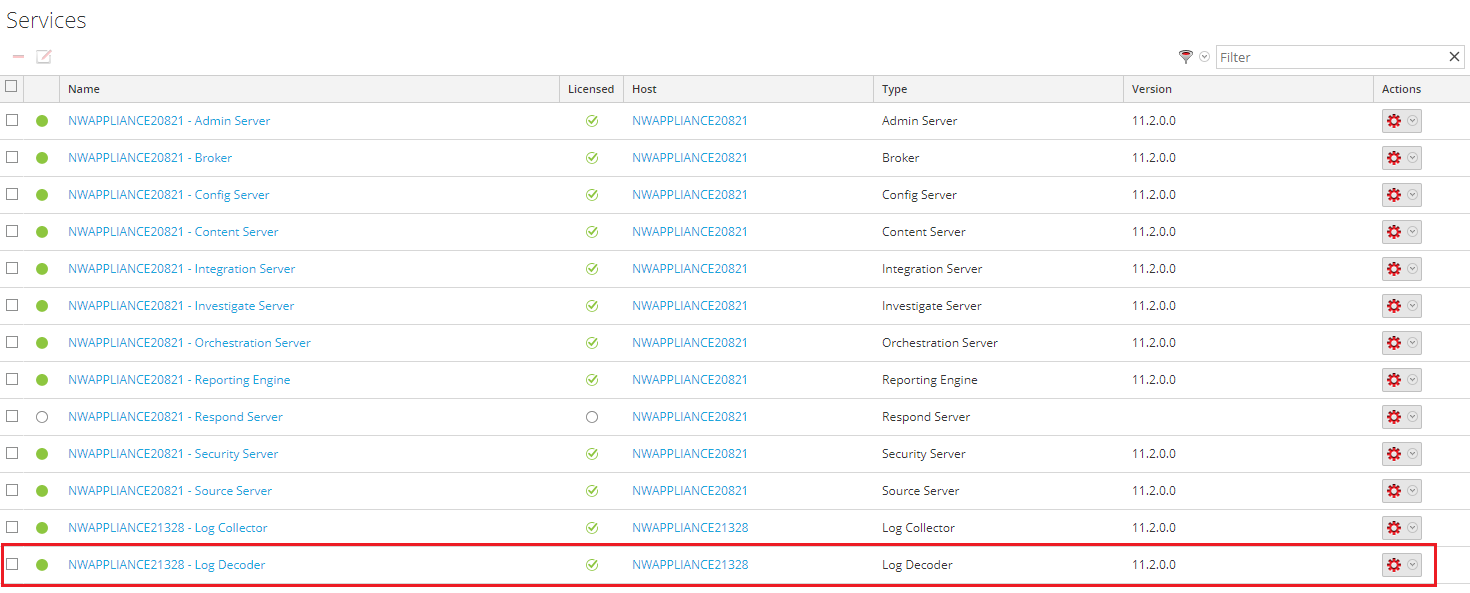
Selecting a Log Decoder
If more than one Log Decoder is used for receiving events, repeat the following steps for each Log Decoder.
- For the selected Log Decoder, in the Actions column, select the Settings split button (
 ) and in the drop-down list select View > Config.
 - Select the App Rules tab and click the Add button (
 ).
).The Rule Editor window opens.
- Specify the following data:
- Rule Name:
cybertrace - Condition:
device.type='%DEVICE_NAME_1%'This is an example of a condition, in which the
%DEVICE_NAME_1%string represents the name of the device whose events must be sent to Feed Service. Following is another example of a condition, according to which events from Cisco ASA and Check Point Firewall must be sent to Feed Service:device.type='ciscoasa' || device.type='checkpointfw1'If an event meets the condition specified here, it will be sent to Feed Service.
- Alert: Selected
- Forward: Selected
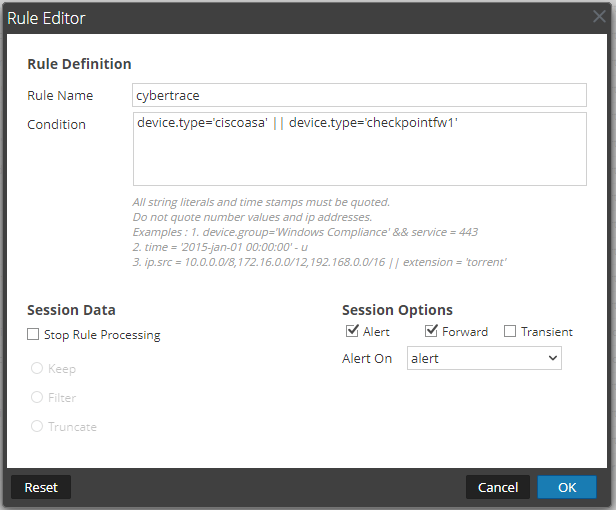
Rule Editor window
For information on how to create rules, refer to https://community.rsa.com/t5/rsa-netwitness-platform-online/configure-application-rules/ta-p/592148.
- Rule Name:
- Click OK.
- Click Apply.
- Next to the Log Decoder name, select Config > Explore.
- Specify the destination:
- For RSA NetWitness versions 11.2 and above:
For the /decoder/config/logs.forwarding.destination parameter, specify the following destination:
cybertrace=tcp:[IP]:[port]:rfc3164Here,
[IP]is the IP address of the computer on which Feed Service is installed, and[port]is the port that Feed Service listens on for events (by default, the port9999is used). The IP address and port are the same as specified on the Settings > Service tab of Kaspersky CyberTrace Web. - For RSA NetWitness versions below 11.2:
- For the /decoder/config/logs.forwarding.destination parameter, specify the following destination:
cybertrace=tcp:[IP]:[port]Here,
[IP]is the IP address of the computer on which Feed Service is installed, and[port]is the port that Feed Service listens on for events (by default, the port9999is used). The IP address and port are the same as specified on the Settings > Service tab of Kaspersky CyberTrace Web. - In the EventDelimeter parameter, in the Feed Service configuration file, specify the
(\<\d+\>)value.
- For the /decoder/config/logs.forwarding.destination parameter, specify the following destination:
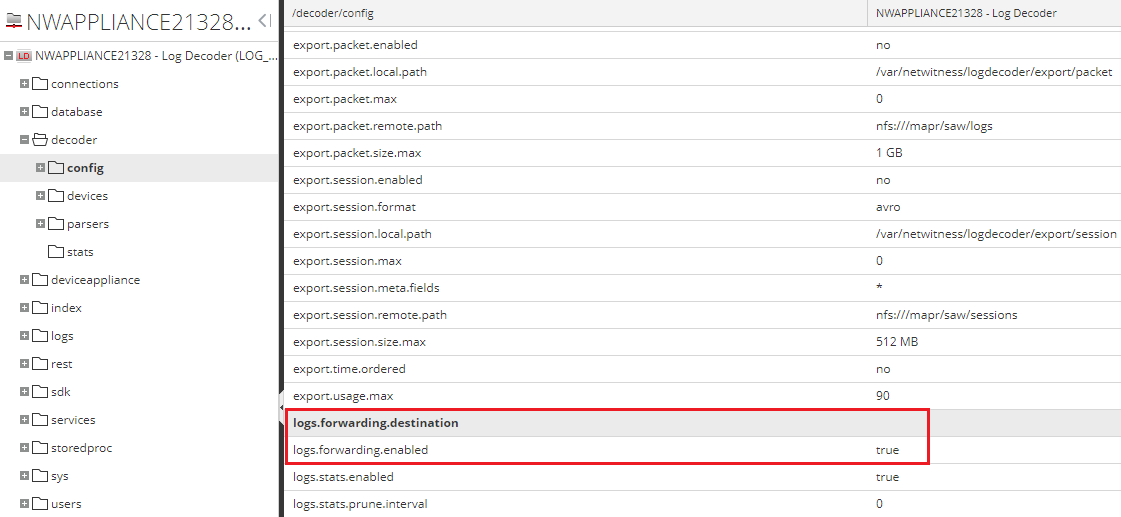
Log events forwarding settings
- For RSA NetWitness versions 11.2 and above:
- In the /decoder/config/logs.forwarding.enabled parameter, specify
true.
After these actions are performed, RSA NetWitness will forward the events that satisfy the cybertrace rule to the address that you specified in the logs.forwarding.destination parameter.
For more information on event forwarding, refer to https://community.rsa.com/t5/rsa-netwitness-platform-online/decoder-configure-syslog-forwarding-to-destination/ta-p/572084.
Page topStep 2. Sending events from Feed Service to RSA NetWitness
This section describes the actions to take so that Feed Service will send events to RSA NetWitness.
Note that Feed Service sends events to a Log Decoder service.
To send events from Feed Service to RSA NetWitness:
- In Kaspersky CyberTrace Web, on the Settings > Service tab, specify the following value for the Service sends events to text box:
[IP]:514Here
[IP]is the IP address of the Log Decoder service to which Feed Service will send events.If there are several Log Decoder services, perform the integration with only one of the Log Decoders.
- In
/etc/netwitness/ng/envision/etc/devicesdirectory of the computer on which Log Decoder runs, create acybertracesubdirectory and copy to the subdirectory the following files from the%service_dir%/integration/rsa/cybertracedirectory:- cybertrace.ini
This is a configuration file that contains declaration of Feed Service for RSA NetWitness.
- v20_cybertracemsg.xml
This is a configuration file that contains parsing rules for events that are sent from Feed Service to RSA NetWitness. See below in this section for a description of the contents.
You can find these files in the
integration/cybertracedirectory of the distribution kit. - cybertrace.ini
- Restart Log Decoder.
For this purpose, in the Services view, for the selected Log Decoder click the Settings split button (
) and from the drop-down list select Restart. - Make sure that the
cybertraceservice parser is turned on in RSA NetWitness.You can do this as follows:
- In the RSA NetWitness menu, select Administration > Services.
- In the Services grid, select the Log Decoder, and from the Actions menu, choose View > Config.
- In the Service Parsers Configuration panel, search for cybertrace, and ensure that the Config Value field in this row is selected.
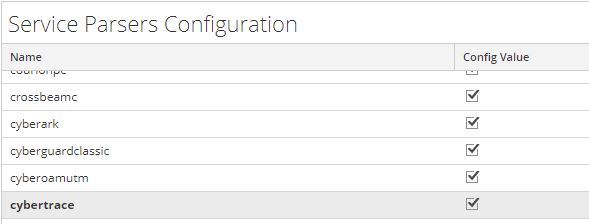
Service Parsers Configuration grid
- Restart Feed Service.
You can restart Feed Service by running the kl_feed_service script as follows:
systemctl restart cybertrace.serviceYou can do this by using Kaspersky CyberTrace Web too.
Contents of integration files
The v20_cybertracemsg.xml file contains the following rule for parsing service events from Feed Service:
alert=<action>,context=<msg> |
The v20_cybertracemsg.xml file contains several rules for parsing detection events from Feed Service:
- MATCH_EVENT:01—For parsing detection events when Botnet CnC URL Data Feed is involved in the detection process.
- MATCH_EVENT:02—For parsing detection events when Malicious URL Data Feed is involved in the detection process.
- MATCH_EVENT:03—For parsing detection events when Mobile Botnet CnC URL Data Feed is involved in the detection process.
- MATCH_EVENT:04—For parsing detection events when Malicious Hash Data Feed is involved in the detection process.
- MATCH_EVENT:05—For parsing detection events when Phishing URL Data Feed is involved in the detection process.
- MATCH_EVENT:06—For parsing detection events when Ransomware URL Data Feed or IoT URL Data Feed are involved in the detection process.
- MATCH_EVENT:07—For parsing detection events when IP Reputation Data Feed is involved in the detection process.
- MATCH_EVENT:08—For parsing detection events when Vulnerability Data Feed is involved in the detection process.
- MATCH_EVENT:09—For parsing detection events when Mobile Malicious Hash Data Feed is involved in the detection process.
- MATCH_EVENT:10—For parsing detection events when APT IP and URL feeds are involved in the detection process.
- MATCH_EVENT:11—For parsing detection events when Industrial Control Systems Data Feed is involved in the detection process.
- MATCH_EVENT:12—For parsing detection events when APT Hash feeds are involved in the detection process.
- MATCH_EVENT—For parsing detection events when other feeds are involved in the detection process.
The fields of the cybertrace.ini file and the v20_cybertracemsg.xml file correspond to the following format of service events and detection events from Feed Service:
<AlertFormat><![CDATA[<232>%CyberTrace:ALERT_EVENT alert=%Alert%,context=%RecordContext%]]></AlertFormat> <EventFormat><![CDATA[<232>%CyberTrace:MATCH_EVENT category=%Category%,detected=%MatchedIndicator%,url=%RE_URL%,hash=%RE_HASH%,dst=%DST_IP%,src=%SRC_IP%,dvc=%DeviceIp%,dev_name=%Device%,dev_action=%DeviceAction%,user=%UserName%,cnf=%Confidence%,actF:%ActionableFields%,context=%RecordContext%]]> </EventFormat> |
In the v20_cybertracemsg.xml file, the format of events from Feed Service is provided in the HEADER/content element and in the MESSAGE/content element. Make sure that the following fields are present in the index files of Log Decoder and Concentrator: virusname, url, checksum, and ip.src, ip.dst. As for the fields other than virusname, url, checksum, and ip.src, ip.dst in the MESSAGE/content element, you may or may not use them in the index files of Log Decoder and Concentrator. Also, make sure that the value of the flags attribute is None for each of these fields in the table-map-custom.xml file. If any of these conditions are not met, refer to the section about RSA NetWitness troubleshooting.
The following tables describe the fields used in the v20_cybertracemsg.xml and kl_feed_service.conf files, and describe how fields in one file correspond to fields in the other. If you want to constantly use some new field in detection events, contant your technical account manager (TAM).
- Fields of service events
Field in kl_feed_service.conf
Field in v20_cybertracemsg.xml
Description
<232>
-
Service string for RSA NetWitness.
%CyberTrace:
%CyberTrace:
Informs RSA NetWitness that an event is sent from Feed Service.
ALERT_EVENT
<messageid>
The event type.
-
<!payload>
Notifies RSA NetWitness that the event has additional information, the format of which is provided in the
MESSAGE/contentelement.%Alert%
<action>
The service event (for example, KL_ALERT_ServiceStarted).
%RecordContext%
<msg>
Context information about the service event.
- Fields of detection events
Field in kl_feed_service.conf
Field in v20_cybertracemsg.xml
Description
<232>
-
Service string for RSA NetWitness.
%CyberTrace:
%CyberTrace:
Informs RSA NetWitness that an event is sent from Feed Service.
MATCH_EVENT
<messageid>
The event type.
-
<!payload>
Notifies RSA NetWitness that the event has additional information, the format of which is provided in the
MESSAGE/contentelement.%Category%
<virusname>
Category of the detected object.
%MatchedIndicator%
<kl_detected_indicator%gt;
The detected indicator.
%RE_URL%
<url>
The URL specified in the event from RSA NetWitness.
%RE_HASH%
<checksum>
The hash specified in the event from RSA NetWitness.
%DST_IP%
<daddr>
The IP address to which the request is sent.
%SRC_IP%
<saddr>
The IP address from which the request is sent.
%DeviceIp%
<hostip>
The IP address from which the event is sent.
%Device%
<event_source>
The name of the device that has sent the event.
%DeviceAction%
<action>
The action that the device has performed.
%UserName%
<c_username>
The name of the user on whose account the action described in the event is performed.
%ActionableFields%
The fields' names are discussed below in this section.
Fields of the feed record involved in the detection process that are displayed apart from the context.
%RecordContext%
<fld1>
Context of the feed record that was involved in the detection process.
To view the contents of this field, open the event in RSA NetWitness and select the View Log tab.
%Confidence%
<kl_confidence>
The level of confidence in the indicators of the feed, in percent.
The following tables describe the actionable fields used in the feeds and in the v20_cybertracemsg.xml file, and describe how fields in a feed correspond to fields in the file:
- Botnet CnC URL Data Feed and Demo Botnet CnC URL Data Feed
Field in the feed
Field in v20_cybertracemsg.xml
mask
kl_mask
first_seen
kl_first_seen
last_seen
kl_last_seen
popularity
kl_popularity
threat
kl_threat
- Malicious Hash Data Feed and Demo Malicious Hash Data Feed
Field in the feed
Field in v20_cybertracemsg.xml
MD5
kl_md5
SHA1
kl_sha1
SHA256
kl_sha256
first_seen
kl_first_seen
last_seen
kl_last_seen
popularity
kl_popularity
file_type
kl_file_type
file_size
kl_file_size
threat
kl_threat
- IP Reputation Data Feed and Demo IP Reputation Data Feed
Field in the feed
Field in v20_cybertracemsg.xml
ip
kl_ip
first_seen
kl_first_seen
last_seen
kl_last_seen
popularity
kl_popularity
threat_score
kl_threat_score
category
kl_category
threat
kl_threat
- Malicious URL Data Feed
Field in the feed
Field in v20_cybertracemsg.xml
mask
kl_mask
first_seen
kl_first_seen
last_seen
kl_last_seen
popularity
kl_popularity
files/threat
kl_threat
category
kl_category
- Mobile Malicious Hash Data Feed
Field in the feed
Field in v20_cybertracemsg.xml
MD5
kl_md5
SHA1
kl_sha1
SHA256
kl_sha256
first_seen
kl_first_seen
last_seen
kl_last_seen
popularity
kl_popularity
threat
kl_threat
file_size
kl_file_size
- Phishing URL Data Feed
Field in the feed
Field in v20_cybertracemsg.xml
mask
kl_mask
first_seen
kl_first_seen
last_seen
kl_last_seen
popularity
kl_popularity
industry
kl_industry
- Vulnerability Data Feed
Field in the feed
Field in v20_cybertracemsg.xml
Date
kl_first_seen
AV Verdict
kl_verdict
When Vulnerability Data Feed is involved in a detection process, the
AV Verdictfield contains one of the following values:warninghighcritical
- Mobile Botnet CnC URL Data Feed
Field in the feed
Field in v20_cybertracemsg.xml
threat
kl_threat
- Ransomware URL Data Feed or IoT URL Data Feed
Field in the feed
Field in v20_cybertracemsg.xml
mask
kl_mask
first_seen
kl_first_seen
last_seen
kl_last_seen
popularity
kl_popularity
- APT IP and URL feeds
Field in the feed
Field in v20_cybertracemsg.xml
detection_date
kl_detect_date
publication_name
kl_pub_name
- APT Hash feeds
Field in the feed
Field in v20_cybertracemsg.xml
detection_date
kl_detect_date
publication_name
kl_pub_name
SHA1
kl_sha1
SHA256
kl_sha256
- Industrial Control Systems Data Feed
Field in the feed
Field in v20_cybertracemsg.xml
first_seen
kl_first_seen
popularity
kl_popularity
Step 3 (optional). Importing a meta group for browsing fields filled by Feed Service
This section describes how you can import the MetaGroups.jsn file. This file contains a meta group that you can use to browse only those fields in RSA NetWitness that are filled by Feed Service.
The Kaspersky CyberTrace distribution kit contains the integration/rsa/additional_elements/MetaGroups.jsn file. This file contains fields named kl.%field_name%. If you have not added the CyberTrace fields to RSA NetWitness (namely, to the table-map-custom.xml and index-concentrator-custom.xml files), we recommend that you import the MetaGroups_without_kl_fields.jsn file instead of MetaGroups.jsn.
To import the MetaGroups.jsn file:
- On the RSA NetWitness menu, select Investigation > Navigate.
- Select Meta > Manage Meta Groups.
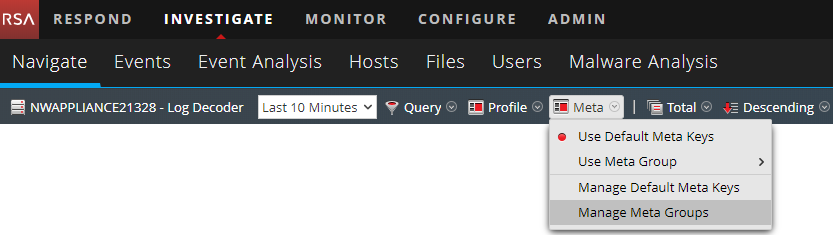
Manage Meta Groups command
- In the Manage Meta Groups window, click the Import button (
 ).
).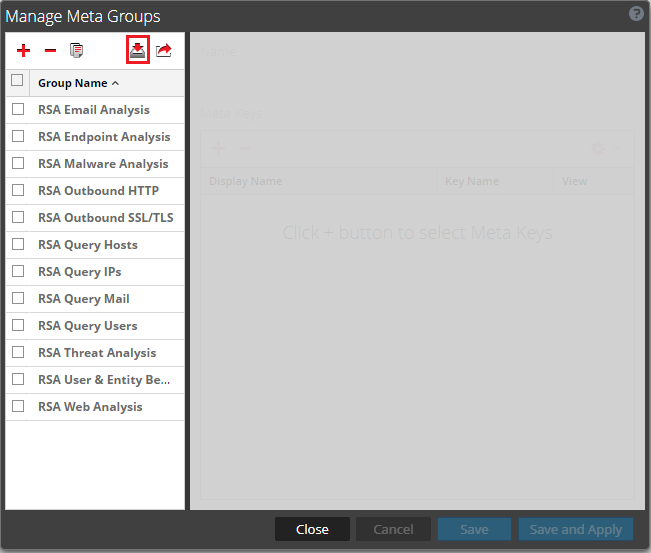
Manage Meta Groups window
- Select the MetaGroups.jsn file and click the Upload button (
 ).
). - Select the
CyberTrace_META_GROUPmeta group and click Save and Apply.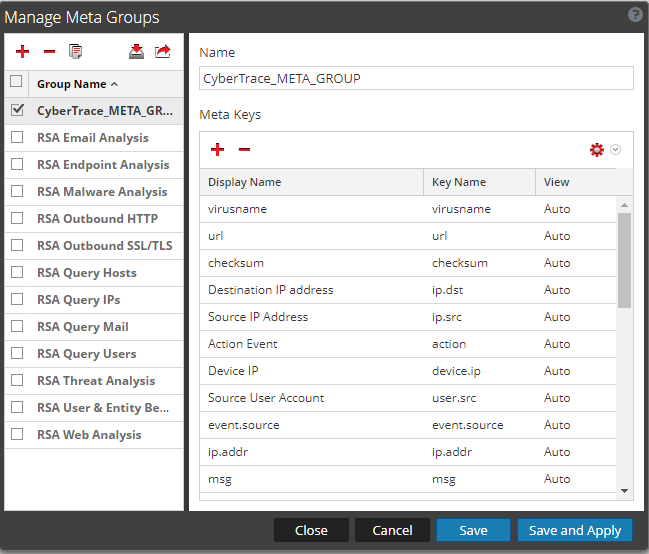
Adding a meta group
Step 4 (optional). Importing Feed Service rules to RSA NetWitness
The Kaspersky CyberTrace distribution kit contains the CyberTrace_Rules.zip file in the integration/rsa/additional_elements directory. This file contains a set of rules, which you can use to create reports, alerts, and dashboards.
To import the Feed Service rules to RSA NetWitness:
- On the RSA NetWitness menu, select Dashboard > Reports.
In RSA NetWitness 11, you select Monitor > Reports instead.
- Click the Settings split button () and select Import.
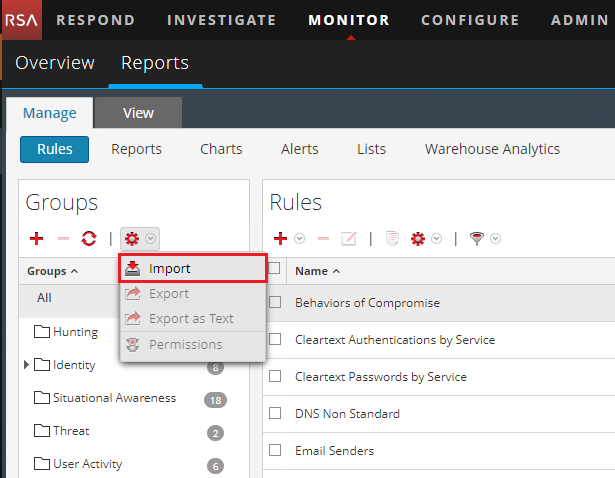
Importing rules
- Choose the CyberTrace_Rules.zip file.
- In the Import Rule window, select the Rule check box and the List check box.
If you import the CyberTrace_Rules.zip file for the first time, you may leave these check boxes cleared.
- Click the Import button.
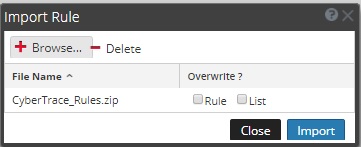
Importing Feed Service rules
The rules imported to RSA NetWitness are listed in the table below.
Rule |
Description |
CyberTrace Detect Botnet |
Selects those detection events from Feed Service that have the Botnet category. The following fields are selected:
|
CyberTrace Detect Malware Hash |
Selects hash detection events from Feed Service. The following fields are selected:
|
CyberTrace Detect Malware IP |
Selects IP address detection events from Feed Service. The following fields are selected:
|
CyberTrace Detect Malware URL |
Selects URL detection events from Feed Service. The following fields are selected:
|
CyberTrace Detect Stat |
Selects all the categories involved in the detection process. The following fields are selected:
|
CyberTrace Service events |
Selects service events from Feed Service. The following fields are selected:
|
CyberTrace Top 10 IP |
Selects Top 10 detected IP addresses. The following fields are selected:
|
CyberTrace Top 10 URL |
Selects Top 10 detected URLs. The following fields are selected:
|
CyberTrace Top 10 Hash |
Selects Top 10 detected hashes. The following fields are selected:
|
CyberTrace Detected users |
Calculates the number of detection events per user. |
Step 5 (optional). Importing a preconfigured report to RSA NetWitness
This section explains how to import a preconfigured report to RSA NetWitness. To learn how to create a report manually, see the section about creating and viewing reports in RSA NetWitness.
This step requires the importing Feed Service rules step to be completed.
The distribution kit contains the CyberTrace_Reports.zip file. This file contains a preconfigured report, CyberTrace Report.
The CyberTrace Report report contains the following data:
- Detection statistics during the last 24 hours
- Statistics on users who issued detection events during the last 24 hours
- Top 10 URLs, Top 10 IP addresses, and Top 10 Hashes during the last 24 hours
You can import this file in the same way that you import the CyberTrace_Rules.zip file (which contains rules). After the report is imported, you must specify the data source.
To specify the data source for the "CyberTrace Report" report:
- On the RSA NetWitness menu, select Dashboard > Reports. (In RSA NetWitness 11, select Monitor > Reports.)
The Manage tab is displayed.
- Click Reports.
The Reports view is displayed.
- In the Reports view, in the Actions column, click the Settings split button () for the
CyberTrace Reportreport, and then select Schedule Report.The Schedule Report form appears.
- In the Schedule Report form, specify the following data:
- Schedule name
- Data source (database from the NetWitness DB drop-down list)
Select either the Concentrator that receives events from Feed Service or the Log Decoder that stores events from Feed Service.
- Click the Schedule button.
Step 6 (optional). Importing preconfigured charts and a dashboard to RSA NetWitness
This section describes how you can import preconfigured charts and a dashboard to RSA NetWitness.
This step requires importing Feed Service rules step to be completed.
Importing preconfigured charts
The distribution kit contains the CyberTrace_Charts.zip file. The CyberTrace_Charts.zip file contains preconfigured charts. These charts are used in a preconfigured dashboard.
You can import the CyberTrace_Charts.zip file in the same way as CyberTrace_Rules.zip, which contains rules.
After the CyberTrace_Charts.zip file is imported, specify the data source for each chart (specify either the Concentrator that receives events from Feed Service or the Log Decoder that stores events from Feed Service). To do this, for each chart click the Actions split button () and select Edit. Then in the Data Source field specify the data source and click Save.
Also, enable each chart: select the check boxes next to the chart names (or you can select the check box next to the Enabled column heading) and then click the Enable button ( ).
).
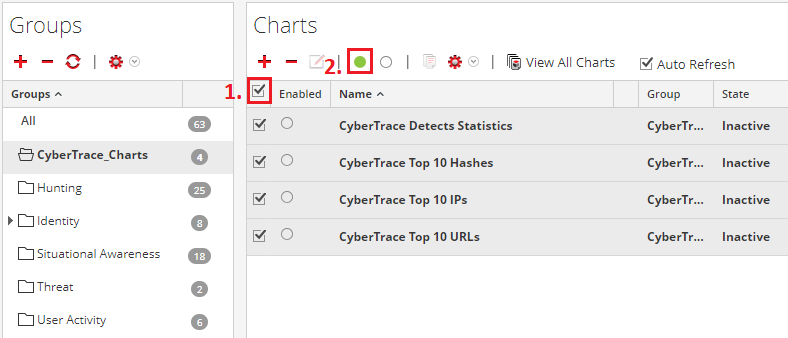
Enabling charts
Importing the Kaspersky CyberTrace dashboard
The distribution kit also contains the Kaspersky+CyberTrace.cfg file. This file contains a preconfigured dashboard, Kaspersky CyberTrace.
You can import the Kaspersky+CyberTrace.cfg file by clicking the Settings split button () in the Dashboard form and selecting Import. A dashlet form appears in the Dashboard form. After the CFG file is imported, configure the following dashlets: CyberTrace Detects Statistic, CyberTrace Top 10 URL, CyberTrace Top 10 Hash, and CyberTrace Top 10 IP.
The import instructions above are relevant for RSA NetWitness version 10.6. To import the Kaspersky CyberTrace.zip file in RSA NetWitness version 11.0, click the Import dashboard button ( ).
).
Step 7. Performing the verification test (RSA NetWitness)
After you configure Kaspersky CyberTrace and RSA NetWitness, you can test their performance.
Please make sure you perform the verification test before editing any filtering rules in the Feed Utility configuration file.
To check whether Kaspersky CyberTrace is correctly integrated with RSA NetWitness:
- Configure Log Scanner to send events to the IP address and port that Feed Service listens on.
For this purpose, in the
Connectionelement of the Log Scanner configuration file, specify the IP address and port that are set for outbound events on the Settings > Service tab of Kaspersky CyberTrace Web. - Send the
kl_verification_test_cef.txtfile from the verification directory to Feed Service by using Log Scanner.For this purpose, run the following command:
In Linux:
./log_scanner -p ../verification/kl_verification_test_cef.txtIn Windows:
log_scanner.exe -p ..\verification\kl_verification_test_cef.txtDo not specify the
-rflag in this command: send the test results to the SIEM solution by using the parameters for outbound events specified on the Settings > Service tab of Kaspersky CyberTrace. - Make sure that you obtain the test results according to the table below.
You can view the test results in the same way as when browsing Feed Service events in RSA NetWitness.
Verification test results
The verification test results depends on the feeds you use. The verification test results are listed in the following table.
Verification test results
Feed used |
Detected objects |
Malicious URL Data Feed |
http://fakess123.nu http://badb86360457963b90faac9ae17578ed.com |
Phishing URL Data Feed |
http://fakess123ap.nu http://e77716a952f640b42e4371759a661663.com |
Botnet CnC URL Data Feed |
http://fakess123bn.nu http://a7396d61caffe18a4cffbb3b428c9b60.com |
IP Reputation Data Feed |
192.0.2.0 192.0.2.3 |
Malicious Hash Data Feed |
FEAF2058298C1E174C2B79AFFC7CF4DF 44D88612FEA8A8F36DE82E1278ABB02F (stands for EICAR Standard Anti-Virus Test File) C912705B4BBB14EC7E78FA8B370532C9 |
Mobile Malicious Hash Data Feed |
60300A92E1D0A55C7FDD360EE40A9DC1 |
Mobile Botnet CnC URL Data Feed |
001F6251169E6916C455495050A3FB8D (MD5 hash) sdfed7233dsfg93acvbhl.su/steallallsms.php (URL mask) |
Ransomware URL Data Feed |
http://fakess123r.nu http://fa7830b4811fbef1b187913665e6733c.com |
Vulnerability Data Feed |
D8C1F5B4AD32296649FF46027177C594 |
APT URL Data Feed |
http://b046f5b25458638f6705d53539c79f62.com |
APT Hash Data Feed |
7A2E65A0F70EE0615EC0CA34240CF082 |
APT IP Data Feed |
192.0.2.4 |
IoT URL Data Feed |
http://e593461621ee0f9134c632d00bf108fd.com/.i |
Demo Botnet CnC URL Data Feed |
http://5a015004f9fc05290d87e86d69c4b237.com http://fakess123bn.nu |
Demo IP Reputation Data Feed |
192.0.2.1 192.0.2.3 |
Demo Malicious Hash Data Feed |
776735A8CA96DB15B422879DA599F474 FEAF2058298C1E174C2B79AFFC7CF4DF 44D88612FEA8A8F36DE82E1278ABB02F |
ICS Hash Data Feed |
7A8F30B40C6564EFF95E678F7C43346C |
Integration with LogRhythm
This chapter describes how to integrate Kaspersky CyberTrace with LogRhythm.
The actions described in these sections must be performed in LogRhythm Console under a user account that has administrator privileges.
To integrate LogRhythm with Kaspersky CyberTrace:
- Add the Kaspersky CyberTrace log source type to LogRhythm.
- Import files with Kaspersky CyberTrace rules.
- Optionally, add Kaspersky CyberTrace events to LogRhythm.
- Optionally, add Kaspersky CyberTrace rules to LogRhythm.
- Add a Kaspersky CyberTrace policy to LogRhythm.
- Accept the Kaspersky CyberTrace log source in LogRhythm.
- Configure LogRhythm to forward logs to Kaspersky CyberTrace.
- Optionally, perform the verification test.
- Optionally, create alerts about incoming Kaspersky CyberTrace service events.
- Optionally, configure LogRhythm to display alert events.
Step 1. Adding a Custom Log Source type
This section describes how you can add the Kaspersky CyberTrace log source type to LogRhythm.
To add the Kaspersky CyberTrace log source type to LogRhythm:
- Run LogRhythm Console.
- Select Deployment Manager > Tools > Knowledge > Log Source Type Manager.
The Log Source Type Manager window opens.
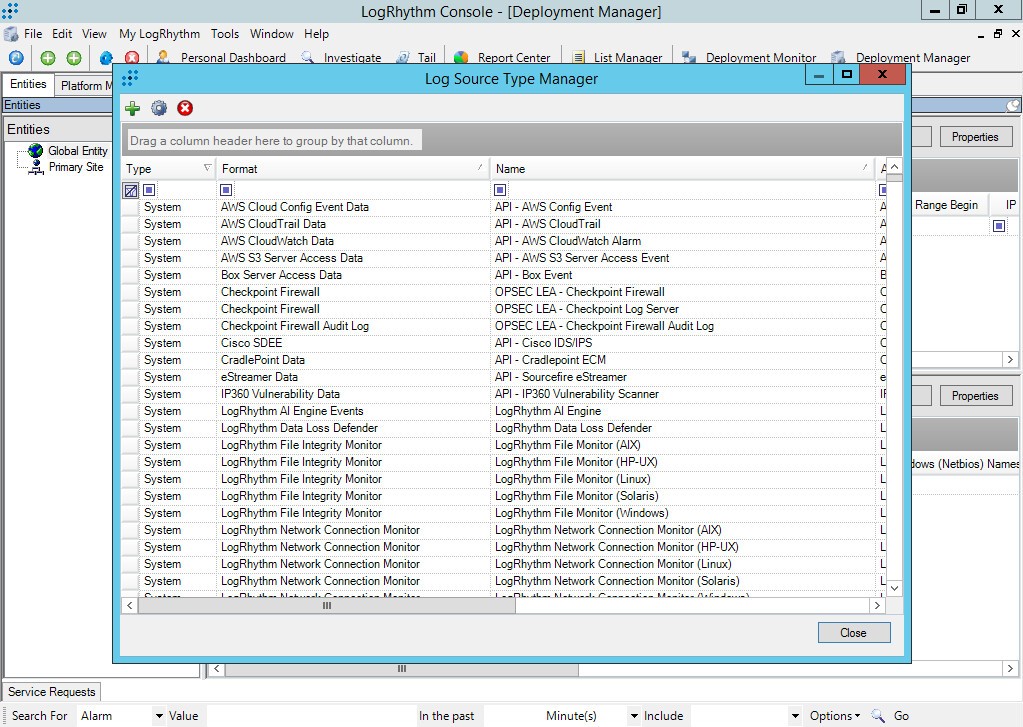
Log Source Type Manager window
- Click the New button (
 ).
). - In the Log Source Type Properties window that opens, enter the following data:
Field
Data
Name
Kaspersky CyberTrace
Full Name
Kaspersky CyberTrace
Abbreviation
CyberTrace
Log Format
Syslog
Brief Description
Kaspersky CyberTrace is an application set that allows you to check URLs, IP addresses, and hashes of files contained in events that arrive in a SIEM software product.
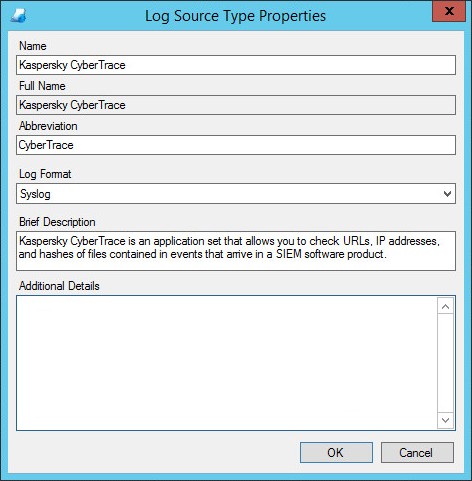
Log Source Type Properties window
We recommend specifying a source name as well as in the Name field from the table above. Otherwise, importing Kaspersky CyberTrace rules and events will be performed incorrectly. In this case, you must add Kaspersky CyberTrace events and corresponding MPE rules manually, as described in step 3 and step 4 (make sure to specify the log source name similar to the name that you entered in the Log Source Type Properties window).
- Click OK.
The new log source type will appear in the Log Source Type Manager window.
- Make a note of the value in the Log Source Type ID column. You will need it further in step 2 for importing Kaspersky CyberTrace rules and events.
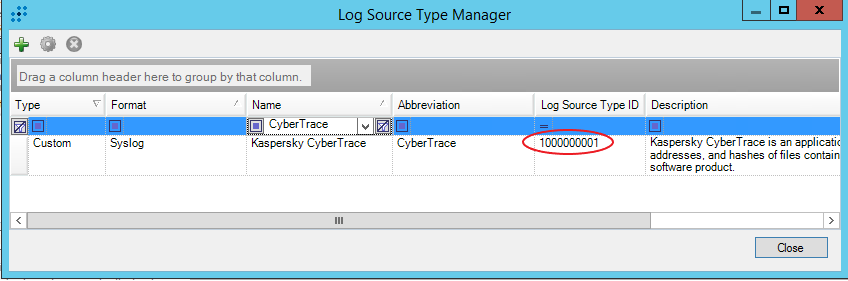
Kaspersky CyberTrace log source type
Step 2. Importing Kaspersky CyberTrace rules and events
This section describes how you can import files that contain Kaspersky CyberTrace rules and events to LogRhythm.
If for any reason the import fails, you can configure adding Kaspersky CyberTrace events and Kaspersky CyberTrace rules manually.
To import files with Kaspersky CyberTrace rules to LogRhythm:
- For each file of the
mperule_%event_name%.xmlformat from theintegration/logrhythm/events/directory, perform the following actions:- Open the file in a text editor.
- Replace the values of both the
MPERuleToMST > MsgSourceTypeIDand theMsgSourceType > MsgSourceTypeIDelements with the log source type ID, you have made a note of in the previous step.For example,
<MsgSourceTypeID>1000000001</MsgSourceTypeID>must change to<MsgSourceTypeID>%CYBERTRACE_ID%</MsgSourceTypeID>, where%CYBERTRACE_ID%stands for the log source type ID of Kaspersky CyberTrace. - Save the file.
- Open LogRhythm Console.
- Select Deployment Manager > Tools > Knowledge > MPE Rule Builder.
The Rule Builder form opens.
- For each file edited in step 1 above, perform the following actions:
- Select File > Import.
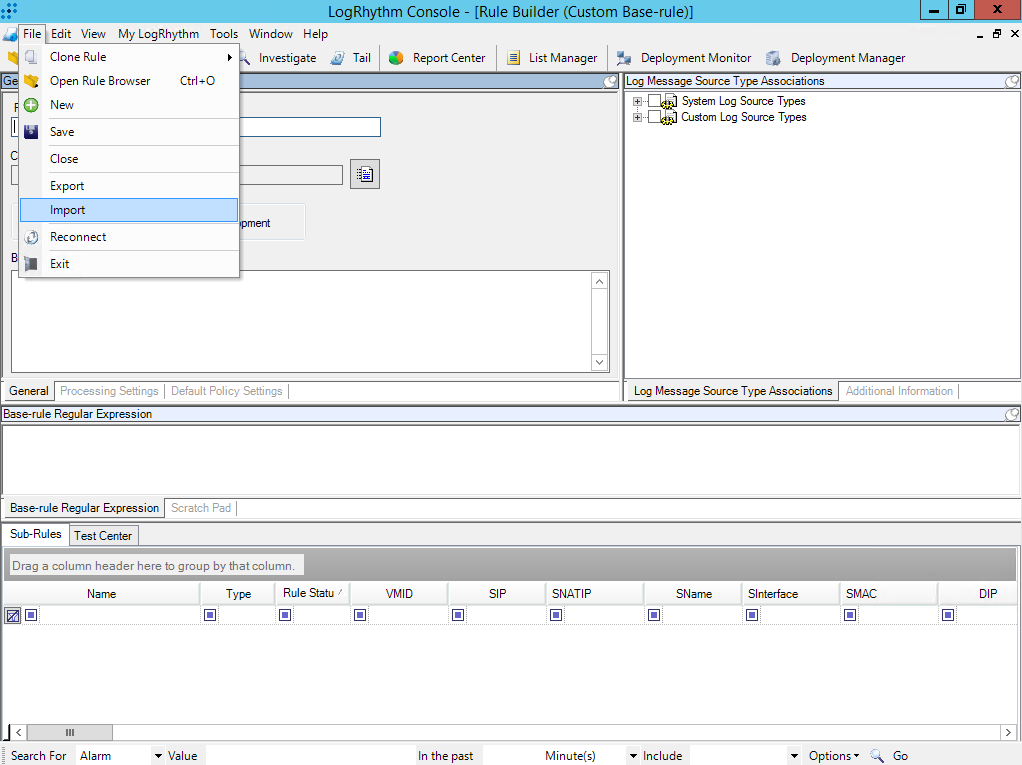
- In the Import Actions window, click Yes.
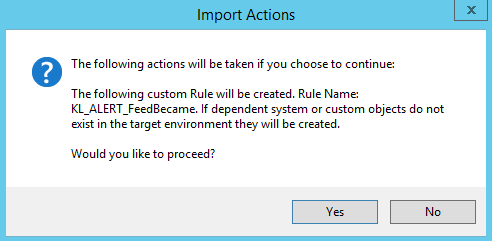
If the import succeeds, the Rule Import Status window opens.
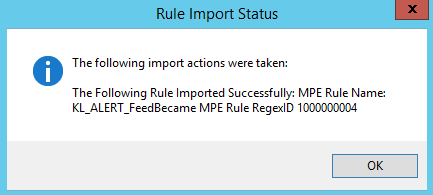
- On the toolbar of the Rule Builder form, click the Open rule library (
 ) button.
The Rule Browser window opens.
- Double-click the event that was imported in step b.
A window with rule settings opens.
Note that the imported rule arrives in LogRhythm in the
Developmentstatus and may not appear in the list of all rules. You can configure display in the Rule Browser window that opens by selecting View > Show Development rules.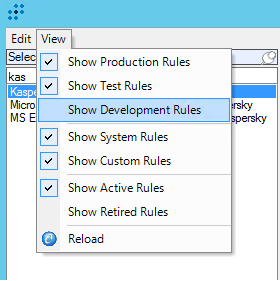
- In the General settings window that opens, in the Rule Status section, select Production or Test.
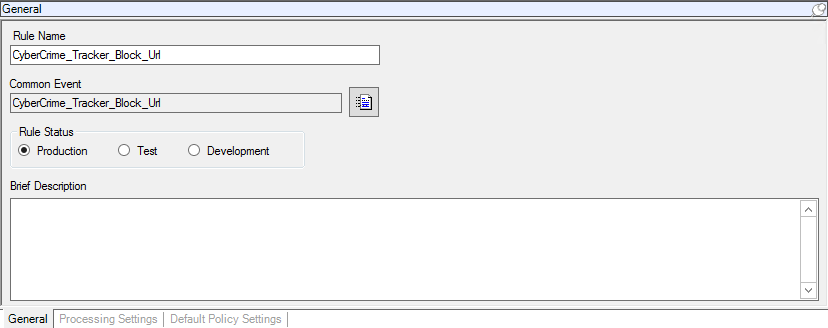
- Click Save.
The corresponding common events and MPE Rules will be added to LogRhythm for all events. The full list of the events is described in the section about adding Kaspersky CyberTrace events. The full list of MPE rules and their settings is described in the section about adding Kaspersky CyberTrace rules.
- Select File > Import.
Some of the imported Kaspersky CyberTrace events might have a low Risk Rating according to the LogRhythm classification. Depending on the filters configuration, LogRhythm might ignore such events. Please check the classification and make sure that the Risk Rating of imported events allows LogRhythm to accept and process them correctly.
Page topStep 3 (optional). Adding Kaspersky CyberTrace events
This section describes how you can add Kaspersky CyberTrace events to LogRhythm manually.
Skip this step, if the importing of Kaspersky CyberTrace rules and events succeeds.
To add Kaspersky CyberTrace events to LogRhythm:
- Run LogRhythm Console.
- Select Deployment Manager > Tools > Knowledge > Common Event Manager.
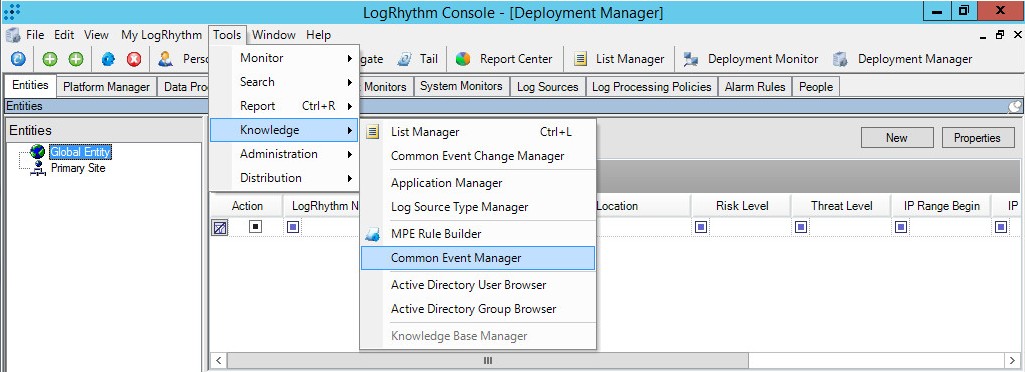
Common Event Manager menu item
The Common Event Manager window opens.
- Add the events provided in the tables below. If you do not use all commercial and OSINT feeds, some of the events might not be necessary.
- Events of the
"Security : Compromise"classification
Event
Description
KL_APT_Hash_MD5
Hash of a malicious file used in an APT campaign is detected by Kaspersky CyberTrace.
KL_APT_Hash_SHA1
Hash of a malicious file used in an APT campaign is detected by Kaspersky CyberTrace.
KL_APT_Hash_SHA256
Hash of a malicious file used in an APT campaign is detected by Kaspersky CyberTrace.
KL_APT_IP
IP address used in an APT campaign is detected by Kaspersky CyberTrace.
KL_APT_URL
URL used in an APT campaign is detected by Kaspersky CyberTrace.
KL_BotnetCnC_Hash_MD5
Botnet hash is detected by Kaspersky CyberTrace.
KL_BotnetCnC_Hash_SHA1
Botnet hash is detected by Kaspersky CyberTrace.
KL_BotnetCnC_Hash_SHA256
Botnet hash is detected by Kaspersky CyberTrace.
KL_BotnetCnC_URL
Botnet C&C URL is detected by Kaspersky CyberTrace.
KL_Exploit_Hash_MD5
Hash of exploit is detected by Kaspersky CyberTrace.
KL_Exploit_Hash_SHA1
Hash of exploit is detected by Kaspersky CyberTrace.
KL_Exploit_Hash_SHA256
Hash of exploit is detected by Kaspersky CyberTrace.
KL_ICS_Hash_MD5
ICS hash is detected by Kaspersky CyberTrace.
KL_ICS_Hash_SHA1
ICS hash is detected by Kaspersky CyberTrace.
KL_ICS_Hash_SHA256
ICS hash is detected by Kaspersky CyberTrace.
KL_InternalTI_URL
URL of the InternalTI list of Kaspersky CyberTrace.
KL_InternalTI_IP
IP of the InternalTI list of Kaspersky CyberTrace.
KL_InternalTI_Hash_MD5
Hash of the InternalTI list of Kaspersky CyberTrace.
KL_InternalTI_Hash_SHA1
Hash of the InternalTI list of Kaspersky CyberTrace.
KL_InternalTI_Hash_SHA256
Hash of the InternalTI list of Kaspersky CyberTrace.
KL_IoT_Hash_MD5
Hash of IoT is detected by Kaspersky CyberTrace.
KL_IoT_Hash_SHA1
Hash of IoT is detected by Kaspersky CyberTrace.
KL_IoT_Hash_SHA256
Hash of IoT is detected by Kaspersky CyberTrace.
KL_IoT_URL
URL that infects Internet of Things-enabled (IoT) devices is detected by Kaspersky CyberTrace.
KL_IP_Reputation
Malicious or suspicious IP address is detected by Kaspersky CyberTrace.
KL_IP_Reputation_Hash_MD5
Hash of a file hosted on a malicious or suspicious IP address is detected by Kaspersky CyberTrace.
KL_IP_Reputation_Hash_SHA1
Hash of a file hosted on a malicious or suspicious IP address is detected by Kaspersky CyberTrace.
KL_IP_Reputation_Hash_SHA256
Hash of a file hosted on a malicious or suspicious IP address is detected by Kaspersky CyberTrace.
KL_Malicious_URL
Malicious URL is detected by Kaspersky CyberTrace.
KL_Malicious_URL_Hash_MD5
Hash of a file hosted on a malicious URL is detected by Kaspersky CyberTrace.
KL_Malicious_URL_Hash_SHA1
Hash of a file hosted on a malicious URL is detected by Kaspersky CyberTrace.
KL_Malicious_URL_Hash_SHA256
Hash of a file hosted on a malicious URL is detected by Kaspersky CyberTrace.
KL_Malicious_Hash_MD5
Malicious hash is detected by Kaspersky CyberTrace.
KL_Malicious_Hash_SHA1
Malicious hash is detected by Kaspersky CyberTrace.
KL_Malicious_Hash_SHA256
Malicious hash is detected by Kaspersky CyberTrace.
KL_Mobile_Malicious_Hash_MD5
Mobile malicious hash is detected by Kaspersky CyberTrace.
KL_Mobile_Malicious_Hash_SHA1
Mobile malicious hash is detected by Kaspersky CyberTrace.
KL_Mobile_Malicious_Hash_SHA256
Mobile malicious hash is detected by Kaspersky CyberTrace.
KL_Mobile_BotnetCnC_Hash_MD5
Mobile botnet C&C hash is detected by Kaspersky CyberTrace.
KL_Mobile_BotnetCnC_Hash_SHA1
Mobile botnet C&C hash is detected by Kaspersky CyberTrace.
KL_Mobile_BotnetCnC_Hash_SHA256
Mobile botnet C&C hash is detected by Kaspersky CyberTrace.
KL_Mobile_BotnetCnC_URL
Mobile botnet C&C URL is detected by Kaspersky CyberTrace.
KL_Phishing_URL
Phishing URL is detected by Kaspersky CyberTrace.
KL_Ransomware_URL
URL that hosts ransomware is detected by Kaspersky CyberTrace.
KL_Ransomware_URL_Hash_MD5
Hash of ransomware is detected by Kaspersky CyberTrace.
KL_Ransomware_URL_Hash_SHA1
Hash of ransomware is detected by Kaspersky CyberTrace.
KL_Ransomware_URL_Hash_SHA256
Hash of ransomware is detected by Kaspersky CyberTrace.
KL_Vulnerable_File_Hash_MD5
Hash of vulnerable software and related exploits is detected by Kaspersky CyberTrace.
KL_Vulnerable_File_Hash_SHA1
Hash of vulnerable software and related exploits is detected by Kaspersky CyberTrace.
KL_Vulnerable_File_Hash_SHA256
Hash of vulnerable software and related exploits is detected by Kaspersky CyberTrace.
AbuseCh_Feodo_Block_IP
IP address from the Abuse.Ch_Feodo_Block_IP feed is detected by Kaspersky CyberTrace.
AbuseCh_Ransomware_Block_URL
URL from the Abuse.Ch_Ransomware_Block_URL feed is detected by Kaspersky CyberTrace.
AbuseCh_Ransomware_Block_Domain
Domain from the Abuse.Ch_Ransomware_Block_Domain feed is detected by Kaspersky CyberTrace.
AbuseCh_Ransomware_Block_IP
IP address from the Abuse.Ch_Ransomware_Block_IP feed is detected by Kaspersky CyberTrace.
AbuseCh_Ransomware_Common_URL
URL from the Abuse.Ch_Ransomware_Common_URL feed is detected by Kaspersky CyberTrace.
AbuseCh_SSL_Certificate_Block_IP
IP address from the AbuseCh_SSL_Certificate_Block_IP feed is detected by Kaspersky CyberTrace.
AbuseCh_SSL_Certificate_Hash_SHA1
Hash from the AbuseCh_SSL_Certificate_Hash_SHA1 feed is detected by Kaspersky CyberTrace.
BlocklistDe_Block_IP
IP from the BlocklistDe_Block_IP feed is detected by Kaspersky CyberTrace.
CyberCrime_Tracker_Block_Url
URL from the CyberCrime_Tracker_Block_Url feed is detected by Kaspersky CyberTrace.
EmergingThreats_Block_IP
IP address from the EmergingThreats_Block_IP feed is detected by Kaspersky CyberTrace.
EmergingThreats_Compromised_IP
IP address from the EmergingThreats_Compromised_IP feed is detected by Kaspersky CyberTrace.
- Alert events:
Event
Description
Classification
KL_ALERT_ConfigurationUpdated
This event is generated if Feed Service has reloaded the configuration file.
Audit : Configuration
KL_ALERT_FeedBecameAvailable
This event is generated if a feed that can be used with the current certificate has become available.
Audit : Other Audit Success
KL_ALERT_FeedBecameUnavailable
This event is generated if a feed that is being used with the current certificate has become unavailable.
Audit : Other Audit Failure
KL_ALERT_OutdatedFeed
This event is generated if a feed has not been updated during the specified period.
Audit : Other Audit Failure
KL_ALERT_ServiceUnavailable
This event is generated when the watchdog module has detected that Feed Service has crashed or frozen.
Audit : Other Audit Failure
KL_ALERT_ServiceStopped
This event is generated when Feed Service is stopped successfully.
Audit : Startup and Shutdown
KL_ALERT_ServiceStarted
This event is generated when Feed Service is started successfully.
Audit : Startup and Shutdown
KL_ALERT_UpdatedFeed
This event is generated when a feed is updated and loaded by Feed Service.
Audit : Other Audit Success
KL_ALERT_FailedToUpdateFeed
This event is generated when Feed Service fails to load a new feed (for example, due to the limitation on the number of indicators that is imposed by the license key) and continues using an old feed.
Audit : Other Audit Failure
KL_ALERT_LicenseExpires
This event is generated to inform you that the license key that is being used will expire in less than 30 days.
Audit : Policy
KL_ALERT_LicenseExpired
This event is generated when your license key has expired.
Audit : Policy
KL_ALERT_EPSLimitExceeded
This event is generated when the limit on the number of processed events per second (EPS) imposed by the licensed key or licensing level has been exceeded.
Audit : Policy
KL_ALERT_EPSHardLimit
This event is generated when Feed Service limits the number of events processed per second (EPS) to the maximum number of events for the current license key or licensing level. The limit applies regardless of the number of incoming events.
Audit : Policy
KL_ALERT_LicenseChanged
This event is generated when Kaspersky CyberTrace starts to use another license key or licensing level.
Audit : Configuration
KL_ALERT_RetroScanError
This event is generated when the retrospective scan task failed.
Audit : Other Audit Failure
KL_ALERT_RetroScanCompleted
This event is generated when the retrospective scan task succeeded.
Audit : Other Audit Success
KL_ALERT_RetroScanStorageExceeded
This event is generated when the limit on the size of the saved events has been exceeded.
Audit : Policy
KL_ALERT_IndicatorsStoreLimitExceeded
This event is generated when the limit on the size of the saved indicators has been exceeded.
Audit : Policy
KL_ALERT_IndicatorsStoreHardLimit
This event is generated when Kaspersky CyberTrace limits adding and updating of indicators.
Audit : Policy
KL_ALERT_FreeSpaceEnds
This event is generated when the available disk space becomes low.
Audit : Policy
Alert events may contain context fields, as described in the section about the alert events of Kaspersky CyberTrace.
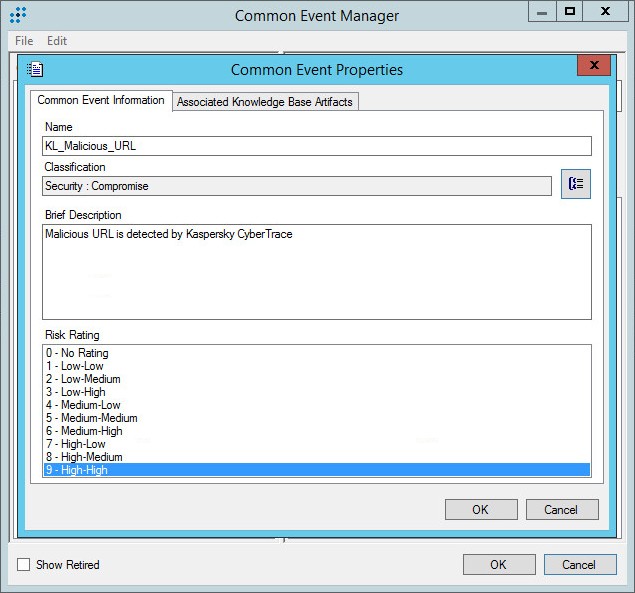
Common Event Properties window
- Events of the
After the events are added, the Common Event Manager window must contain the events as shown in the figure below.
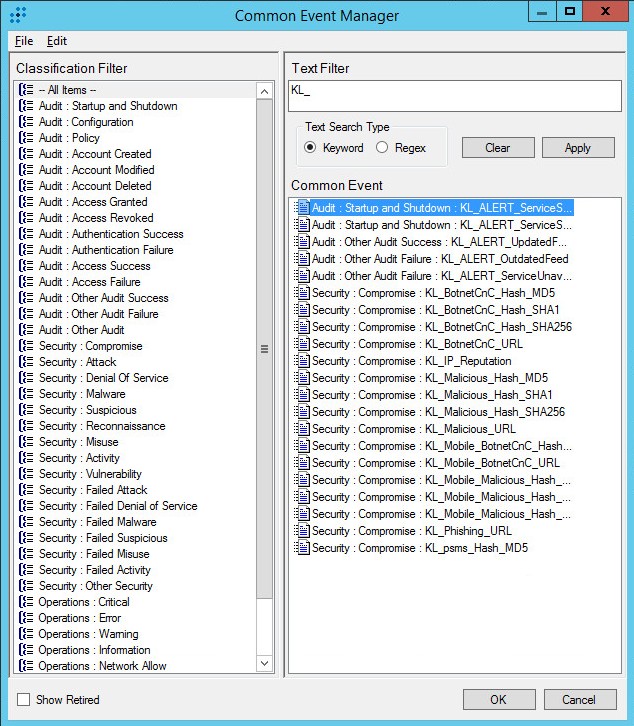
Added events
Page topStep 4 (optional). Adding Kaspersky CyberTrace rules
This section describes how you can add Kaspersky CyberTrace rules to LogRhythm manually.
Skip this step, if importing Kaspersky CyberTrace rules and events succeeds.
To add Kaspersky CyberTrace rules to LogRhythm:
- Run LogRhythm Console.
- Select Deployment Manager > Tools > Knowledge > MPE Rule Builder.
The Rule Builder form opens.
- For every event, add a rule by clicking the Create a new rule button (
 ).
).For every rule do the following:
- In the General section, click the button next to the Common Event box and select the required event.
The event will be displayed in the box.
- In the Log Message Source Type Associations section, specify
Kaspersky CyberTraceas the log source type. - To set the rule status, select the Production or Test radio button.
When creating regular expressions (in the Base-rule Regular Expressions section), follow the instructions provided in the LogRhythm Help section "Use MPE Rule Builder - Parsing Fields and Tags".
We recommend that you use the regular expressions provided in the table below.
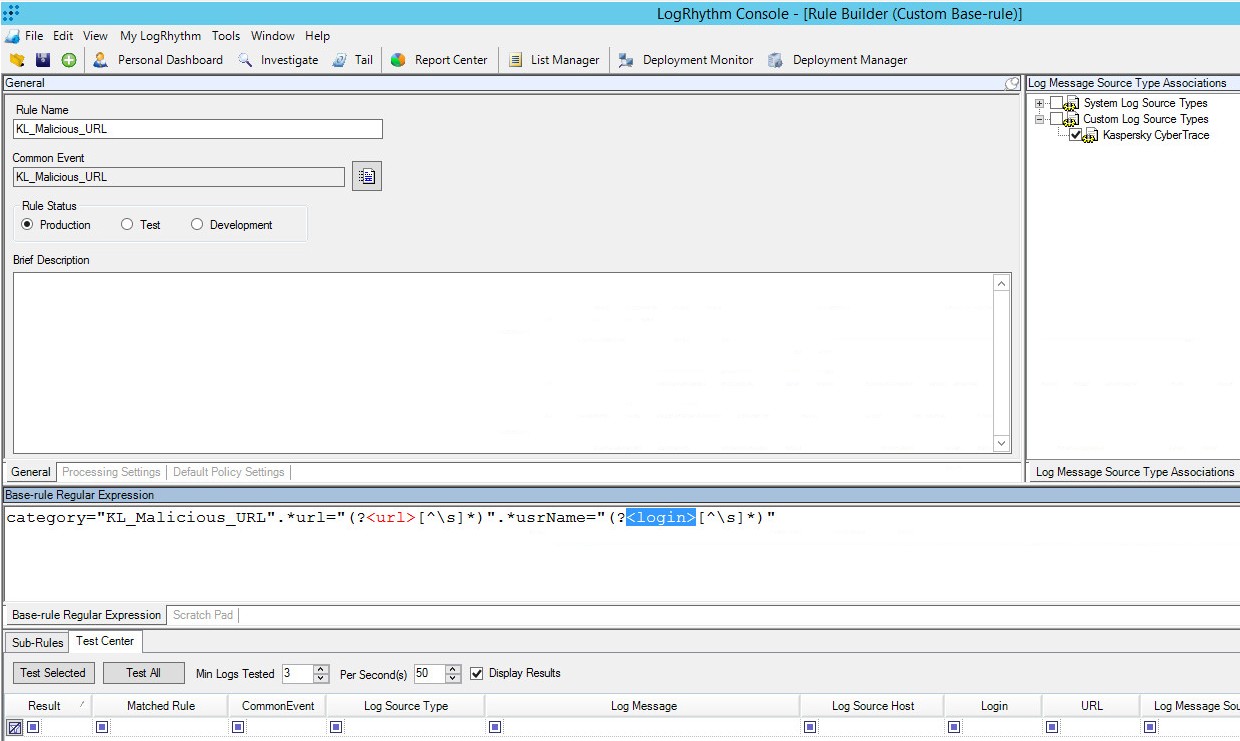
Rule Builder form
- In the General section, click the button next to the Common Event box and select the required event.
The following list contains regular expressions for each event. If you want to use other regular expressions, use the example events from the second column of the table to check the regular expressions of your choice.
- AbuseCh_Feodo_Block_IP
Regular expression
Event example for checking regular expressions
category=AbuseCh_Feodo_Block_IP.*ip=(?<object>[^\s]*).*usrName=(?<login>[^\s]*)May 2 16:41:40 category=AbuseCh_Feodo_Block_IP matchedIndicator=103.11.83.52 url=- src=- ip=103.11.83.52 md5=- sha1=- sha256=- usrName=VerifTestUserName ip=103.11.83.52 source=https://feodotracker.abuse.ch/downloads/ipblocklist.txt - AbuseCh_Ransomware_Block_URL
Regular expression
Event example for checking regular expressions
category=AbuseCh_Ransomware_Block_URL.*url=(?<url>[^\s]*).*usrName=(?<login>[^\s]*)May 2 16:41:40 category=AbuseCh_Ransomware_Block_URL matchedIndicator=00005ik.rcomhost.com/7fg3g url=00005ik.rcomhost.com/7fg3g src=- ip=- md5=- sha1=- sha256=- usrName=- source=https://ransomwaretracker.abuse.ch/downloads/RW_URLBL.txt url=00005ik.rcomhost.com/7fg3g - AbuseCh_Ransomware_Block_Domain
Regular expression
Event example for checking regular expressions
category=AbuseCh_Ransomware_Block_Domain.*url=(?<url>[^\s]*).*usrName=(?<login>[^\s]*)May 2 16:41:40 category=AbuseCh_Ransomware_Block_Domain matchedIndicator=pagaldaily.com url=pagaldaily.com src=- ip=- md5=- sha1=- sha256=- usrName=- domain=pagaldaily.com source=https://ransomwaretracker.abuse.ch/downloads/RW_DOMBL.txt - AbuseCh_Ransomware_Block_IP
Regular expression
Event example for checking regular expressions
category=AbuseCh_Ransomware_Block_IP.*ip=(?<object>[^\s]*).*usrName=(?<login>[^\s]*)May 2 16:41:40 category=AbuseCh_Ransomware_Block_IP matchedIndicator=83.217.11.193 url=- src=- ip=83.217.11.193 md5=- sha1=- sha256=- usrName=VerifTestUserName ip=83.217.11.193 source=https://ransomwaretracker.abuse.ch/downloads/RW_IPBL.txt - AbuseCh_Ransomware_Common_URL
Regular expression
Event example for checking regular expressions
category=AbuseCh_Ransomware_Common_URL.*url=(?<url>[^\s]*).*usrName=(?<login>[^\s]*)May 2 16:41:40 category=AbuseCh_Ransomware_Common_URL matchedIndicator=83.217.11.193/linuxsucks.php url=83.217.11.193/linuxsucks.php src=- ip=- md5=- sha1=- sha256=- usrName=- ASN=199669 IPList=[{ ip=83.217.11.193}] country=RU domain=83.217.11.193 first_seen=12.08.2018 00:46 malware=Locky registar= source=https://ransomwaretracker.abuse.ch/feeds/csv/ status=offline threat=C2 url=83.217.11.193/linuxsucks.php - AbuseCh_SSL_Certificate_Block_IP
Regular expression
Event example for checking regular expressions
category=AbuseCh_SSL_Certificate_Block_IP.*ip=(?<object>[^\s]*).*usrName=(?<login>[^\s]*)May 2 16:41:40 category=AbuseCh_SSL_Certificate_Block_IP matchedIndicator=83.217.11.193 url=- src=- ip=83.217.11.193 md5=- sha1=- sha256=- usrName=VerifTestUserName ip=83.217.11.193 source=https://sslbl.abuse.ch/blacklist/sslblacklist.csv - AbuseCh_SSL_Certificate_Hash_SHA1
Regular expression
Event example for checking regular expressions
category=AbuseCh_SSL_Certificate_Hash_SHA1.*sha1=(?<object>[^\s]*).*usrName=(?<login>[^\s]*)May 2 16:41:40 category=AbuseCh_SSL_Certificate_Hash_SHA1 matchedIndicator=3395856ce81f2b7382dee72602f798b642f14140 url=- src=- ip=- md5=- sha1=3395856ce81f2b7382dee72602f798b642f14140 sha256=- usrName=VerifTestUserName MD5=86255ec982e822f6b57855d3866618ae data_added=2015-09-22 - BlocklistDe_Block_IP
Regular expression
Event example for checking regular expressions
category=BlocklistDe_Block_IP.*ip=(?<object>[^\s]*).*usrName=(?<login>[^\s]*)May 2 16:41:40 category=BlocklistDe_Block_IP matchedIndicator=83.217.11.193 url=- src=- ip=83.217.11.193 md5=- sha1=- sha256=- usrName=VerifTestUserName ip=83.217.11.193 - CyberCrime_Tracker_Block_Url
Regular expression
Event example for checking regular expressions
category= CyberCrime_Tracker_Block_Url.*url=(?<url>[^\s]*).*usrName=(?<login>[^\s]*)May 2 16:41:40 category=CyberCrime_Tracker_Block_Url matchedIndicator=83.217.11.193/linuxsucks.php url=83.217.11.193/linuxsucks.php src=- ip=- md5=- sha1=- sha256=- usrName=- ASN=199669 IPList=[{ ip=83.217.11.193}] country=RU domain=83.217.11.193 first_seen=12.08.2018 00:46 malware=Locky status=offline threat=C2 url=83.217.11.193/linuxsucks.php - EmergingThreats_Block_IP
Regular expression
Event example for checking regular expressions
category=EmergingThreats_Block_IP.*ip=(?<object>[^\s]*).*usrName=(?<login>[^\s]*)May 2 16:41:40 category=EmergingThreats_Block_IP matchedIndicator=101.200.81.187 url=- src=- ip=101.200.81.187 md5=- sha1=- sha256=- usrName=VerifTestUserName ip=101.200.81.187 source=https://rules.emergingthreats.net/fwrules/emerging-Block-IPs.txt - EmergingThreats_Compromised_IP
Regular expression
Event example for checking regular expressions
category=EmergingThreats_Compromised_IP.*ip=(?<object>[^\s]*).*usrName=(?<login>[^\s]*)May 2 16:41:40 category=EmergingThreats_Compromised_IP matchedIndicator=100.24.121.249 url=- src=- ip=100.24.121.249 md5=- sha1=- sha256=- usrName=VerifTestUserName ip=100.24.121.249 source=https://rules.emergingthreats.net/blockrules/compromised-ips.txt - KL_ALERT_FeedBecameAvailable
Regular expression
Event example for checking regular expressions
alert=KL_ALERT_FeedBecameAvailable.*feed=(?<object>[^\s]*)May 2 16:41:40 alert=KL_ALERT_FeedBecameAvailable feed=Botnet_CnC_URL_Data_Feed.json - KL_ALERT_FeedBecameUnavailable
Regular expression
Event example for checking regular expressions
alert=KL_ALERT_FeedBecameUnavailable.*feed=(?<object>[^\s]*)May 2 16:41:40 alert=KL_ALERT_FeedBecameUnavailable feed=Botnet_CnC_URL_Data_Feed.json - KL_ALERT_OutdatedFeed
Regular expression
Event example for checking regular expressions
alert=KL_ALERT_OutdatedFeed.*feed=(?<object>[^\s]*)May 2 16:41:40 alert=KL_ALERT_OutdatedFeed feed=Botnet_CnC_URL_Data_Feed.json - KL_ALERT_ServiceStarted
Regular expression
Event example for checking regular expressions
alert=KL_ALERT_ServiceStartedMay 2 16:41:40 alert=KL_ALERT_ServiceStarted - KL_ALERT_ServiceStopped
Regular expression
Event example for checking regular expressions
alert=KL_ALERT_ServiceStoppedMay 2 16:41:40 alert=KL_ALERT_ServiceStopped - KL_ALERT_ServiceUnavailable
Regular expression
Event example for checking regular expressions
alert=KL_ALERT_ServiceUnavailableMay 2 16:41:40 alert=KL_ALERT_ServiceUnavailable - KL_ALERT_UpdatedFeed
Regular expression
Event example for checking regular expressions
alert=KL_ALERT_UpdatedFeed.*feed=(?<object>[^\s]*).*records=(?<quantity>[^\s]*)May 2 16:41:40 alert=KL_ALERT_UpdatedFeed feed=Botnet_CnC_URL_Data_Feed.json records=23 - KL_ALERT_FailedToUpdateFeed
Regular expression
Event example for checking regular expressions
alert=KL_ALERT_FailedToUpdateFeed.*feed=(?<object>[^\s]*)May 2 16:41:40 alert=KL_ALERT_FailedToUpdateFeed feed=Botnet_CnC_URL_Data_Feed.json - KL_ALERT_LicenseExpires
Regular expression
Event example for checking regular expressions
alert=KL_ALERT_LicenseExpires.*license_name=(?<object>[^\s]*)May 2 16:41:40 alert=KL_ALERT_LicenseExpires expiration_date=23.02.2020 license_name=kl_license - KL_ALERT_LicenseExpired
Regular expression
Event example for checking regular expressions
alert=KL_ALERT_LicenseExpired.*license_name=(?<object>[^\s]*)May 2 16:41:40 alert=KL_ALERT_LicenseExpired expiration_date=23.02.2020 license_name=kl_license - KL_ALERT_EPSLimitExceeded
Regular expression
Event example for checking regular expressions
alert=KL_ALERT_EPSLimitExceeded.*current_eps=(?<quantity>[^\s]*)May 2 16:41:40 alert=KL_ALERT_EPSLimitExceeded current_eps=6500 license_limit_eps=5000 - KL_ALERT_EPSHardLimit
Regular expression
Event example for checking regular expressions
alert=KL_ALERT_EPSHardLimit.*license_limit_eps=(?<quantity>[^\s]*)May 2 16:41:40 alert=KL_ALERT_EPSHardLimit license_limit_eps=5000 - KL_ALERT_LicenseChanged
Regular expression
Event example for checking regular expressions
alert=KL_ALERT_LicenseChanged.*license_name=(?<object>[^\s]*)May 2 16:41:40 alert=KL_ALERT_LicenseChanged expiration_date=23.02.2020 license_name=kl_license license_level=EnterpriseTIP - KL_ALERT_ConfigurationUpdated
Regular expression
Event example for checking regular expressions
alert=KL_ALERT_ConfigurationUpdatedMay 2 16:41:40 alert=KL_ALERT_ConfigurationUpdated - KL_ALERT_RetroScanError
Regular expression
Event example for checking regular expressions
alert=KL_ALERT_RetroScanError.*error=(?<object>[^\s]*)May 2 16:41:40 alert=KL_ALERT_RetroScanError error=Service is unavailable - KL_ALERT_RetroScanCompleted
Regular expression
Event example for checking regular expressions
alert=KL_ALERT_RetroScanCompleted.*iocs_rescaned=(?<object>[^\s]*).*iocs_detected=(?<quantity>[^\s]*).*retroscan_report=(?<url>[^\s]*)May 2 16:41:40 alert=KL_ALERT_RetroScanCompleted iocs_rescaned=1998 iocs_detected=82 retroscan_report=https://127.0.0.1:443/retroscan/81650945-f186-437b-8945-9f31715d32da - KL_ALERT_RetroScanStorageExceeded
Regular expression
Event example for checking regular expressions
alert=KL_ALERT_RetroScanStorageExceeded.*storage_size_limit=(?<object>[^\s]*)May 2 16:41:40 alert=KL_ALERT_RetroScanStorageExceeded storage_size_limit=9876 - KL_ALERT_IndicatorsStoreLimitExceeded
Regular expression
Event example for checking regular expressions
alert=KL_ALERT_IndicatorsStoreLimitExceeded.*current_indicators_count=(?<object>[^\s]*).*license_limit_indicators=(?<quantity>[^\s]*)May 2 16:41:40 alert=KL_ALERT_IndicatorsStoreLimitExceeded current_indicators_count=489002001 license_limit_indicator=5000000 - KL_ALERT_IndicatorsStoreHardLimit
Regular expression
Event example for checking regular expressions
alert=KL_ALERT_IndicatorsStoreHardLimit.*license_limit_indicators=(?<quantity>[^\s]*).*msg=(?<object>[^\s]*)May 2 16:41:40 alert=KL_ALERT_IndicatorsStoreHardLimit license_limit_indicators=5000000 msg=Indicators store limit exceeded - KL_ALERT_FreeSpaceEnds
Regular expression
Event example for checking regular expressions
alert=KL_ALERT_FreeSpaceEnds.*msg=Free space left: (?<object>[^\s]*) MbMay 2 16:41:40 alert=KL_ALERT_FreeSpaceEnds msg=Free space left: 7322 Mb - KL_APT_Hash_MD5
Regular expression
Event example for checking regular expressions
category=KL_APT_Hash_MD5.*matchedIndicator=(?<object>[^\s]*).*usrName=(?<login>[^\s]*)May 2 16:41:40 category=KL_APT_Hash_MD5 matchedIndicator=7A2E65A0F70EE0615EC0CA34240CF082 url=- src=192.168.0.0 ip=- md5=7A2E65A0F70EE0615EC0CA34240CF082 sha1=- sha256=- usrName=VerifTestUserName MD5=7A2E65A0F70EE0615EC0CA34240CF082 detection_date=01.06.2018 00:00 publication_name=TestRecordMb - KL_APT_Hash_SHA1
Regular expression
Event example for checking regular expressions
category=KL_APT_Hash_SHA1.*sha1=(?<object>[^\s]*).*usrName=(?<login>[^\s]*)May 2 16:41:40 category=KL_APT_Hash_SHA1 matchedIndicator=7A2EE06E65A0F70EE0615EC0CA342470EE0CF082 url=- src=192.168.0.0 ip=- md5=- sha1=7A2EE06E65A0F70EE0615EC0CA342470EE0CF082 sha256=- usrName=VerifTestUserName MD5=7A2E65A0F70EE0615EC0CA34240CF082 SHA1=EA2EE06E65A0F70EE0615EC0CA342470EE0CF082 SHA256=2EE072EEA2EE615EC006E65A0CF0F70EA342E0615EC0F70ECA342470EE0CF082 detection_date=01.06.2018 00:00 publication_name=TestRecord - KL_APT_Hash_SHA256
Regular expression
Event example for checking regular expressions
category=KL_APT_Hash_SHA256.*sha256=(?<object>[^\s]*).*usrName=(?<login>[^\s]*)May 2 16:41:40 category=KL_APT_Hash_SHA256 matchedIndicator=2EE072EEA2EE615EC006E65A0CF0F70EA342E0615EC0F70ECA342470EE0CF082 url=- src=192.168.0.0 ip=- md5=- sha1=- sha256=2EE072EEA2EE615EC006E65A0CF0F70EA342E0615EC0F70ECA342470EE0CF082 usrName=VerifTestUserName MD5=7A2E65A0F70EE0615EC0CA34240CF082 SHA1=EA2EE06E65A0F70EE0615EC0CA342470EE0CF082 SHA256=2EE072EEA2EE615EC006E65A0CF0F70EA342E0615EC0F70ECA342470EE0CF082 detection_date=01.06.2018 00:00 publication_name=TestRecord - KL_APT_IP
Regular expression
Event example for checking regular expressions
category=KL_APT_IP.*matchedIndicator=(?<object>[^\s]*).*usrName=(?<login>[^\s]*)May 2 16:41:40 category=KL_APT_IP matchedIndicator=192.0.2.4 url=- src=192.168.0.0 ip=192.0.2.4 md5=- sha1=- sha256=- usrName=VerifTestUserName detection_date=01.06.2018 00:00 ip=192.0.2.4 publication_name=TestRecord - KL_APT_URL
Regular expression
Event example for checking regular expressions
category=KL_APT_URL.*matchedIndicator=(?<url>[^\s]*).*usrName=(?<login>[^\s]*)May 2 16:41:40 category=KL_APT_URL matchedIndicator=b046f5b25458638f6705d53539c79f62.com url=b046f5b25458638f6705d53539c79f62.com src=192.168.0.0 ip=- md5=- sha1=- sha256=- usrName=VerifTestUserName detection_date=01.06.2018 00:00 id=0 mask=b046f5b25458638f6705d53539c79f62.com publication_name=TestRecord type=1 - KL_BotnetCnC_Hash_MD5
Regular expression
Event example for checking regular expressions
category=KL_BotnetCnC_Hash_MD5.*md5=(?<object>[^\s]*).*usrName=(?<login>[^\s]*).*mask=(?<url>[^\s]*).*threat=(?<objectname>[^\s]*)May 2 16:41:40 category=KL_BotnetCnC_Hash_MD5 url=- md5=E013C01AB3E27BE6FBA4E23EE88B100F sha1=- sha256=- ip=- usrName=VerifTestUserName IP=118.142.224.213, 160.16.120.71, 61.19.201.7 files=[{MD5=E013C01AB3E27BE6FBA4E23EE88B100F SHA256=C00269AA2BCF375D0CF870C36F737C27EBB04F69F5B6912F860D8A1F5F1D9DF6}] first_seen=08.07.2015 23:39 geo=jp, hk, tw, au, th, cn, my, ph, vn, in id=9189405 last_seen=29.10.2015 15:59 mask=172.117.45.14/pid=1000/botnet_setup_3.exe popularity=5 threat=Trojan-Banker.AndroidOS.Wroba type=3 - KL_BotnetCnC_Hash_SHA1
Regular expression
Event example for checking regular expressions
category=KL_BotnetCnC_Hash_SHA1.*sha1=(?<object>[^\s]*).*usrName=(?<login>[^\s]*).*mask=(?<url>[^\s]*).*threat=(?<objectname>[^\s]*)May 2 16:41:40 category=KL_BotnetCnC_Hash_SHA1 url=- md5=- sha1=FE61DED0504013D9ED6691F6C5BB69DCD8C8DD60 sha256=- ip=- usrName=VerifTestUserName IP=78.47.151.188 files=[{SHA1=FE61DED0504013D9ED6691F6C5BB69DCD8C8DD60 SHA256=B6AEF9CBFA21B0A9E6D03364F5476B81C4A5D8EF212DFB35E3EF96003CADCB0B}] first_seen=21.07.2015 12:19 geo=it, es, de, fr, gb id=9320249 last_seen=14.01.2016 12:55 mask=botnet_domain_4.com/get.php?p=4&id=2 popularity=4 threat=Trojan-SMS.AndroidOS.Opfake type=4 - KL_BotnetCnC_Hash_SHA256
Regular expression
Event example for checking regular expressions
category=KL_BotnetCnC_Hash_SHA256.*sha256=(?<object>[^\s]*).*usrName=(?<login>[^\s]*).*mask=(?<url>[^\s]*).*threat=(?<objectname>[^\s]*)May 2 16:41:40 category=KL_BotnetCnC_Hash_SHA256 url=- md5=- sha1=- sha256=AFDD5508B48B8270C1DBAF32121A00951E450A56791275D8E7C413EF8380A809 ip=- usrName=VerifTestUserName IP=46.4.114.61, 95.213.186.51, 95.213.192.71, 176.9.82.215, 178.63.12.207, 109.206.186.164, 176.9.48.86, 213.163.70.170, 95.213.192.83, 173.45.161.113 files=[{MD5=55B8D137C80AE5E995EC355524594F3B SHA1=BEA6B860C719F1C886461C8A3FF4935471D2FA64 SHA256=AFDD5508B48B8270C1DBAF32121A00951E450A56791275D8E7C413EF8380A809}] first_seen=15.04.2015 13:18 geo=vn, in, tr, mx, ir, bd, id, dz, ph, th id=9230458 last_seen=14.01.2016 12:55 mask=*.subbotnet_domain_19.botnet_domain.com popularity=5 threat=Trojan.Win32.Agent type=19 - KL_BotnetCnC_URL
Regular expression
Event example for checking regular expressions
category=KL_BotnetCnC_URL.*url=(?<url>[^\s]*).*usrName=(?<login>[^\s]*)May 2 16:41:40 category=KL_BotnetCnC_URL url=http://d.subphishing_domain.phishing_domain_19.com md5=- sha1=- sha256=- ip=- usrName=VerifTestUserName IP=104.168.159.146, 138.201.0.229, 138.201.0.231, 138.201.0.230, 78.46.185.21, 78.46.185.23, 78.46.185.12, 78.46.185.3, 78.46.185.16, 78.46.185.28 first_seen=12.01.2016 12:50 geo=br, pt, us id=9508721 last_seen=14.01.2016 13:36 mask=*.subphishing_domain.phishing_domain_19.com popularity=5 type=19 - KL_ICS_Hash_MD5
Regular expression
Event example for checking regular expressions
category=KL_ICS_Hash_MD5.*md5=(?<object>[^\s]*).*usrName=(?<login>[^\s]*).*threat=(?<objectname>[^\s]*)May 2 16:41:40 category=KL_ICS_Hash_MD5 matchedIndicator=7A8F30B40C6564EFF95E678F7C43346C url=- src=- ip=- md5=7A8F30B40C6564EFF95E678F7C43346C sha1=- sha256=- usrName=VerifTestUserName MD5=7A8F30B40C6564EFF95E678F7C43346C SHA1=E51B1A1FDA2CAF10623A83A1476585AC6E10D569 SHA256=EF6CDD46DB5513F7247789E559A1520F6C1DCD17235C395EDCA3E5043988B54B file_size=1989 first_seen=10.07.2015 23:53 last_seen=12.10.2019 18:44 popularity=1 threat=HEUR:Trojan.Win32.Generic - KL_ICS_Hash_SHA1
Regular expression
Event example for checking regular expressions
category=KL_ICS_Hash_SHA1.*sha1=(?<object>[^\s]*).*usrName=(?<login>[^\s]*).*threat=(?<objectname>[^\s]*)May 2 16:41:40 category=KL_ICS_Hash_SHA1 matchedIndicator=E51B1A1FDA2CAF10623A83A1476585AC6E10D569 url=- src=- ip=- md5=- sha1=E51B1A1FDA2CAF10623A83A1476585AC6E10D569 sha256=- usrName=VerifTestUserName MD5=7A8F30B40C6564EFF95E678F7C43346C SHA1=E51B1A1FDA2CAF10623A83A1476585AC6E10D569 SHA256=EF6CDD46DB5513F7247789E559A1520F6C1DCD17235C395EDCA3E5043988B54B file_size=1989 first_seen=10.07.2015 23:53 last_seen=12.10.2019 18:44 popularity=1 threat=HEUR:Trojan.Win32.Generic - KL_ICS_Hash_SHA256
Regular expression
Event example for checking regular expressions
category=KL_ICS_Hash_SHA256.*sha256=(?<object>[^\s]*).*usrName=(?<login>[^\s]*).*threat=(?<objectname>[^\s]*)May 2 16:41:40 category=KL_ICS_Hash_SHA256 matchedIndicator=EF6CDD46DB5513F7247789E559A1520F6C1DCD17235C395EDCA3E5043988B54B url=- src=- ip=- md5=- sha1=- sha256=EF6CDD46DB5513F7247789E559A1520F6C1DCD17235C395EDCA3E5043988B54B usrName=VerifTestUserName MD5=7A8F30B40C6564EFF95E678F7C43346C SHA1=E51B1A1FDA2CAF10623A83A1476585AC6E10D569 SHA256=EF6CDD46DB5513F7247789E559A1520F6C1DCD17235C395EDCA3E5043988B54B file_size=1989 first_seen=10.07.2015 23:53 last_seen=12.10.2019 18:44 popularity=1 threat=HEUR:Trojan.Win32.Generic - KL_InternalTI_URL
Regular expression
Event example for checking regular expressions
category=KL_InternalTI_URL.*url=(?<object>[^\s]*).*usrName=(?<login>[^\s]*)May 2 16:41:40 category=KL_InternalTI_URL matchedIndicator=fakess123.nu url=fakess123.nu src=- ip=- md5=- sha1=- sha256=- usrName=VerifTestUser URL=fakess123.nu - KL_InternalTI_IP
Regular expression
Event example for checking regular expressions
category=KL_InternalTI_IP.*ip=(?<object>[^\s]*).*usrName=(?<login>[^\s]*)May 2 16:41:40 category=KL_InternalTI_IP matchedIndicator=192.0.2.0 url=- src=- ip=192.0.2.0 md5=- sha1=- sha256=- usrName=VerifTestUser IP=192.0.2.0 - KL_InternalTI_Hash_MD5
Regular expression
Event example for checking regular expressions
category=KL_InternalTI_MD5.*md5=(?<object>[^\s]*).*usrName=(?<login>[^\s]*)May 2 16:41:40 category=KL_InternalTI_MD5 matchedIndicator=44D88612FEA8A8F36DE82E1278ABB02F url=- src=- ip=- md5=44D88612FEA8A8F36DE82E1278ABB02F sha1=- sha256=- usrName=VerifTestUser MD5=44D88612FEA8A8F36DE82E1278ABB02F - KL_InternalTI_Hash_SHA1
Regular expression
Event example for checking regular expressions
category=KL_InternalTI_SHA1.*sha1=(?<object>[^\s]*).*usrName=(?<login>[^\s]*)May 2 16:41:40 category=KL_InternalTI_SHA1 matchedIndicator=3395856CE81F2B7382DEE72602F798B642F14140 url=- src=- ip=- md5=- sha1=3395856CE81F2B7382DEE72602F798B642F14140 sha256=- usrName=VerifTestUser SHA1=3395856CE81F2B7382DEE72602F798B642F14140 - KL_InternalTI_Hash_SHA256
Regular expression
Event example for checking regular expressions
category=KL_InternalTI_SHA256.*sha256=(?<object>[^\s]*).*usrName=(?<login>[^\s]*)May 2 16:41:40 category=KL_InternalTI_SHA256 matchedIndicator=762B2BE1D22B737A287D0D6D4FBAF983FD214BBA1497C0A3A2C58C7819303C0C url=- src=- ip=- md5=- sha1=- sha256=762B2BE1D22B737A287D0D6D4FBAF983FD214BBA1497C0A3A2C58C7819303C0C usrName=VerifTestUser SHA256=762B2BE1D22B737A287D0D6D4FBAF983FD214BBA1497C0A3A2C58C7819303C0C - KL_IP_Reputation
Regular expression
Event example for checking regular expressions
category=KL_IP_Reputation.*ip=(?<object>[^\s]*).*usrName=(?<login>[^\s]*).*category=(?<process>[^\s]*).*threat_score=(?<severity>[^\s]*)May 2 16:41:40 category=KL_IP_Reputation url=- md5=- sha1=- sha256=- ip=18.50.1.47 usrName=VerifiTestUserName category=spam first_seen=21.01.2015 00:00 ip=18.50.1.47 ip_geo=us last_seen=17.05.2016 03:16 popularity=1 threat_score=100 - KL_IP_Reputation_Hash_MD5
Regular expression
Event example for checking regular expressions
category=KL_IP_Reputation_Hash_MD5.*matchedIndicator=(?<object>[^\s]*).*usrName=(?<login>[^\s]*)May 2 16:41:40 category=KL_IP_Reputation_Hash_MD5 matchedIndicator=61200D253ADD14C91CD64F2CB1F221CB url=- src=- ip=- md5=61200D253ADD14C91CD64F2CB1F221CB sha1=- sha256=- usrName=- category=malware domains=k4d7ppv9.humanpchelp.pw, mwi49i2b.backbonecomputer.top, 9uq5mmw7.overseascomputer.pw, 9tqnii2s.motivationcomputer.pw, 4iaag9ng.luxurypchelp.pw, kxol25kx.pcserviceline.top, 7ifiye96.phoenixcomputerhelp.pw, tnv5yyvj.pcservicecatch.pw, y4ki19os.computercoral.top, pmayaidy.rankpcservice.top files=[{ MD5=61200D253ADD14C91CD64F2CB1F221CB SHA1=E23B0F6ECEFF56870908B2EC704F62ACB4E005AD SHA256=7FC582451A8D9EAF112A3CFC7EFF8EBC8A5FCB8480E42A8D2B5A4E0E3C12D793 threat=HEUR:Trojan.Script.Generic},{ MD5=06A2E41E9CDA9C19AF5FB29483687A56 SHA1=37ED2076FCC0365BA02210E18BBAB162D7338180 SHA256=9570F5C81FF906CD52EE42B5D24359B8A7CA4EC225C532A811699F1089847252 threat=HEUR:Trojan.Script.Generic},{ MD5=AA909F4A33A0D305C0ADF7FCD6DC95E5 SHA1=0A88A71A3C43F02075B7B3CB1A6ED1A603CC666E SHA256=96467635B09D64B29DEAF2A7923ADCD63C2E7F9308B80DDF46F251EBDB2E6A66 threat=HEUR:Trojan.Script.Generic},{ MD5=1D02D52FE17A040A2C7D7C4EE7020E6A SHA1=036D8147D00334824073A22C3D7016EE27643CBD SHA256=737117D867D8CC777AF09F635126C6867ADD08C47C74EDCF5636A84F3F14911B threat=HEUR:Trojan.Script.Generic},{ MD5=393F797A732D5FF35B6102B298349C65 SHA1=760C99F3FB4330BA7B9EB76780718E3023C345EE SHA256=5E86FE0A4DA6A1394DBC6BD2D0F7BD2791BCC1099F83B04282B0508005212FCB threat=HEUR:Trojan.Script.Generic},{ MD5=5A90DDAAEA8646E84927E5DD7BAAA3E2 SHA1=CA2EEF839CF649E42EB4F7E618BD491B40340462 SHA256=1A73D4EA89E89C22B3B03E1A841882A59FCC1ED18299D6914DF4BC2E5CF05A44 threat=HEUR:Trojan.Script.Generic}] first_seen=21.02.2019 23:57 ip=93.115.27.83 ip_geo=lt ip_whois={ asn=16125 country=LT created=01.12.2016 net_name=CHERRYSERVERS-LT-DEDICATED net_range=93.115.27.0 - 93.115.27.255 updated=01.12.2016} last_seen=22.05.2019 19:18 popularity=5 threat_score=94 users_geo=de, jp, fr, it, ch, at, be, pl, es, dz - KL_IP_Reputation_Hash_SHA1
Regular expression
Event example for checking regular expressions
category=KL_IP_Reputation_Hash_SHA1.*matchedIndicator=(?<object>[^\s]*).*usrName=(?<login>[^\s]*)May 2 16:41:40 category=KL_IP_Reputation_Hash_SHA1 matchedIndicator=E23B0F6ECEFF56870908B2EC704F62ACB4E005AD url=- src=- ip=- md5=- sha1=E23B0F6ECEFF56870908B2EC704F62ACB4E005AD sha256=- usrName=- category=malware domains=k4d7ppv9.humanpchelp.pw, mwi49i2b.backbonecomputer.top, 9uq5mmw7.overseascomputer.pw, 9tqnii2s.motivationcomputer.pw, 4iaag9ng.luxurypchelp.pw, kxol25kx.pcserviceline.top, 7ifiye96.phoenixcomputerhelp.pw, tnv5yyvj.pcservicecatch.pw, y4ki19os.computercoral.top, pmayaidy.rankpcservice.top files=[{ MD5=61200D253ADD14C91CD64F2CB1F221CB SHA1=E23B0F6ECEFF56870908B2EC704F62ACB4E005AD SHA256=7FC582451A8D9EAF112A3CFC7EFF8EBC8A5FCB8480E42A8D2B5A4E0E3C12D793 threat=HEUR:Trojan.Script.Generic},{ MD5=06A2E41E9CDA9C19AF5FB29483687A56 SHA1=37ED2076FCC0365BA02210E18BBAB162D7338180 SHA256=9570F5C81FF906CD52EE42B5D24359B8A7CA4EC225C532A811699F1089847252 threat=HEUR:Trojan.Script.Generic},{ MD5=AA909F4A33A0D305C0ADF7FCD6DC95E5 SHA1=0A88A71A3C43F02075B7B3CB1A6ED1A603CC666E SHA256=96467635B09D64B29DEAF2A7923ADCD63C2E7F9308B80DDF46F251EBDB2E6A66 threat=HEUR:Trojan.Script.Generic},{ MD5=1D02D52FE17A040A2C7D7C4EE7020E6A SHA1=036D8147D00334824073A22C3D7016EE27643CBD SHA256=737117D867D8CC777AF09F635126C6867ADD08C47C74EDCF5636A84F3F14911B threat=HEUR:Trojan.Script.Generic},{ MD5=393F797A732D5FF35B6102B298349C65 SHA1=760C99F3FB4330BA7B9EB76780718E3023C345EE SHA256=5E86FE0A4DA6A1394DBC6BD2D0F7BD2791BCC1099F83B04282B0508005212FCB threat=HEUR:Trojan.Script.Generic},{ MD5=5A90DDAAEA8646E84927E5DD7BAAA3E2 SHA1=CA2EEF839CF649E42EB4F7E618BD491B40340462 SHA256=1A73D4EA89E89C22B3B03E1A841882A59FCC1ED18299D6914DF4BC2E5CF05A44 threat=HEUR:Trojan.Script.Generic}] first_seen=21.02.2019 23:57 ip=93.115.27.83 ip_geo=lt ip_whois={ asn=16125 country=LT created=01.12.2016 net_name=CHERRYSERVERS-LT-DEDICATED net_range=93.115.27.0 - 93.115.27.255 updated=01.12.2016} last_seen=22.05.2019 19:18 popularity=5 threat_score=94 users_geo=de, jp, fr, it, ch, at, be, pl, es, dz - KL_IP_Reputation_Hash_SHA256
Regular expression
Event example for checking regular expressions
category=KL_IP_Reputation_Hash_SHA256.*matchedIndicator=(?<object>[^\s]*).*usrName=(?<login>[^\s]*)May 2 16:41:40 category=KL_IP_Reputation_Hash_SHA256 matchedIndicator=7FC582451A8D9EAF112A3CFC7EFF8EBC8A5FCB8480E42A8D2B5A4E0E3C12D793 url=- src=- ip=- md5=- sha1=- sha256=7FC582451A8D9EAF112A3CFC7EFF8EBC8A5FCB8480E42A8D2B5A4E0E3C12D793 usrName=- category=malware domains=k4d7ppv9.humanpchelp.pw, mwi49i2b.backbonecomputer.top, 9uq5mmw7.overseascomputer.pw, 9tqnii2s.motivationcomputer.pw, 4iaag9ng.luxurypchelp.pw, kxol25kx.pcserviceline.top, 7ifiye96.phoenixcomputerhelp.pw, tnv5yyvj.pcservicecatch.pw, y4ki19os.computercoral.top, pmayaidy.rankpcservice.top files=[{ MD5=61200D253ADD14C91CD64F2CB1F221CB SHA1=E23B0F6ECEFF56870908B2EC704F62ACB4E005AD SHA256=7FC582451A8D9EAF112A3CFC7EFF8EBC8A5FCB8480E42A8D2B5A4E0E3C12D793 threat=HEUR:Trojan.Script.Generic},{ MD5=06A2E41E9CDA9C19AF5FB29483687A56 SHA1=37ED2076FCC0365BA02210E18BBAB162D7338180 SHA256=9570F5C81FF906CD52EE42B5D24359B8A7CA4EC225C532A811699F1089847252 threat=HEUR:Trojan.Script.Generic},{ MD5=AA909F4A33A0D305C0ADF7FCD6DC95E5 SHA1=0A88A71A3C43F02075B7B3CB1A6ED1A603CC666E SHA256=96467635B09D64B29DEAF2A7923ADCD63C2E7F9308B80DDF46F251EBDB2E6A66 threat=HEUR:Trojan.Script.Generic},{ MD5=1D02D52FE17A040A2C7D7C4EE7020E6A SHA1=036D8147D00334824073A22C3D7016EE27643CBD SHA256=737117D867D8CC777AF09F635126C6867ADD08C47C74EDCF5636A84F3F14911B threat=HEUR:Trojan.Script.Generic},{ MD5=393F797A732D5FF35B6102B298349C65 SHA1=760C99F3FB4330BA7B9EB76780718E3023C345EE SHA256=5E86FE0A4DA6A1394DBC6BD2D0F7BD2791BCC1099F83B04282B0508005212FCB threat=HEUR:Trojan.Script.Generic},{ MD5=5A90DDAAEA8646E84927E5DD7BAAA3E2 SHA1=CA2EEF839CF649E42EB4F7E618BD491B40340462 SHA256=1A73D4EA89E89C22B3B03E1A841882A59FCC1ED18299D6914DF4BC2E5CF05A44 threat=HEUR:Trojan.Script.Generic}] first_seen=21.02.2019 23:57 ip=93.115.27.83 ip_geo=lt ip_whois={ asn=16125 country=LT created=01.12.2016 net_name=CHERRYSERVERS-LT-DEDICATED net_range=93.115.27.0 - 93.115.27.255 updated=01.12.2016} last_seen=22.05.2019 19:18 popularity=5 threat_score=94 users_geo=de, jp, fr, it, ch, at, be, pl, es, dz - KL_Malicious_Hash_MD5
Regular expression
Event example for checking regular expressions
category=KL_Malicious_Hash_MD5.*md5=(?<object>[^\s]*).*usrName=(?<login>[^\s]*).*file_size=(?<size>[^\s]*).*threat=(?<objectname>[^\s]*)May 2 16:41:40 category=KL_Malicious_Hash_MD5 url=- md5=0F1DCBB2A888B99FAE72144087CAE565 sha1=- sha256=- ip=- usrName=VerifTestUserName MD5=0F1DCBB2A888B99FAE72144087CAE565 file_size=105472 file_type=PE first_seen=26.11.2015 13:06 geo=ru, ro, ua, tj, us, cz, kz, gb last_seen=14.01.2016 12:29 popularity=5 threat=UDS:DangerousObject.Multi.Generic - KL_Malicious_Hash_SHA1
Regular expression
Event example for checking regular expressions
category=KL_Malicious_Hash_SHA1.*sha1=(?<object>[^\s]*).*usrName=(?<login>[^\s]*).*file_size=(?<size>[^\s]*).*threat=(?<objectname>[^\s]*)May 2 16:41:40 category=KL_Malicious_Hash_SHA1 url=- md5=- sha1=6665856CE81F2B7382DEE72602F798B642F14140 sha256=- ip=- usrName=VerifTestUserName MD5=55D88612FEA8A8F36DE82E1278ABB02F SHA1=6665856CE81F2B7382DEE72602F798B642F14140 SHA256=275A021BBFB6489E54D471899F7DB9D1663FC695EC2FE2A2C4777AABF651FD0F file_size=68 first_seen=02.04.2010 22:07 last_seen=14.01.2016 13:41 popularity=5 threat=EICAR-Test-File - KL_Malicious_Hash_SHA256
Regular expression
Event example for checking regular expressions
category=KL_Malicious_Hash_SHA256.*sha256=(?<object>[^\s]*).*usrName=(?<login>[^\s]*).*file_size=(?<size>[^\s]*).*threat=(?<objectname>[^\s]*)May 2 16:41:40 category=KL_Malicious_Hash_SHA256 url=- md5=- sha1=- sha256=EC1D5E24A9F866F21118914445AB0A00A60F791B51478F3D0DD375A6BD45897D ip=- usrName=VerifTestUserName SHA1=C365DC5128FF0A607D78BFBAB36E08263DC66B18 SHA256=EC1D5E24A9F866F21118914445AB0A00A60F791B51478F3D0DD375A6BD45897D file_size=1696256 file_type=PE first_seen=15.07.2015 11:50 geo=ru, ua, by, dz, ir, eg, kz, mx, in, tr last_seen=14.01.2016 12:29 popularity=5 threat=HackTool.Win32.KRT.bw - KL_Malicious_URL
Regular expression
Event example for checking regular expressions
category=KL_Malicious_URL.*url=(?<url>[^\s]*).*usrName=(?<login>[^\s]*)May 2 16:41:40 category=KL_Malicious_URL url=http://sub1.submalicious_domain.malicious_domain_19.com md5=- sha1=- sha256=- ip=- usrName=VerifTestUserName IP=217.23.14.223 first_seen=14.01.2016 02:42 geo=ru, kz, ro, ua, by, cz id=9524476 last_seen=14.01.2016 13:36 mask=*.submalicious_domain.malicious_domain_19.com popularity=5 type=19 - KL_Malicious_URL_Hash_MD5
Regular expression
Event example for checking regular expressions
category=KL_Malicious_URL_Hash_MD5.*matchedIndicator=(?<object>[^\s]*).*usrName=(?<login>[^\s]*)May 2 16:41:40 category=KL_Malicious_URL_Hash_MD5 matchedIndicator=C735608E2DDE63857C3877AE438EBF78 url=- src=- ip=- md5=C735608E2DDE63857C3877AE438EBF78 sha1=- sha256=- usrName=- IP=104.27.160.251, 104.27.161.251, 145.239.252.74, 46.35.111.137, 207.244.89.108, 54.37.87.37, 207.244.89.90, 77.111.246.8, 131.173.16.52 category=Malware files=[{ MD5=C735608E2DDE63857C3877AE438EBF78 SHA1=9FB04AB8756742E9903A9A77566938DC9D83138C SHA256=127E83998D65FD80328D89B87B9C4CB5756C57FCC03189FAC5B7D77D4FB48FC5 threat=HEUR:Trojan.Script.Miner.gen}] first_seen=15.03.2019 14:27 geo=es, de, it, ru, ve, pl, pt, jp, kz, mx id=29703667 last_seen=23.05.2019 14:12 mask=tercabilis.info popularity=4 type=1 whois={ NS=art.ns.cloudflare.com, olga.ns.cloudflare.com NS_ips=173.245.58.137, 173.245.59.102 country=FR created=02.10.2018 domain=tercabilis.info expires=02.10.2019 org=NETIM registrar_name=NETIM SARL updated=01.12.2018} - KL_Malicious_URL_Hash_SHA1
Regular expression
Event example for checking regular expressions
category=KL_Malicious_URL_Hash_SHA1.*matchedIndicator=(?<object>[^\s]*).*usrName=(?<login>[^\s]*)May 2 16:41:40 category=KL_Malicious_URL_Hash_SHA1 matchedIndicator=9FB04AB8756742E9903A9A77566938DC9D83138C url=- src=- ip=- md5=- sha1=9FB04AB8756742E9903A9A77566938DC9D83138C sha256=- usrName=- IP=163.172.129.78, 212.47.250.90 category=Malware files=[{ MD5=9096549542B5A4E711BF04732416AA97 SHA1=4616FF9FBFF692535C6F0D9BD347CC0593A1F6B8 threat=HEUR:Trojan.Script.Miner.gen},{ MD5=6CBF2B0ADC72F64913EDE949A3F93B2D SHA1=5BB602A5A3AE5C685F0EB9CF2BFE9546DFC5832A SHA256=E804F6ADF2B7C99A8E0B158E880DF3172131CFAD7D796A75CBC2E46606371D2E threat=HEUR:Trojan.Script.Miner.gen},{ MD5=C735608E2DDE63857C3877AE438EBF78 SHA1=9FB04AB8756742E9903A9A77566938DC9D83138C SHA256=127E83998D65FD80328D89B87B9C4CB5756C57FCC03189FAC5B7D77D4FB48FC5 threat=HEUR:Trojan.Script.Miner.gen}] first_seen=29.05.2018 15:54 geo=ru, kz, by, ua id=23128232 last_seen=23.03.2019 12:07 mask=play.on.animeteatr.ru popularity=3 type=2 - KL_Malicious_URL_Hash_SHA256
Regular expression
Event example for checking regular expressions
category=KL_Malicious_URL_Hash_SHA256.*matchedIndicator=(?<object>[^\s]*).*usrName=(?<login>[^\s]*)May 2 16:41:40 category=KL_Malicious_URL_Hash_SHA256 matchedIndicator=127E83998D65FD80328D89B87B9C4CB5756C57FCC03189FAC5B7D77D4FB48FC5 url=- src=- ip=- md5=- sha1=- sha256=127E83998D65FD80328D89B87B9C4CB5756C57FCC03189FAC5B7D77D4FB48FC5 usrName=- IP=163.172.129.78, 212.47.250.90, 173.192.191.169, 167.99.216.96, 89.238.177.226 category=Malware files=[{ MD5=C735608E2DDE63857C3877AE438EBF78 SHA1=9FB04AB8756742E9903A9A77566938DC9D83138C SHA256=127E83998D65FD80328D89B87B9C4CB5756C57FCC03189FAC5B7D77D4FB48FC5 threat=HEUR:Trojan.Script.Miner.gen},{ MD5=978E8C1CB071387ABBB4A673FF918BB9 SHA1=AFAEEE65BB483994FAC36A6B97F10B2BAA51F832 SHA256=3CFAACB2E8EE3E7CC5685DEDDFED7E34BF7595015307FEE64DD3C196C1D4ED93 threat=HEUR:Trojan.Script.Miner.gen},{ MD5=9096549542B5A4E711BF04732416AA97 SHA1=4616FF9FBFF692535C6F0D9BD347CC0593A1F6B8 threat=HEUR:Trojan.Script.Miner.gen},{ MD5=3FF0CF473B1E8FEB3BC018AF999DF4F5 SHA1=6813E9BB538F4AE1290411DD6AC48D615B5A4F21 threat=HEUR:Trojan.Script.Miner.gen},{ MD5=6CBF2B0ADC72F64913EDE949A3F93B2D SHA1=5BB602A5A3AE5C685F0EB9CF2BFE9546DFC5832A SHA256=E804F6ADF2B7C99A8E0B158E880DF3172131CFAD7D796A75CBC2E46606371D2E threat=HEUR:Trojan.Script.Miner.gen},{ MD5=44A27780FD4ABF64BF4EBB5584857160 SHA1=C9552F0DBF8A213556F3CC0CBD98CBFD157362F9 SHA256=EB703A25657D70CD85059A1AFD4720DF5273C4775EE05C6A2B1D3FBFD84D767C threat=HEUR:Trojan.Script.Miner.gen}] first_seen=29.05.2018 15:54 geo=de, gr, it, gb, pl, dz, hu, at, br, ch id=23128262 last_seen=07.04.2019 20:16 mask=play.play1.videos.vidto.me popularity=4 type=2 whois={ MX=mail.vidto.me, mail2.vidto.me MX_ips=158.69.116.96 NS=pns1.cloudns.net, pns2.cloudns.net, pns3.cloudns.net, pns4.cloudns.net NS_ips=185.136.96.111, 185.136.97.111, 185.136.98.111, 185.136.99.111 country=SE created=21.06.2012 domain=vidto.me expires=21.06.2021 org=Shield Whois registrar_name=AB NameISP updated=23.11.2018} - KL_Mobile_BotnetCnC_Hash_MD5
Regular expression
Event example for checking regular expressions
category=KL_Mobile_BotnetCnC_Hash_MD5.*url=(?<url>[^\s]*).*usrName=(?<login>[^\s]*).*Mask=(?<object>[^\s{}]*).*verdict=(?<objectname>[^\s]*)May 2 16:41:40 category=KL_Mobile_BotnetCnC_Hash_MD5 url=- md5=12B8D137C80AE5E995EC355524594F3B sha1=- sha256=- ip=- usrName=VerifTestUserName Behaviour=Get Location, Collect phone info, Read SMS, Get Accounts, Read Contacts Details=[{Mask=*.subdbotnet_domain_19.dbotnet_domain.com}] MD5=12B8D137C80AE5E995EC355524594F3B verdict=Evaluation-CnC.AndroidOS - KL_Mobile_BotnetCnC_Hash_SHA1
Regular expression
Event example for checking regular expressions
category=KL_Mobile_BotnetCnC_Hash_SHA1.*sha1=(?<object>[^\s]*).*usrName=(?<login>[^\s]*).*verdict=(?<objectname>[^\s]*)May 2 16:41:40 category=KL_Mobile_BotnetCnC_Hash_SHA1 url=- md5=- sha1=AFAEEE65BB483994FAC36A6B97F10B2BAA51F832 sha256=- ip=- usrName=VerifTestUserName Behaviour=Get Location, Collect phone info, Read SMS, Get Accounts, Read Contacts - KL_Mobile_BotnetCnC_Hash_SHA256
Regular expression
Event example for checking regular expressions
category=KL_Mobile_BotnetCnC_Hash_SHA256.*sha256=(?<object>[^\s]*).*usrName=(?<login>[^\s]*).*verdict=(?<objectname>[^\s]*)May 2 16:41:40 category=KL_Mobile_BotnetCnC_Hash_SHA256 url=- md5=- sha1=- sha256=E804F6ADF2B7C99A8E0B158E880DF3172131CFAD7D796A75CBC2E46606371D2E ip=- usrName=VerifTestUserName Behaviour=Get Location, Collect phone info, Read SMS, Get Accounts, Read Contacts - KL_Mobile_BotnetCnC_URL
Regular expression
Event example for checking regular expressions
category=KL_Mobile_BotnetCnC_URL.*url=(?<url>[^\s]*).*usrName=(?<login>[^\s]*).*Mask=(?<object>[^\s{}]*).*verdict=(?<objectname>[^\s]*)May 2 16:41:40 category=KL_Mobile_BotnetCnC_URL url=baddomain.subdbotnet_domain_19.dbotnet_domain.com md5=- sha1=- sha256=- ip=- usrName=VerifTestUserName Behaviour=Get Location, Collect phone info, Read SMS, Get Accounts, Read Contacts Details=[{Mask=*.subdbotnet_domain_19.dbotnet_domain.com}] MD5=12B8D137C80AE5E995EC355524594F3B verdict=Evaluation-CnC.AndroidOS - KL_Mobile_Malicious_Hash_MD5
Regular expression
Event example for checking regular expressions
category=KL_Mobile_Malicious_Hash_MD5.*md5=(?<object>[^\s]*).*usrName=(?<login>[^\s]*).*file_size=(?<size>[^\s]*).*threat=(?<objectname>[^\s]*)May 2 16:41:40 category=KL_Mobile_Malicious_Hash_MD5 url=- md5=A0D02A618E0FB400EDC0E210DD975E21 sha1=- sha256=- ip=- usrName=VerifTestUserName MD5=A0D02A618E0FB400EDC0E210DD975E21 SHA1=AB04F1F9CFE33EADB7ECC75EDF7A79EE1E22AEE6 SHA256=5E658421AE871ED9EA85A352050B7F27525821649EA0A6863B62BA7BDED2C074 file_size=378980 first_seen=10.09.2015 06:47 geo=ru, in, id, ir, my, bd, ua, br, dz, ro last_seen=14.01.2016 13:18 popularity=5 threat=HEUR:Trojan.AndroidOS.Guerrilla.b - KL_Mobile_Malicious_Hash_SHA1
Regular expression
Event example for checking regular expressions
category=KL_Mobile_Malicious_Hash_SHA1.*sha1=(?<object>[^\s]*).*usrName=(?<login>[^\s]*).*file_size=(?<size>[^\s]*).*threat=(?<objectname>[^\s]*)May 2 16:41:40 category=KL_Mobile_Malicious_Hash_SHA1 url=- md5=- sha1=9DA11F40D00E37D27A7B41EE7C741F4CF0E52AE6 sha256=- ip=- usrName=VerifTestUserName MD5=F9E8AB7B3E0B23203B678772AFD4CDD1 SHA1=9DA11F40D00E37D27A7B41EE7C741F4CF0E52AE6 SHA256=111319613DA28D6D59282EBC2730E0448717CD55B36050B9142167936070F9EE file_size=236096 first_seen=15.12.2015 20:59 geo=ru, ua, in, tr, id, dz, mx, kz, by, ro last_seen=14.01.2016 13:23 popularity=5 threat=HEUR:Trojan.AndroidOS.Ztorg.a - KL_Mobile_Malicious_Hash_SHA256
Regular expression
Event example for checking regular expressions
category=KL_Mobile_Malicious_Hash_SHA256.*sha256=(?<object>[^\s]*).*usrName=(?<login>[^\s]*).*file_size=(?<size>[^\s]*).*threat=(?<objectname>[^\s]*)May 2 16:41:40 category=KL_Mobile_Malicious_Hash_SHA256 url=- md5=- sha1=- sha256=3F52BBBA93A3C757D781ED4D8D526632995FD2F712788D24C528B2F5DB6E3C42 ip=- usrName=VerifTestUserName MD5=A8315A5D4C8ACB982372C16B83BAEAAA SHA1=ABBB5A760C3203CB460D60279269F5568D89F848 SHA256=3F52BBBA93A3C757D781ED4D8D526632995FD2F712788D24C528B2F5DB6E3C42 file_size=444408 first_seen=01.08.2015 00:08 geo=ru, ua, kz, ro, by, cn, tj, uz, az, md last_seen=14.01.2016 13:18 popularity=5 threat=HEUR:Trojan-SMS.AndroidOS.Podec.a - KL_Phishing_URL
Regular expression
Event example for checking regular expressions
category=KL_Phishing_URL.*url=(?<url>[^\s]*).*usrName=(?<login>[^\s]*)May 2 16:41:40 category=KL_Phishing_URL url=http://d.subphishing_domain.phishing_domain_19.com md5=- sha1=- sha256=- ip=- usrName=VerifTestUserName IP=104.168.159.146, 138.201.0.229, 138.201.0.231, 138.201.0.230, 78.46.185.21, 78.46.185.23, 78.46.185.12, 78.46.185.3, 78.46.185.16, 78.46.185.28 first_seen=12.01.2016 12:50 geo=br, pt, us id=9508721 last_seen=14.01.2016 13:36 mask=*.subphishing_domain.phishing_domain_19.com popularity=5 type=19 - KL_Ransomware_URL
Regular expression
Event example for checking regular expressions
category=KL_Ransomware_URL.*url=(?<url>[^\s]*).*usrName=(?<login>[^\s]*)May 2 16:41:40 category=KL_Ransomware_URL matchedIndicator=fakess123r.nu url=fakess123r.nu src=192.168.0.0 ip=- md5=- sha1=- sha256=- usrName=VerifTestUserName first_seen=10.08.2016 14:18 id=0 last_seen=22.12.2017 15:12 mask=fakess123r.nu popularity=1 type=1 - KL_Ransomware_URL_Hash_MD5
Regular expression
Event example for checking regular expressions
category=KL_Ransomware_URL_Hash_MD5.*md5=(?<object>[^\s]*).*usrName=(?<login>[^\s]*)May 2 16:41:40 category=KL_Ransomware_URL_Hash_MD5 matchedIndicator=DAFECEDABFE0F3AB372A7C83B84CEFF6 url=- src=- ip=- md5=DAFECEDABFE0F3AB372A7C83B84CEFF6 sha1=- sha256=- usrName=- IP=104.27.174.162, 104.27.175.162, 188.166.67.166, 193.176.84.67, 185.232.23.3, 5.182.27.20, 178.128.153.190, 78.24.218.108, 158.58.172.76, 2.59.214.27 files=[{ MD5=DAFECEDABFE0F3AB372A7C83B84CEFF6 SHA1=0D68EE713180A5BF73F7C74CE00F067D2BE5CF7C SHA256=7DD78D2CBFF85A80954558C5C01986FC5D9099C87ECE796A374626EB76BE037D threat=HEUR:Trojan.Win32.Generic}] first_seen=01.04.2019 18:17 geo=ru, kz, ua, by, de, lt, ro, pl, md, it id=30341045 last_seen=23.05.2019 14:19 mask=sama-berli.info popularity=5 type=1 whois={ NS=dora.ns.cloudflare.com, zod.ns.cloudflare.com NS_ips=173.245.58.108, 173.245.59.250 country=UA created=24.01.2019 domain=sama-berli.info expires=24.01.2020 org=ZAO Sigva registrar_email=abuse@reg.ru registrar_name=Limited Liability Company "Registrar of domain names REG.RU" updated=29.03.2019} - KL_Ransomware_URL_Hash_SHA1
Regular expression
Event example for checking regular expressions
category=KL_Ransomware_URL_Hash_SHA1.*matchedIndicator=(?<object>[^\s]*).*usrName=(?<login>[^\s]*)May 2 16:41:40 category=KL_Ransomware_URL_Hash_SHA1 matchedIndicator=0D68EE713180A5BF73F7C74CE00F067D2BE5CF7C url=- src=- ip=- md5=- sha1=0D68EE713180A5BF73F7C74CE00F067D2BE5CF7C sha256=- usrName=- IP=104.27.174.162, 104.27.175.162, 188.166.67.166, 193.176.84.67, 185.232.23.3, 5.182.27.20, 178.128.153.190, 78.24.218.108, 158.58.172.76, 2.59.214.27 files=[{ MD5=DAFECEDABFE0F3AB372A7C83B84CEFF6 SHA1=0D68EE713180A5BF73F7C74CE00F067D2BE5CF7C SHA256=7DD78D2CBFF85A80954558C5C01986FC5D9099C87ECE796A374626EB76BE037D threat=HEUR:Trojan.Win32.Generic}] first_seen=01.04.2019 18:17 geo=ru, kz, ua, by, de, lt, ro, pl, md, it id=30341045 last_seen=23.05.2019 14:19 mask=sama-berli.info popularity=5 type=1 whois={ NS=dora.ns.cloudflare.com, zod.ns.cloudflare.com NS_ips=173.245.58.108, 173.245.59.250 country=UA created=24.01.2019 domain=sama-berli.info expires=24.01.2020 org=ZAO Sigva registrar_email=abuse@reg.ru registrar_name=Limited Liability Company "Registrar of domain names REG.RU" updated=29.03.2019} - KL_Ransomware_URL_Hash_SHA256
Regular expression
Event example for checking regular expressions
category=KL_Ransomware_URL_Hash_SHA256.*matchedIndicator=(?<object>[^\s]*).*usrName=(?<login>[^\s]*)May 2 16:41:40 category=KL_Ransomware_URL_Hash_SHA256 matchedIndicator=7DD78D2CBFF85A80954558C5C01986FC5D9099C87ECE796A374626EB76BE037D url=- src=- ip=- md5=- sha1=- sha256=7DD78D2CBFF85A80954558C5C01986FC5D9099C87ECE796A374626EB76BE037D usrName=- IP=104.27.174.162, 104.27.175.162, 188.166.67.166, 193.176.84.67, 185.232.23.3, 5.182.27.20, 178.128.153.190, 78.24.218.108, 158.58.172.76, 2.59.214.27 files=[{ MD5=DAFECEDABFE0F3AB372A7C83B84CEFF6 SHA1=0D68EE713180A5BF73F7C74CE00F067D2BE5CF7C SHA256=7DD78D2CBFF85A80954558C5C01986FC5D9099C87ECE796A374626EB76BE037D threat=HEUR:Trojan.Win32.Generic}] first_seen=01.04.2019 18:17 geo=ru, kz, ua, by, de, lt, ro, pl, md, it id=30341045 last_seen=23.05.2019 14:19 mask=sama-berli.info popularity=5 type=1 whois={ NS=dora.ns.cloudflare.com, zod.ns.cloudflare.com NS_ips=173.245.58.108, 173.245.59.250 country=UA created=24.01.2019 domain=sama-berli.info expires=24.01.2020 org=ZAO Sigva registrar_email=abuse@reg.ru registrar_name=Limited Liability Company "Registrar of domain names REG.RU" updated=29.03.2019} - KL_Exploit_Hash_MD5
Regular expression
Event example for checking regular expressions
category=KL_Exploit_Hash_MD5.*md5=(?<object>[^\s]*).*usrName=(?<login>[^\s]*)May 2 16:41:40 category=KL_Exploit_Hash_MD5 matchedIndicator=DAFECEDABFE0F3AB372A7C83B84CEFF6 url=- src=- ip=- md5=DAFECEDABFE0F3AB372A7C83B84CEFF6 sha1=- sha256=- usrName=- IP=104.27.174.162, 104.27.175.162, 188.166.67.166, 193.176.84.67, 185.232.23.3, 5.182.27.20, 178.128.153.190, 78.24.218.108, 158.58.172.76, 2.59.214.27 files=[{ MD5=DAFECEDABFE0F3AB372A7C83B84CEFF6 SHA1=0D68EE713180A5BF73F7C74CE00F067D2BE5CF7C SHA256=7DD78D2CBFF85A80954558C5C01986FC5D9099C87ECE796A374626EB76BE037D threat=HEUR:Trojan.Win32.Generic}] first_seen=01.04.2019 18:17 geo=ru, kz, ua, by, de, lt, ro, pl, md, it id=30341045 last_seen=23.05.2019 14:19 mask=sama-berli.info popularity=5 type=1 whois={ NS=dora.ns.cloudflare.com, zod.ns.cloudflare.com NS_ips=173.245.58.108, 173.245.59.250 country=UA created=24.01.2019 domain=sama-berli.info expires=24.01.2020 org=ZAO Sigva registrar_email=abuse@reg.ru registrar_name=Limited Liability Company "Registrar of domain names REG.RU" updated=29.03.2019} - KL_Exploit_Hash_SHA1
Regular expression
Event example for checking regular expressions
category=KL_Exploit_Hash_SHA1.*sha1=(?<object>[^\s]*).*usrName=(?<login>[^\s]*)May 2 16:41:40 category=KL_Exploit_Hash_SHA1 matchedIndicator=0D68EE713180A5BF73F7C74CE00F067D2BE5CF7C url=- src=- ip=- md5=- sha1=0D68EE713180A5BF73F7C74CE00F067D2BE5CF7C sha256=- usrName=- IP=104.27.174.162, 104.27.175.162, 188.166.67.166, 193.176.84.67, 185.232.23.3, 5.182.27.20, 178.128.153.190, 78.24.218.108, 158.58.172.76, 2.59.214.27 files=[{ MD5=DAFECEDABFE0F3AB372A7C83B84CEFF6 SHA1=0D68EE713180A5BF73F7C74CE00F067D2BE5CF7C SHA256=7DD78D2CBFF85A80954558C5C01986FC5D9099C87ECE796A374626EB76BE037D threat=HEUR:Trojan.Win32.Generic}] first_seen=01.04.2019 18:17 geo=ru, kz, ua, by, de, lt, ro, pl, md, it id=30341045 last_seen=23.05.2019 14:19 mask=sama-berli.info popularity=5 type=1 whois={ NS=dora.ns.cloudflare.com, zod.ns.cloudflare.com NS_ips=173.245.58.108, 173.245.59.250 country=UA created=24.01.2019 domain=sama-berli.info expires=24.01.2020 org=ZAO Sigva registrar_email=abuse@reg.ru registrar_name=Limited Liability Company "Registrar of domain names REG.RU" updated=29.03.2019} - KL_Exploit_Hash_SHA256
Regular expression
Event example for checking regular expressions
category=KL_Exploit_Hash_SHA256.*sha256=(?<object>[^\s]*).*usrName=(?<login>[^\s]*)May 2 16:41:40 category=KL_Exploit_Hash_SHA256 matchedIndicator=7DD78D2CBFF85A80954558C5C01986FC5D9099C87ECE796A374626EB76BE037D url=- src=- ip=- md5=- sha1=- sha256=7DD78D2CBFF85A80954558C5C01986FC5D9099C87ECE796A374626EB76BE037D usrName=- IP=104.27.174.162, 104.27.175.162, 188.166.67.166, 193.176.84.67, 185.232.23.3, 5.182.27.20, 178.128.153.190, 78.24.218.108, 158.58.172.76, 2.59.214.27 files=[{ MD5=DAFECEDABFE0F3AB372A7C83B84CEFF6 SHA1=0D68EE713180A5BF73F7C74CE00F067D2BE5CF7C SHA256=7DD78D2CBFF85A80954558C5C01986FC5D9099C87ECE796A374626EB76BE037D threat=HEUR:Trojan.Win32.Generic}] first_seen=01.04.2019 18:17 geo=ru, kz, ua, by, de, lt, ro, pl, md, it id=30341045 last_seen=23.05.2019 14:19 mask=sama-berli.info popularity=5 type=1 whois={ NS=dora.ns.cloudflare.com, zod.ns.cloudflare.com NS_ips=173.245.58.108, 173.245.59.250 country=UA created=24.01.2019 domain=sama-berli.info expires=24.01.2020 org=ZAO Sigva registrar_email=abuse@reg.ru registrar_name=Limited Liability Company "Registrar of domain names REG.RU" updated=29.03.2019} - KL_IoT_Hash_MD5
Regular expression
Event example for checking regular expressions
category=KL_IoT_Hash_MD5.*md5=(?<object>[^\s]*).*usrName=(?<login>[^\s]*)May 2 16:41:40 category=KL_IoT_Hash_MD5 matchedIndicator=DAFECEDABFE0F3AB372A7C83B84CEFF6 url=- src=- ip=- md5=DAFECEDABFE0F3AB372A7C83B84CEFF6 sha1=- sha256=- usrName=- IP=104.27.174.162, 104.27.175.162, 188.166.67.166, 193.176.84.67, 185.232.23.3, 5.182.27.20, 178.128.153.190, 78.24.218.108, 158.58.172.76, 2.59.214.27 files=[{ MD5=DAFECEDABFE0F3AB372A7C83B84CEFF6 SHA1=0D68EE713180A5BF73F7C74CE00F067D2BE5CF7C SHA256=7DD78D2CBFF85A80954558C5C01986FC5D9099C87ECE796A374626EB76BE037D threat=HEUR:Trojan.Win32.Generic}] first_seen=01.04.2019 18:17 geo=ru, kz, ua, by, de, lt, ro, pl, md, it id=30341045 last_seen=23.05.2019 14:19 mask=sama-berli.info popularity=5 type=1 whois={ NS=dora.ns.cloudflare.com, zod.ns.cloudflare.com NS_ips=173.245.58.108, 173.245.59.250 country=UA created=24.01.2019 domain=sama-berli.info expires=24.01.2020 org=ZAO Sigva registrar_email=abuse@reg.ru registrar_name=Limited Liability Company "Registrar of domain names REG.RU" updated=29.03.2019} - KL_IoT_Hash_SHA1
Regular expression
Event example for checking regular expressions
category=KL_IoT_Hash_SHA1.*sha1=(?<object>[^\s]*).*usrName=(?<login>[^\s]*)May 2 16:41:40 category=KL_IoT_Hash_MD5 matchedIndicator=0D68EE713180A5BF73F7C74CE00F067D2BE5CF7C url=- src=- ip=- md5=- sha1=0D68EE713180A5BF73F7C74CE00F067D2BE5CF7C sha256=- usrName=- IP=104.27.174.162, 104.27.175.162, 188.166.67.166, 193.176.84.67, 185.232.23.3, 5.182.27.20, 178.128.153.190, 78.24.218.108, 158.58.172.76, 2.59.214.27 files=[{ MD5=DAFECEDABFE0F3AB372A7C83B84CEFF6 SHA1=0D68EE713180A5BF73F7C74CE00F067D2BE5CF7C SHA256=7DD78D2CBFF85A80954558C5C01986FC5D9099C87ECE796A374626EB76BE037D threat=HEUR:Trojan.Win32.Generic}] first_seen=01.04.2019 18:17 geo=ru, kz, ua, by, de, lt, ro, pl, md, it id=30341045 last_seen=23.05.2019 14:19 mask=sama-berli.info popularity=5 type=1 whois={ NS=dora.ns.cloudflare.com, zod.ns.cloudflare.com NS_ips=173.245.58.108, 173.245.59.250 country=UA created=24.01.2019 domain=sama-berli.info expires=24.01.2020 org=ZAO Sigva registrar_email=abuse@reg.ru registrar_name=Limited Liability Company "Registrar of domain names REG.RU" updated=29.03.2019} - KL_IoT_Hash_SHA256
Regular expression
Event example for checking regular expressions
category=KL_IoT_URL.*url=(?<url>[^\s]*).*usrName=(?<login>[^\s]*)May 2 16:41:40 category=KL_IoT_Hash_SHA256 matchedIndicator=7DD78D2CBFF85A80954558C5C01986FC5D9099C87ECE796A374626EB76BE037D url=- src=- ip=- md5=- sha1=- sha256=7DD78D2CBFF85A80954558C5C01986FC5D9099C87ECE796A374626EB76BE037D usrName=- IP=104.27.174.162, 104.27.175.162, 188.166.67.166, 193.176.84.67, 185.232.23.3, 5.182.27.20, 178.128.153.190, 78.24.218.108, 158.58.172.76, 2.59.214.27 files=[{ MD5=DAFECEDABFE0F3AB372A7C83B84CEFF6 SHA1=0D68EE713180A5BF73F7C74CE00F067D2BE5CF7C SHA256=7DD78D2CBFF85A80954558C5C01986FC5D9099C87ECE796A374626EB76BE037D threat=HEUR:Trojan.Win32.Generic}] first_seen=01.04.2019 18:17 geo=ru, kz, ua, by, de, lt, ro, pl, md, it id=30341045 last_seen=23.05.2019 14:19 mask=sama-berli.info popularity=5 type=1 whois={ NS=dora.ns.cloudflare.com, zod.ns.cloudflare.com NS_ips=173.245.58.108, 173.245.59.250 country=UA created=24.01.2019 domain=sama-berli.info expires=24.01.2020 org=ZAO Sigva registrar_email=abuse@reg.ru registrar_name=Limited Liability Company "Registrar of domain names REG.RU" updated=29.03.2019} - KL_IoT_URL
Regular expression
Event example for checking regular expressions
category=KL_IoT_Hash_SHA256.*sha256=(?<object>[^\s]*).*usrName=(?<login>[^\s]*)May 2 16:41:40 category=KL_IoT_URL matchedIndicator=fakess123r.nu url=fakess123r.nu src=192.168.0.0 ip=- md5=- sha1=- sha256=- usrName=VerifTestUserName first_seen=10.08.2016 14:18 id=0 last_seen=22.12.2017 15:12 mask=fakess123r.nu popularity=1 type=1 - KL_Vulnerable_File_Hash_MD5
Regular expression
Event example for checking regular expressions
category=KL_Vulnerable_File_Hash_MD5.*md5=(?<object>[^\s]*).*usrName=(?<login>[^\s]*)May 2 16:41:40 category=KL_Vulnerable_File_Hash_MD5 matchedIndicator=DAFECEDABFE0F3AB372A7C83B84CEFF6 url=- src=- ip=- md5=DAFECEDABFE0F3AB372A7C83B84CEFF6 sha1=- sha256=- usrName=- IP=104.27.174.162, 104.27.175.162, 188.166.67.166, 193.176.84.67, 185.232.23.3, 5.182.27.20, 178.128.153.190, 78.24.218.108, 158.58.172.76, 2.59.214.27 files=[{ MD5=DAFECEDABFE0F3AB372A7C83B84CEFF6 SHA1=0D68EE713180A5BF73F7C74CE00F067D2BE5CF7C SHA256=7DD78D2CBFF85A80954558C5C01986FC5D9099C87ECE796A374626EB76BE037D threat=HEUR:Trojan.Win32.Generic}] first_seen=01.04.2019 18:17 geo=ru, kz, ua, by, de, lt, ro, pl, md, it id=30341045 last_seen=23.05.2019 14:19 mask=sama-berli.info popularity=5 type=1 whois={ NS=dora.ns.cloudflare.com, zod.ns.cloudflare.com NS_ips=173.245.58.108, 173.245.59.250 country=UA created=24.01.2019 domain=sama-berli.info expires=24.01.2020 org=ZAO Sigva registrar_email=abuse@reg.ru registrar_name=Limited Liability Company "Registrar of domain names REG.RU" updated=29.03.2019} - KL_Vulnerable_File_Hash_SHA1
Regular expression
Event example for checking regular expressions
category=KL_Vulnerable_File_Hash_SHA1.*sha1=(?<object>[^\s]*).*usrName=(?<login>[^\s]*)May 2 16:41:40 category=KL_Vulnerable_File_Hash_SHA1 matchedIndicator=0D68EE713180A5BF73F7C74CE00F067D2BE5CF7C url=- src=- ip=- md5=- sha1=0D68EE713180A5BF73F7C74CE00F067D2BE5CF7C sha256=- usrName=- IP=104.27.174.162, 104.27.175.162, 188.166.67.166, 193.176.84.67, 185.232.23.3, 5.182.27.20, 178.128.153.190, 78.24.218.108, 158.58.172.76, 2.59.214.27 files=[{ MD5=DAFECEDABFE0F3AB372A7C83B84CEFF6 SHA1=0D68EE713180A5BF73F7C74CE00F067D2BE5CF7C SHA256=7DD78D2CBFF85A80954558C5C01986FC5D9099C87ECE796A374626EB76BE037D threat=HEUR:Trojan.Win32.Generic}] first_seen=01.04.2019 18:17 geo=ru, kz, ua, by, de, lt, ro, pl, md, it id=30341045 last_seen=23.05.2019 14:19 mask=sama-berli.info popularity=5 type=1 whois={ NS=dora.ns.cloudflare.com, zod.ns.cloudflare.com NS_ips=173.245.58.108, 173.245.59.250 country=UA created=24.01.2019 domain=sama-berli.info expires=24.01.2020 org=ZAO Sigva registrar_email=abuse@reg.ru registrar_name=Limited Liability Company "Registrar of domain names REG.RU" updated=29.03.2019} - KL_Vulnerable_File_Hash_SHA256
Regular expression
Event example for checking regular expressions
category=KL_Vulnerable_File_Hash_SHA256.*sha256=(?<object>[^\s]*).*usrName=(?<login>[^\s]*)May 2 16:41:40 category= KL_Vulnerable_File_Hash_SHA256 matchedIndicator=7DD78D2CBFF85A80954558C5C01986FC5D9099C87ECE796A374626EB76BE037D url=- src=- ip=- md5=- sha1=- sha256=7DD78D2CBFF85A80954558C5C01986FC5D9099C87ECE796A374626EB76BE037D usrName=- IP=104.27.174.162, 104.27.175.162, 188.166.67.166, 193.176.84.67, 185.232.23.3, 5.182.27.20, 178.128.153.190, 78.24.218.108, 158.58.172.76, 2.59.214.27 files=[{ MD5=DAFECEDABFE0F3AB372A7C83B84CEFF6 SHA1=0D68EE713180A5BF73F7C74CE00F067D2BE5CF7C SHA256=7DD78D2CBFF85A80954558C5C01986FC5D9099C87ECE796A374626EB76BE037D threat=HEUR:Trojan.Win32.Generic}] first_seen=01.04.2019 18:17 geo=ru, kz, ua, by, de, lt, ro, pl, md, it id=30341045 last_seen=23.05.2019 14:19 mask=sama-berli.info popularity=5 type=1 whois={ NS=dora.ns.cloudflare.com, zod.ns.cloudflare.com NS_ips=173.245.58.108, 173.245.59.250 country=UA created=24.01.2019 domain=sama-berli.info expires=24.01.2020 org=ZAO Sigva registrar_email=abuse@reg.ru registrar_name=Limited Liability Company "Registrar of domain names REG.RU" updated=29.03.2019}
Step 5. Adding Kaspersky CyberTrace policy
This section describes how you can add a Kaspersky CyberTrace policy to LogRhythm.
To add a Kaspersky CyberTrace policy to LogRhythm:
- Run LogRhythm Console.
- Select Deployment Manager > Log Processing Policies.
- Click the New button ().
The Log Source Type Selector window opens.
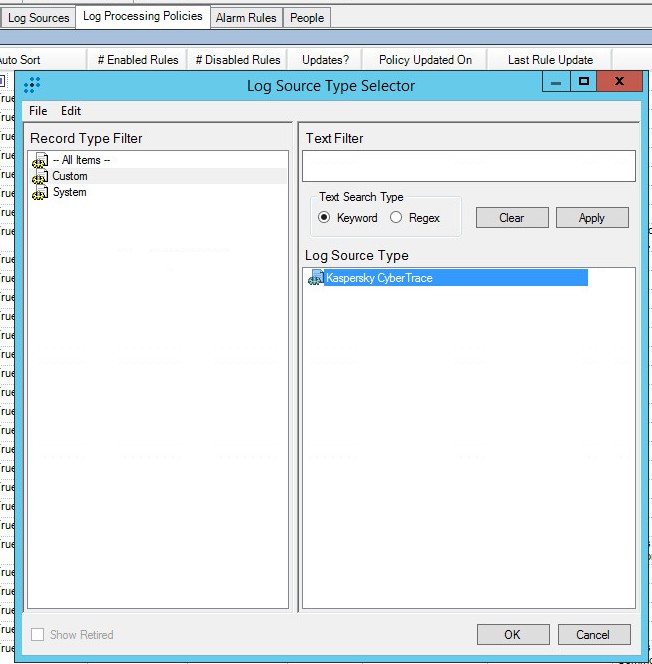
Log Source Type Selector window
- In the Log Source Type list, select Kaspersky CyberTrace.
- Click OK.
- In the MPE Policy Editor window that opens, in the Name field, type the policy name (
CyberTrace Policy).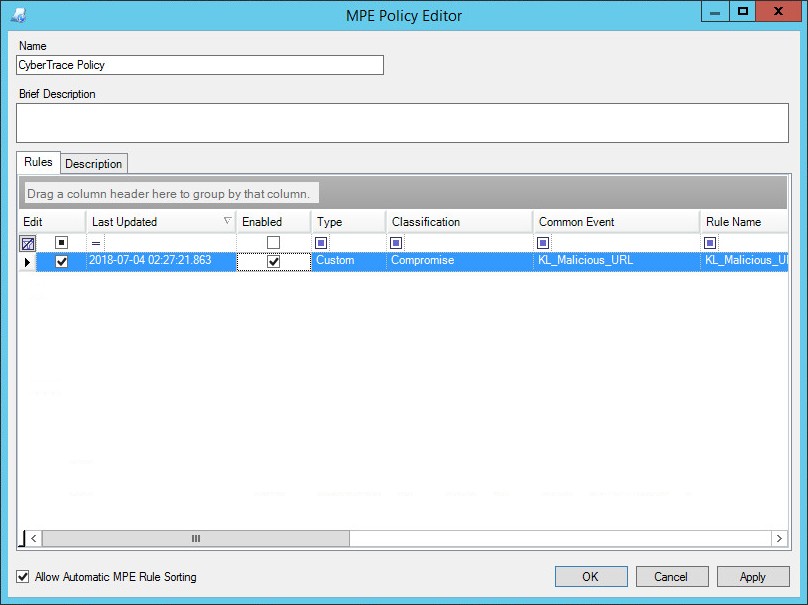
MPE Policy Editor window
- On the Rules tab, edit the properties of the Kaspersky CyberTrace events:
- Select all the check boxes for every event.
- Right-click in the table and select Properties.
The MPE Policy Rule Editor window opens.
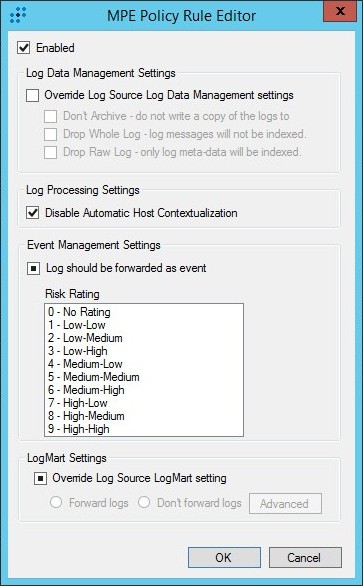
MPE Policy Rule Editor window
- In the MPE Policy Rule Editor window, select the Enabled check box but make no changes to the other check boxes.
- Click OK.
Step 6. Adding a log source to System Monitor Agent
This section describes the actions to perform so that a new log source pertaining to Kaspersky CyberTrace will appear in LogRhythm. If LogRhythm is already configured properly, you do not need to take action, as the new log source will appear in LogRhythm and you only have to check that everything is as you specified.
To create conditions for a log source pertaining to Kaspersky CyberTrace to be added to LogRhythm:
- Run LogRhythm Console.
- Select Deployment Manager > System Monitors > Agent > Properties.
The System Monitor Agent Properties window opens.
- Select the Syslog and Flow Settings tab.
- Select the Enable Syslog Server checkbox.
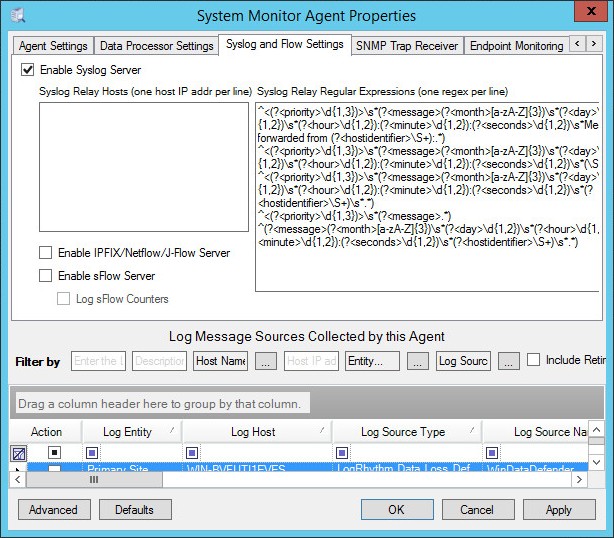
System Monitor Agent Properties window
- Click OK.
- Turn off Windows Firewall or add exclusions to it so that incoming SYSLOG events can arrive.
- Select Deployment Manager > Data Processors > Properties > Advanced.
The Data Processor Advanced Properties window opens.
- In the table, select the following items. Property names are in the Name column and the Value column contains the checkboxes to be selected:
- AutomaticLogSourceConfigurationNetFlow
- AutomaticLogSourceConfigurationsFlow
- AutomaticLogSourceConfigurationSNMPTrap
- AutomaticLogSourceConfigurationSyslog
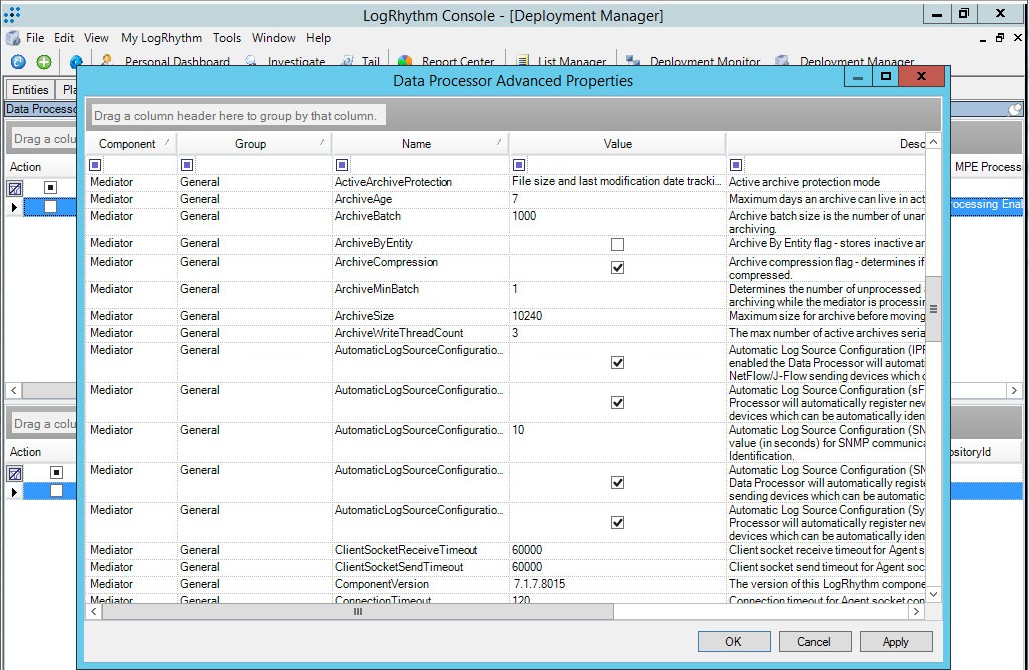
Data Processor Advanced Properties window
- Click OK.
- Restart LogRhythm if necessary.
LogRhythm will inform you whether a restart is required.
After Kaspersky CyberTrace sends an event, a new item appears on the Log Sources tab.
To accept the new log source:
- Right-click the new item, and then select Actions > Resolve Log Source Hosts.
- Double-click the new item.
The Log Source Acceptance Properties window opens.
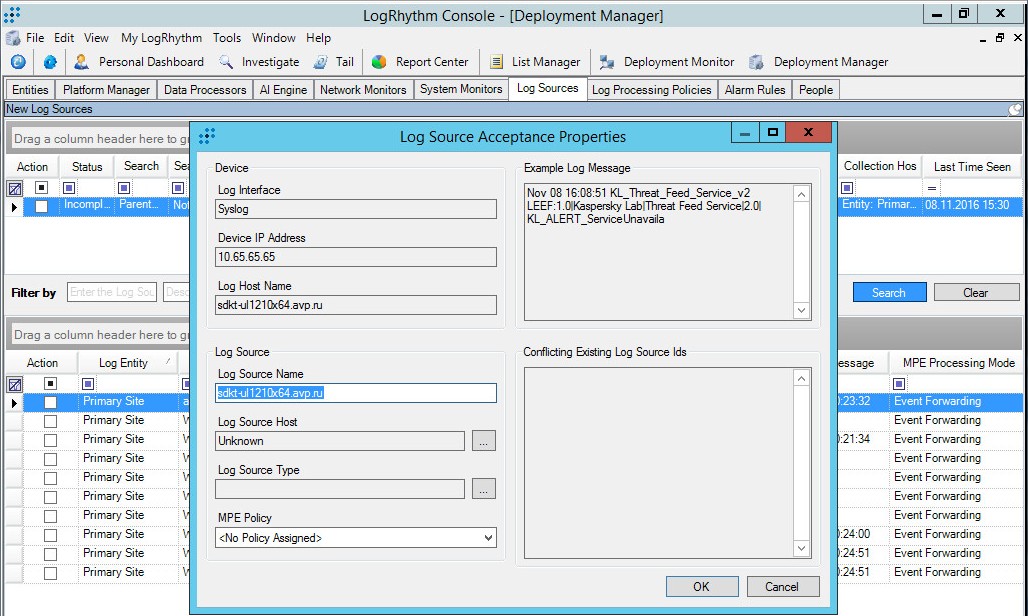
Log Source Acceptance Properties window
- Edit the properties:
- Specify the log source host.
- Specify
Kaspersky CyberTraceas the log source type. - Specify the MPE policy that you added in step 4.
- Click OK.
- If an error message appears saying that you cannot use an unknown log source host, add a new entity as follows:
- In LogRhythm Console, select the Entities tab.
- Click the New Child Entity toolbar button.
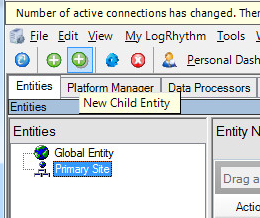
- In the Entity Properties window that opens, specify the entity properties.
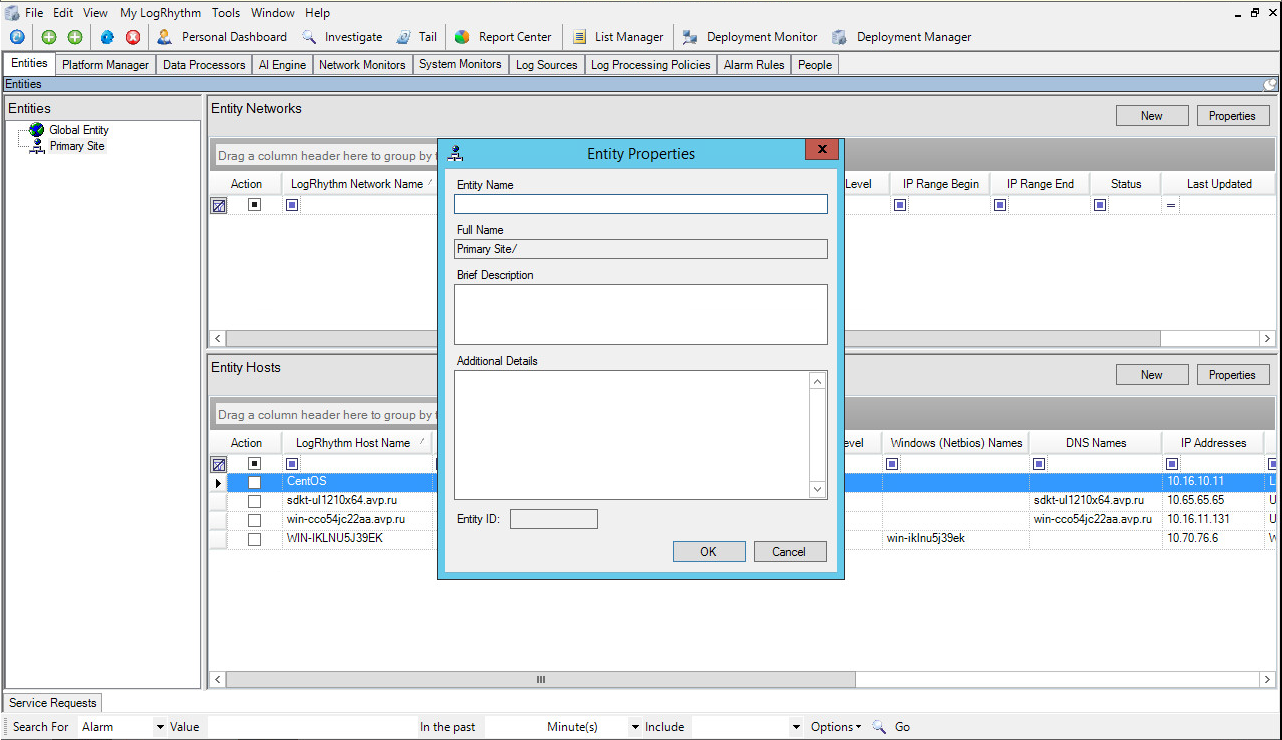
The entity name must be unique and non-empty. Other entity properties can be arbitrary.
- Click OK.
- Repeat the action in step 3 by using the created entity as the log source host.
- Select the Action checkbox.
- Right-click the log source, and then select Actions > Accept > Defaults.
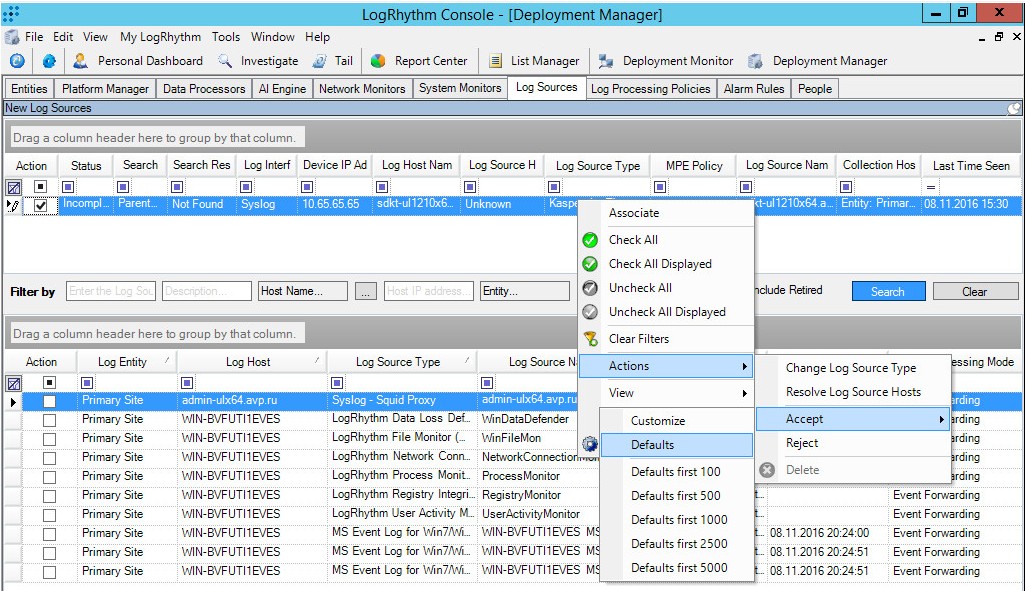
Log source context menu
The new log source now appears in the lower table in LogRhythm Console.
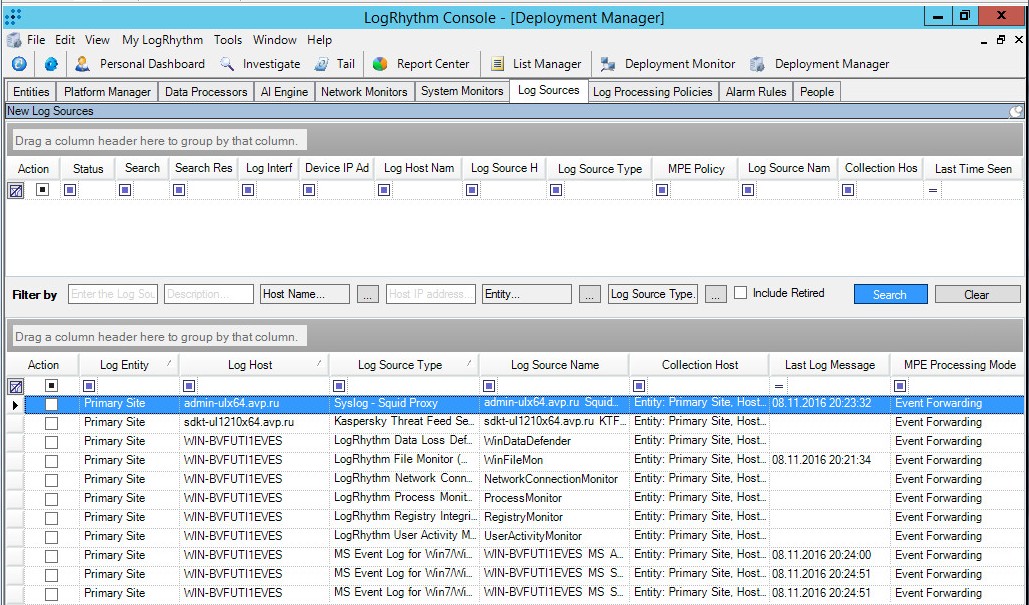
New log source
Disabling log forwarding for the events received from Kaspersky CyberTrace
You may need to disable log forwarding for the events received from Kaspersky CyberTrace, to avoid the looping of events, which is forwarding the received events back to Kaspersky CyberTrace.
To disable log forwarding for the events received from Kaspersky CyberTrace:
- On the Log Sources tab, select the checkbox of the log source associated with Kaspersky CyberTrace.
- Right-click the log source, and then select Actions > Edit properties.
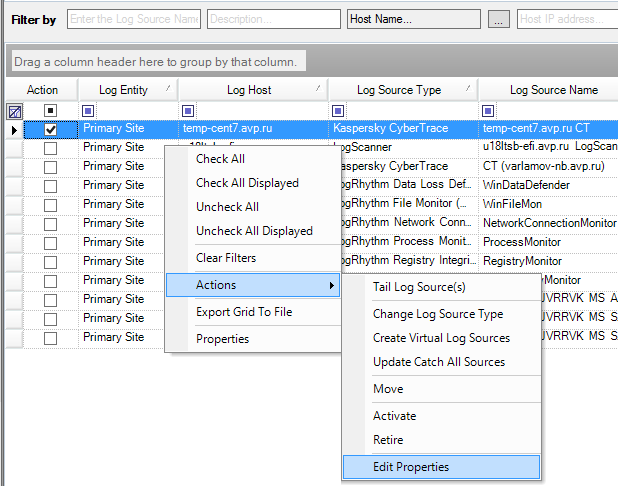
Editing the properties of the Kaspersky CyberTrace log source
- The Log Message Source Properties window opens. In the Log Message Processing Mode drop-down list, select MPE Processing Enabled, Event Forwarding Disabled, and then click OK.
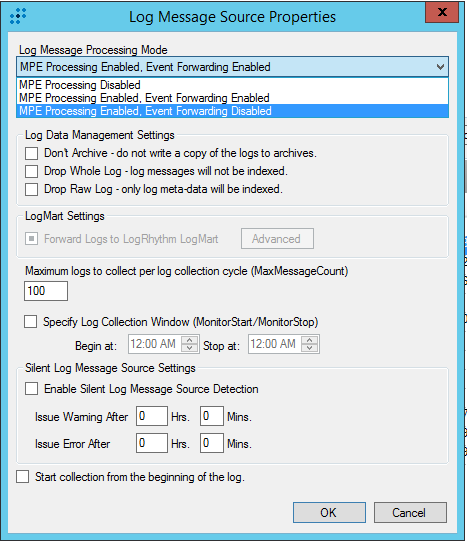
Specifying the log message processing mode
In the MPE Processing Mode column, No Event Forwarding will be displayed for the selected log source.
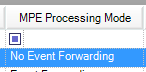
The MPE Processing Mode column
Page topStep 7. Configuring log forwarding to Kaspersky CyberTrace
This section explains how to configure LogRhythm to forward logs to Kaspersky CyberTrace. Configuring LogRhythm includes adding a log receiver and adding a log distribution pollicy.
Adding a log receiver
In LogRhythm, create a new log receiver. This log receiver will represent Kaspersky CyberTrace.
To add a log receiver to LogRhythm:
- Run LogRhythm Console.
- Select Deployment Manager > Tools > Distribution > Log Distribution Services > Receiver Manager.
The Log Distribution Receiver Manager window opens.
- Select File > New.
- Fill in the fields of the Syslog Receiver Properties window that opens:
- Specify the IP address of the remote host on which Kaspersky CyberTrace is installed (the IP address specified in the
InputSettings > ConnectionStringelement of the Feed Service configuration file). - Specify the remote port that Kaspersky CyberTrace listens on for events (the port specified in the
InputSettings > ConnectionStringelement of the Feed Service configuration file). - Change Network Protocol to TCP.
- Specify the IP address of the remote host on which Kaspersky CyberTrace is installed (the IP address specified in the
- Click OK.
- After a new row appears in the table, right-click the row and select Enabled.
Adding a log distribution policy
After the log receiver is added, set the conditions by adding a log distribution policy for events to be forwarded to Kaspersky CyberTrace.
To add a log distribution policy:
- Select Deployment Manager > Tools > Distribution > Log Distribution Services > Policy Manager.
- In the Log Distribution Policy Manager window that opens, select File > New.
The Log Distribution Policy Wizard starts.
- Follow the instructions of the Wizard.
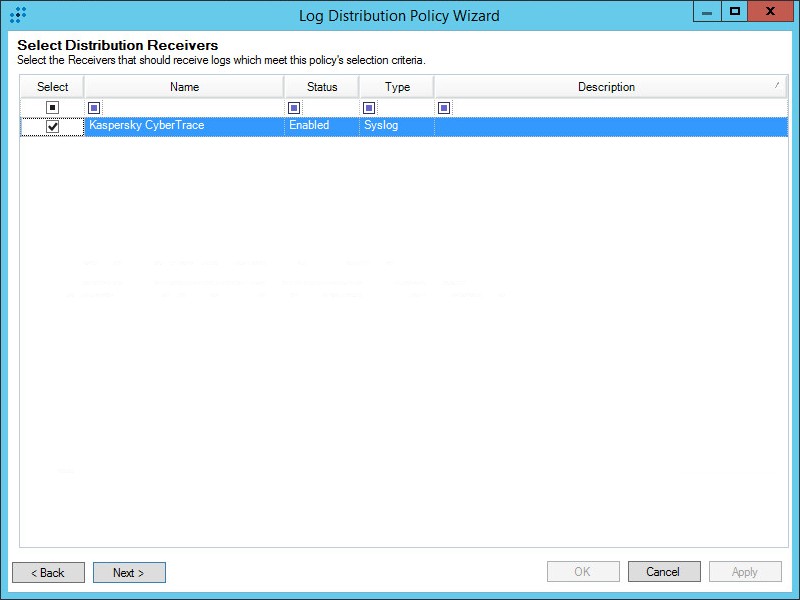
Log Distribution Policy Wizard
- In the Select Distribution Receivers table, select the
Kaspersky CyberTraceitem that was created previously. - Select the log sources that can send URLs, hashes, and IP addresses.
After the Log Distribution Policy Wizard finishes, the new row appears in the table.
- In the Select Distribution Receivers table, select the
- Right-click the new row in the table and select Enabled.
The computer on which Kaspersky CyberTrace is installed will now receive logs. You can check this by using the netcat utility.
Displaying detection events in LogRhythm
As a result of the above actions, LogRhythm will receive and display detection events. Also, the events will appear in the web console, which is available at https://<logrhythmIP>:8443 or at https://<logrhythmIP>:80.
Step 8 (optional). Performing the verification test
This section explains how to verify that Kaspersky CyberTrace has been integrated with LogRhythm correctly by performing the verification test.
To create the conditions for performing the verification test:
- Create a custom log source type, as described in section "Step 1. Adding a Custom Log Source type", with the following parameters:
Field
Data
Name
Kaspersky LogScanner
Full Name
Kaspersky LogScanner
Abbreviation
LogScanner
Log Format
Syslog
Brief Description
Kaspersky LogScanner is a command-line application that allows you to send data to Feed Service for checking against feeds.
- Add a new common event, as described in section "Step 3 (optional). Adding Kaspersky CyberTrace events", with the following parameters:
Field
Data
Name
LogScanner_event
Classification
Audit : Other Audit
Brief Description
LogScanner event for verification purposes
Risk Rating
Low-Low
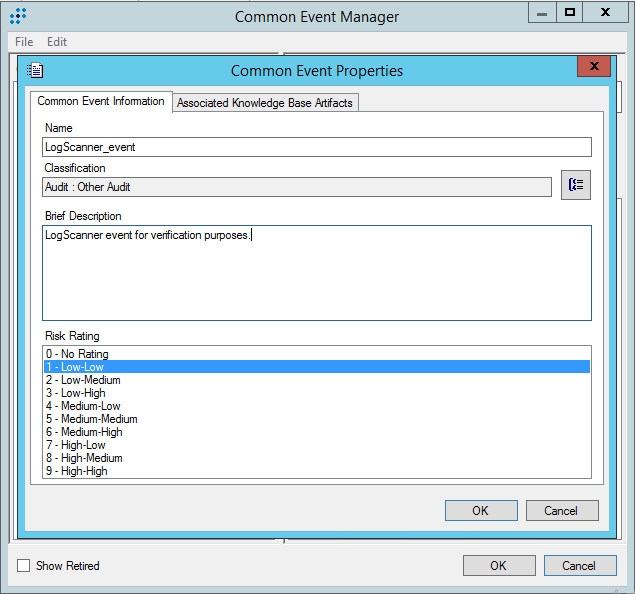
Common Event Properties window
- Add an MPE rule for Log Scanner, as described in section "Step 4 (optional). Adding Kaspersky CyberTrace rules", using the following parameters:
- In the Log Message Source Type Associations tree pane, select Kaspersky LogScanner.
- Specify
LogScanner_eventas the Rule Name. - In the Common Event drop-down list, select LogScanner_event.
- In Rule Status, select Production.
- In Base-Rule Regular Expression, type '
.*'.
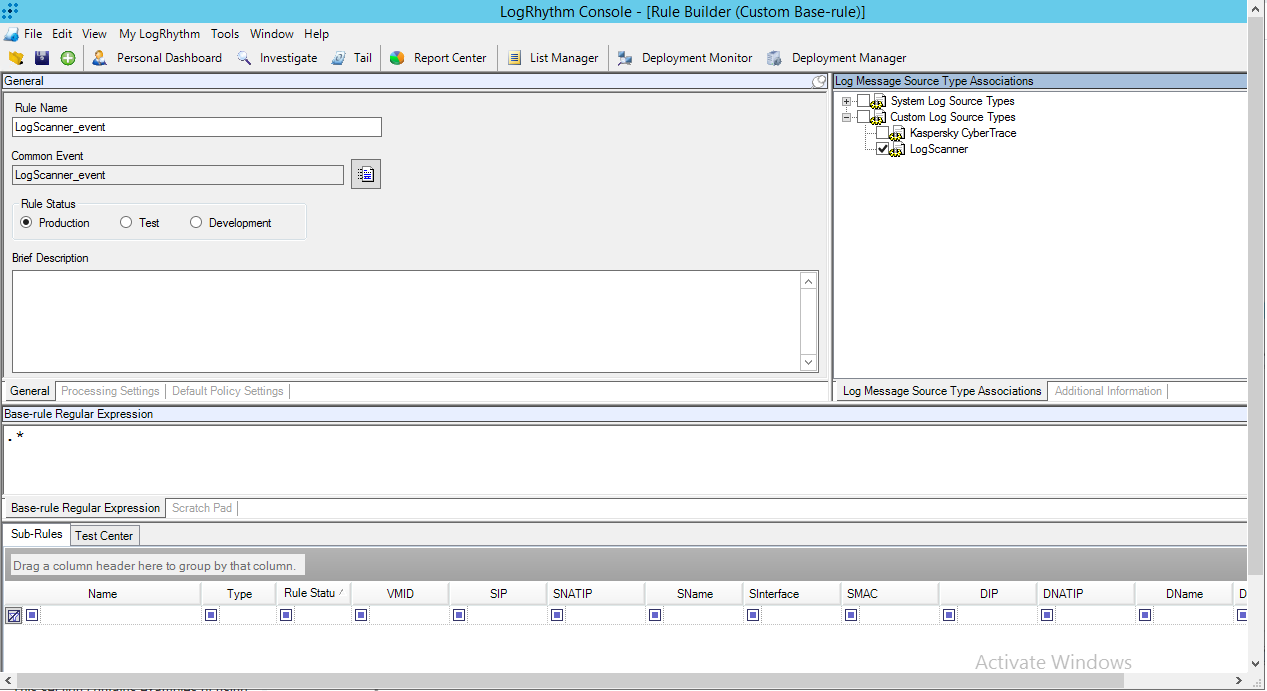
Rule builder form
- Create a new policy for Kaspersky Log Scanner, as described in section "Step 5. Adding Kaspersky CyberTrace policy".
In the Log Source Type list, select Kaspersky LogScanner. Specify all other parameters, as described in section "Step 5. Adding Kaspersky CyberTrace policy".
- Add a log source to System Monitor Agent:
- In the Log Scanner configuration file, specify the IP address of the computer on which LogRhythm runs and port
514. - Send the
%service_dir%/verification/kl_verification_test_cef.txtfile to LogRhythm.- For this purpose, run the following command (in Linux):
./log_scanner -p ../verification/kl_verification_test_cef.txt - For this purpose, run the following command (in Windows):
log_scanner.exe -p ..\verification\kl_verification_test_cef.txt
- For this purpose, run the following command (in Linux):
- In the Log Scanner configuration file, specify the IP address of the computer on which LogRhythm runs and port
After Kaspersky Log Scanner sends an event, a new item will appear on the Log Sources tab.
To accept the new log source:
- Right-click the new item, and then select Actions > Resolve Log Source Hosts.
- Double-click the new item.
The Log Source Acceptance Properties window opens.
Log Source Acceptance Properties window
- Edit the properties:
- Specify the log source host.
- Specify
Kaspersky LogScanneras the log source type. - Select the MPE policy that you previously created for Kaspersky Log Scanner.
- Click OK.
- If an error message appears saying that you cannot use an unknown log source host, add a new entity as follows:
- In LogRhythm Console, select the Entities tab.
- Click the New Child Entity toolbar button.
- In the Entity Properties window that opens, specify the entity properties.
The entity name must be unique and non-empty. Other entity properties can be arbitrary.
- Click OK.
- Repeat the action in step 3 by using the created entity as the log source host.
- Select the Action check box.
- Right-click the log source, and then select Actions > Accept > Defaults.
Log source context menu
The new log source now appears in the lower table in LogRhythm Console.
New log source
- Reload LogRhythm.
If you have previously configured log forwarding, as described in section "Step 7. Configuring log forwarding to Kaspersky CyberTrace", make sure that you have Kaspersky LogScanner selected as a Log source (see subsection "Adding a log distribution policy").
To perform the verification test:
Resend the %service_dir%/verification/kl_verification_test_cef.txt file to LogRhythm.
- For this purpose, run the following command (in Linux):
./log_scanner -p ../verification/kl_verification_test_cef.txt - For this purpose, run the following command (in Windows):
log_scanner.exe -p ..\verification\kl_verification_test_cef.txt
If the integration of Kaspersky CyberTrace with LogRhythm has been configured properly, test events from Log Scanner will be forwarded to Kaspersky CyberTrace automatically. Then, the alert events from Kaspersky CyberTrace will be sent to LogRhythm. The number of detections may vary depending on enabled Kaspersky Threat Data Feeds. The alert events can be displayed in the LogRhythm web console, as described in section "Step 10 (optional). Displaying alert events in LogRhythm".
Page topStep 9 (optional). Creating alerts about incoming Kaspersky CyberTrace service events
You can create notifications about incoming Kaspersky CyberTrace service events by configuring alert rules.
To create notifications about service events from Kaspersky CyberTrace in LogRhythm:
- Run LogRhythm Console.
- Select Deployment Manager > Alarm Rules and click New.
- In the Create Global Rule confirmation window, click Yes if you want to give access to manage this rule for all users with the Global Admin role. Click No, if you want to manage this rule only by yourself.
- Perform the following actions for each tab at the bottom of the page:
- On the Primary Criteria tab, do the following:
- Click New, and select the Common Event value in the Add New Field Filter drop-down list.
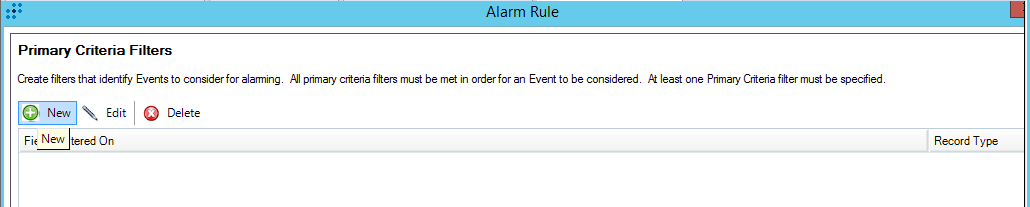
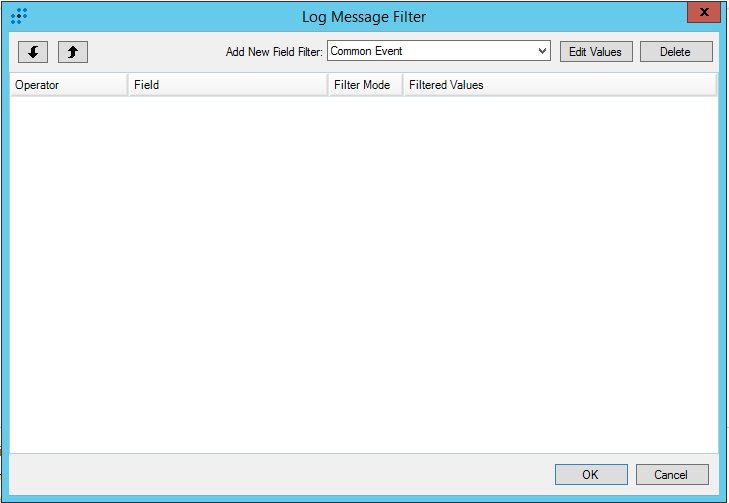
- Click Edit values.
The Field Filter Values window opens.
- In the Field Filter Values window, click Add Item.
- Select the name of the Kaspersky CyberTrace service event from the list. If such events are absent, add them as described in the "Adding Kaspersky CyberTrace events" section.
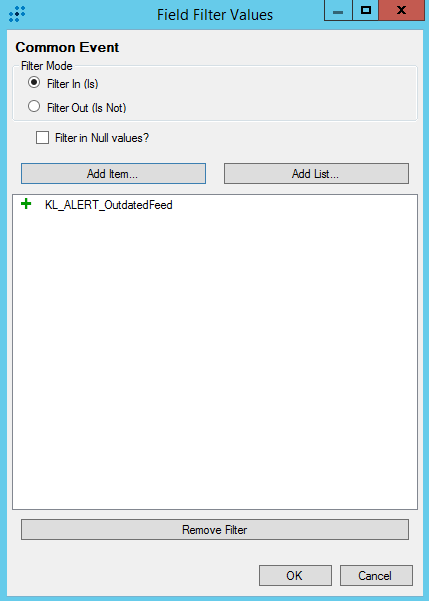
- Click OK.
- Click New, and select the Common Event value in the Add New Field Filter drop-down list.
- Leave the Include Filters, Exclude Filters and Day and Time Criteria tabs unchanged.
- On the Log Source Criteria tab, check Include the Selected Log Sources and then click Add.
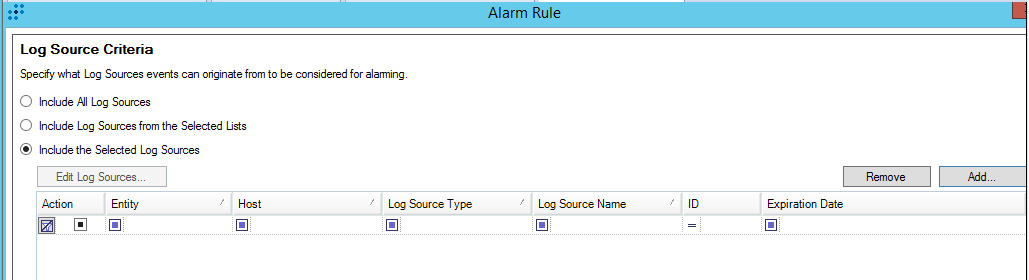
The Alarm Rule window
- Select a source that corresponds to Kaspersky CyberTrace and click OK. For information on how to add Kaspersky CyberTrace event source, see section "Adding a log source to System Monitor Agent".
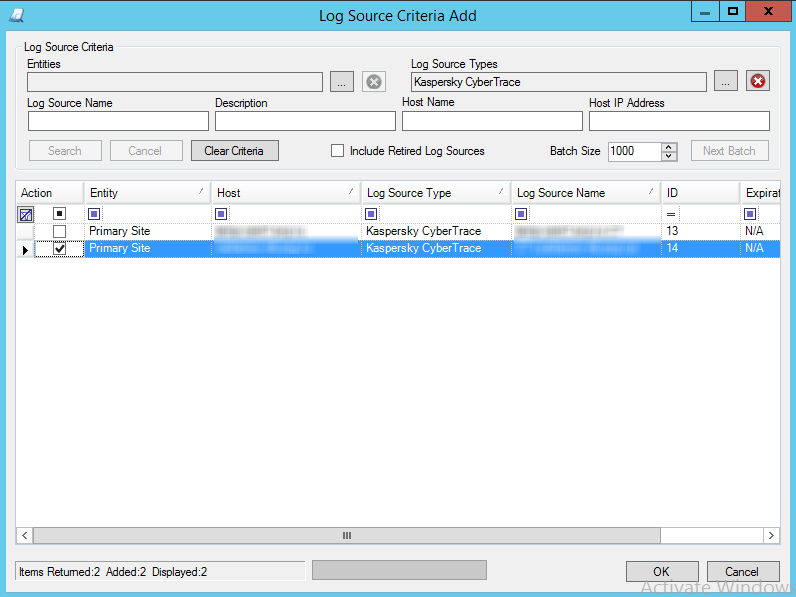
The Log Source Criteria Add window
- Leave the Aggregation tab unchanged.
- In the Settings tab, specify a period of time during which identical alerts that are associated with the occurrence of any new service events from Kaspersky CyberTrace have to be suppressed.
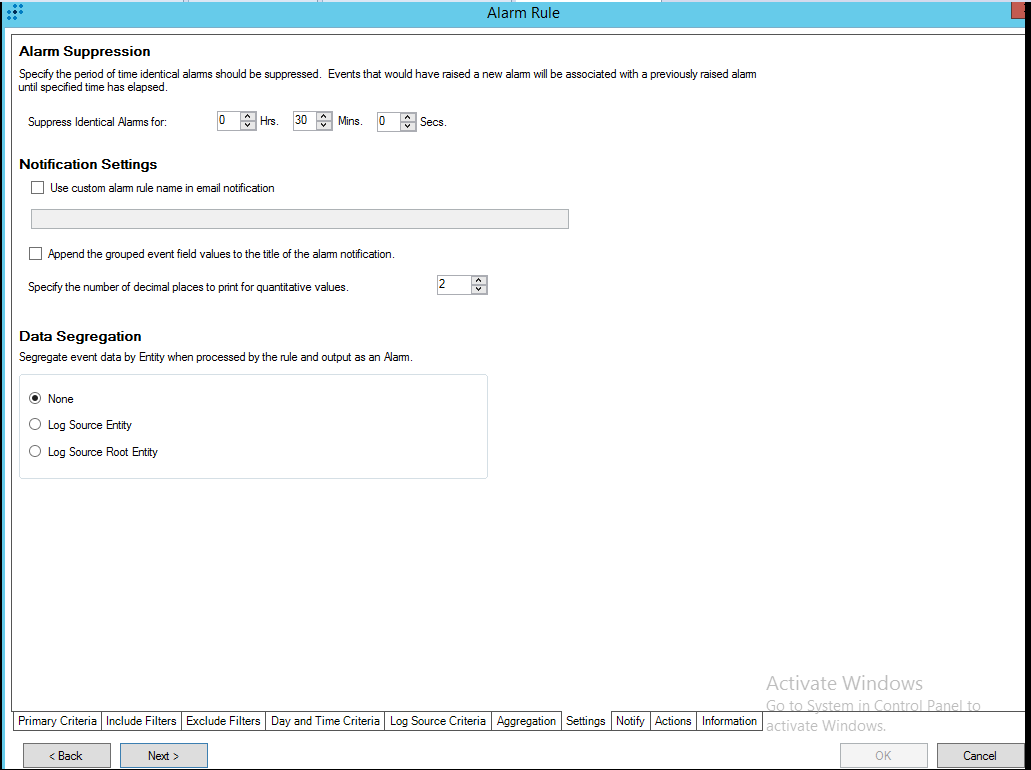
Alert suppression settings
- On the Notify tab, select a role or user you want to address notifications.
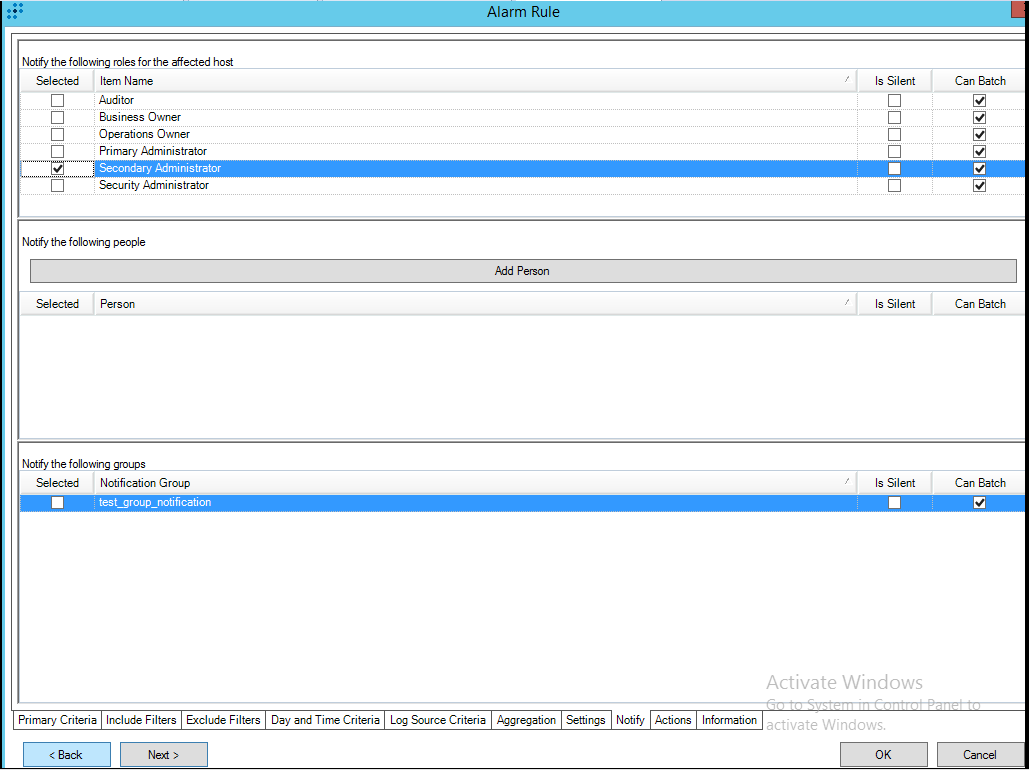
Choosing the roles to notificate
- Leave the Actions tab unchanged.
- On the Information tab, specify the name of the rule and its description.
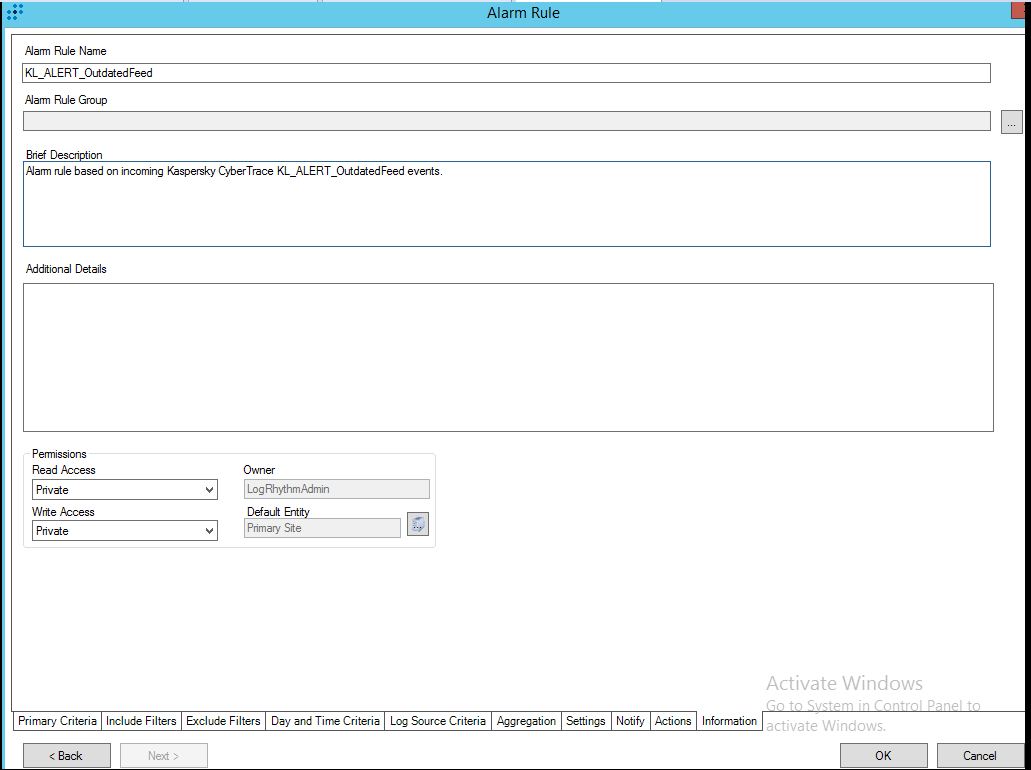
Alarm Rule Name/Brief Description
- On the Primary Criteria tab, do the following:
- Click OK.
- On the Alarm Rules tab, right-click the new rule and select Actions > Enable.
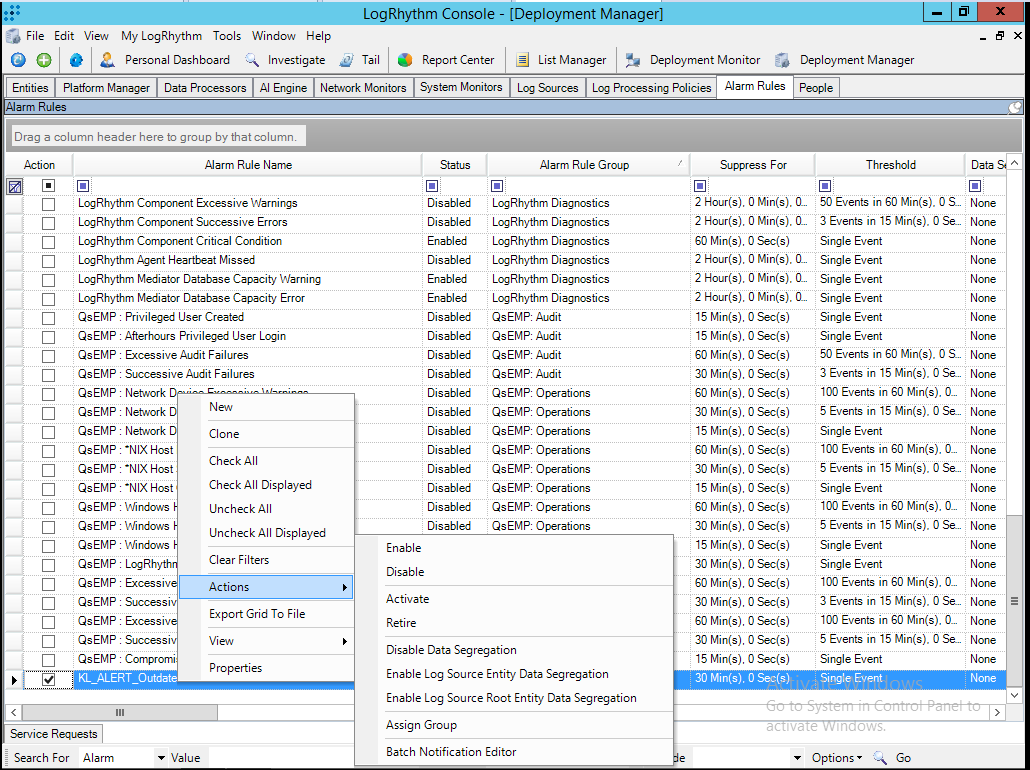
Enabling a rule
- Configure display of the alerts in the LogRhythm web console as described in section "Step 10 (optional). Displaying alert events in LogRhythm".
Step 10 (optional). Displaying alert events in LogRhythm
You can configure the LogRhythm web console so that it will display alert events together with detection events.
To configure the web console for displaying alert events:
- In the web console, click Search.
- Click Log Source Filter.
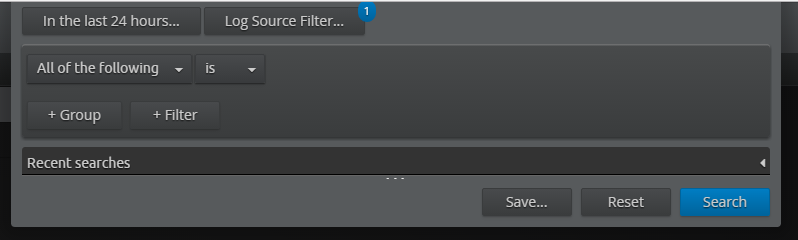
Search form
- Type
CyberTraceas the search string. - Move the search filter that is found to the right column by clicking the arrow (+).
- Click OK.
- After a new search has finished, open the result window.
The LogRhythm web console will display detection events together with alert events in the search result window.
Page topIntegration with KUMA
Kaspersky Unified Monitoring and Analysis Platform (KUMA) is a SIEM solution developed by Kaspersky that provides real-time analysis of security events generated by any data source, such as applications or network hardware.
For information on how to configure KUMA for integration with Kaspersky CyberTrace, see Kaspersky Unified Monitoring and Analysis Platform Online Help.
Page topIntegrating with other SIEM and non-SIEM solutions
This section describes how to check your data against feeds if you do not use a SIEM solution or use a solution that is not yet supported by CyberTrace.
You can check your data against feeds using Log Scanner.
Performing the verification test (other SIEM and non-SIEM solutions)
The Kaspersky CyberTrace distribution kit contains text files in the verification directory. You can use these files for testing whether Kaspersky CyberTrace is integrated correctly with the event target software.
To check the integration of Kaspersky CyberTrace with the event target software:
- Send the
kl_verification_test_cef.txtfile from theverificationdirectory to Feed Service by using Log Scanner.In Linux:
./log_scanner -p ../verification/kl_verification_test_cef.txtIn Windows:
log_scanner.exe -p ..\verification\kl_verification_test_cef.txtFeed Service will check the data that is contained in the input file.
If you specify the
-rflag in this command, the test results are written to the Log Scanner report file. If you do not specify the-rflag, the test results are sent to the event target software by using the parameters for outbound events specified in the Service settings of Kaspersky CyberTrace. - Make sure that the event target software has received events according to the table below.
Verification test results
The verification test results depends on the feeds you use. The following table summarizes target numbers for the verification test when all commercial feeds are used.
Verification test results (commercial feeds)
Feed used |
eventName value |
Detected objects |
Malicious URL Data Feed |
KL_Malicious_URL |
http://fakess123.nu http://badb86360457963b90faac9ae17578ed.com |
Phishing URL Data Feed |
KL_Phishing_URL |
http://fakess123ap.nu http://e77716a952f640b42e4371759a661663.com |
Botnet CnC URL Data Feed |
KL_BotnetCnC_URL |
http://fakess123bn.nu http://a7396d61caffe18a4cffbb3b428c9b60.com |
IP Reputation Data Feed |
KL_IP_Reputation |
192.0.2.0 192.0.2.3 |
Malicious Hash Data Feed |
KL_Malicious_Hash_MD5 |
FEAF2058298C1E174C2B79AFFC7CF4DF 44D88612FEA8A8F36DE82E1278ABB02F C912705B4BBB14EC7E78FA8B370532C9 |
Mobile Malicious Hash Data Feed |
KL_Mobile_Malicious_Hash_MD5 |
60300A92E1D0A55C7FDD360EE40A9DC1 |
Mobile Botnet CnC URL Data Feed |
KL_Mobile_BotnetCnC_Hash_MD5 |
001F6251169E6916C455495050A3FB8D |
Mobile Botnet CnC URL Data Feed |
KL_Mobile_BotnetCnC_URL |
http://sdfed7233dsfg93acvbhl.su/steallallsms.php |
Ransomware URL Data Feed |
KL_Ransomware_URL |
http://fakess123r.nu http://fa7830b4811fbef1b187913665e6733c.com |
Vulnerability Data Feed |
KL_Vulnerable_File_Hash_MD5 |
D8C1F5B4AD32296649FF46027177C594 |
APT URL Data Feed |
KL_APT_URL |
http://b046f5b25458638f6705d53539c79f62.com |
APT Hash Data Feed |
KL_APT_Hash_MD5 |
7A2E65A0F70EE0615EC0CA34240CF082 |
APT IP Data Feed |
KL_APT_IP |
192.0.2.4 |
IoT URL Data Feed |
KL_IoT_URL |
http://e593461621ee0f9134c632d00bf108fd.com/.i |
ICS Hash Data Feed |
KL_ICS_Hash_MD5 |
7A8F30B40C6564EFF95E678F7C43346C |
The following table summarizes target numbers for the verification test when only demo feeds are used.
Verification test results (demo feeds)
Feed used |
eventName value |
Detected objects |
DEMO Botnet_CnC_URL_Data_Feed |
KL_BotnetCnC_URL |
http://5a015004f9fc05290d87e86d69c4b237.com http://fakess123bn.nu |
DEMO IP_Reputation_Data_Feed |
KL_IP_Reputation |
192.0.2.1 192.0.2.3 |
DEMO Malicious_Hash_Data_Feed |
KL_Malicious_Hash_MD5 |
776735A8CA96DB15B422879DA599F474 FEAF2058298C1E174C2B79AFFC7CF4DF 44D88612FEA8A8F36DE82E1278ABB02F |
Extra integration scenarios
This section describes additional installation and integration scenarios.
Separate installation of Feed Service and Feed Utility (Windows)
You can install Feed Service and Feed Utility on separate computers. This allows you to isolate the computer, on which event data is matched against feeds, from the Internet.
Do not delete the dmz directory from the distribution kit of Kaspersky CyberTrace, even if you do not plan to use Feed Service and Feed Utility on separate computers.
You can install Feed Utility on a Linux computer. For this you must have the distribution package for Linux, which also contains the instructions on how to perform the installation.
How Feed Service and Feed Utility work in DMZ
The following diagram describes how Feed Service and Feed Utility work in the DMZ.
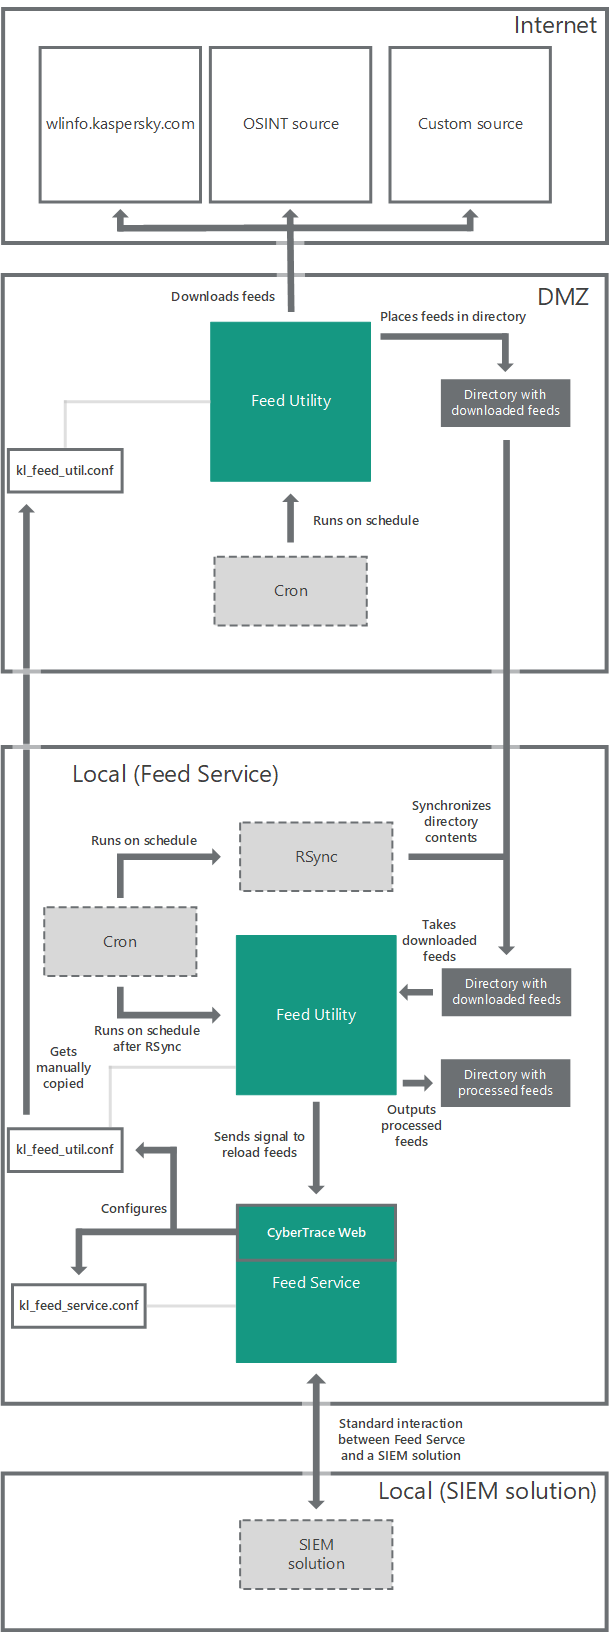
Workflow when Feed Service and Feed Utility are installed on separate computers
Using CyberTrace Web if Feed Service and Feed Utility are on separate computers
If you use Kaspersky CyberTrace Web with Feed Service and Feed Utility installed on separate computers, keep the following actions in mind with respect to the Settings > Feeds tab, in the Feeds update period section.
- Do not update feeds (by clicking the Launch update now button) or change the update frequency (by selecting a value from the Update frequency drop-down list).
The feeds will not be updated on the Local computer, because it is isolated from the Internet.
- (Kaspersky CyberTrace version 3.0) Do not change the Kaspersky certificate by clicking Import certificate.
The certificate will only be changed on the Local computer. To change the certificate on the DMZ computer, manually copy it from the Local computer to the
dmzfolder.
By default, Kaspersky CyberTrace updates Kaspersky Threat Data Feeds every 30 minutes.
If you use DMZ integration, perform one of the following actions:
- Stop the scheduled task that regularly updates feeds by disabling feed updates on the Settings > Feeds tab of the web interface.
- Stop the scheduled task that regularly updates feeds by specifying
0in theupdate_frequencyattribute of the Feeds element in the Feed Service configuration file.
You can use Kaspersky CyberTrace Web to perform the actions listed below. However, note that each time you make any changes, you have to copy the kl_feed_util.conf file from the Local computer to the DMZ computer so that the changes you made on the Local computer will be replicated on the DMZ computer.
- You can change the remaining settings of feeds on the Settings > Feeds tab.
For example, you can add new custom or third-party feeds.
- You can change the settings of a proxy server on the Settings > Service tab, in the Connection settings section.
Installing Feed Service and Feed Utility on separate computers
The following procedure describes how to install Feed Service on one computer (in this topic, referred to as Local) and Feed Utility on another computer (in this topic, referred to as DMZ).
If you use Kaspersky CyberTrace Web, see subsection "Using CyberTrace Web if Feed Service and Feed Utility are on separate computers", above, before proceeding to the installation.
To install Feed Service and Feed Utility on separate computers:
- Install Kaspersky CyberTrace from the distribution package to a directory (referred to as
%service_dir%) on the Local computer.(Kaspersky CyberTrace version 3.0) If you use Windows Installer, after you specify the path to the certificate file, the list of available feeds is not retrieved, because the Local computer is not connected to the Internet. In this case, you are prompted to manually select the feeds.
- Locate the kl_feed_service.conf configuration file. In this file, locate the
<NotifyKTFS path="">false</NotifyKTFS>element. Change it to<NotifyKTFS path="..\bin">true</NotifyKTFS>. - Copy the
dmzsubfolder of the installation folder from the Local computer to the DMZ computer.(Kaspersky CyberTrace version 3.0) When you want to use a new PEM-formatted certificate for updating feeds, change Kaspersky CyberTrace configuration by performing the installation procedure again. You will have to copy the
dmzsubfolder from the Local computer to the DMZ computer. - If you use Kaspersky CyberTrace Web and want to change the settings of any feed or add a new custom or third-party feed, make all the necessary changes directly on the Settings > Feeds tab in Kaspersky CyberTrace Web.
- Replace the kl_feed_util.conf file in the
dmzfolder located on the DMZ computer with the copy of the same file stored on the Local computer.You can obtain kl_feed_util.conf on the Local computer in one of the following ways:
- Copy it from the
%service_dir%\binfolder. - If you use Kaspersky CyberTrace Web, select the Settings > Service tab and click Export configuration file.
- Copy it from the
- Configure the synchronization of directories containing feeds as stated in subsection "Synchronizing directories that contain feeds" below.
- In the
%service_dir%\scripts\cron_cybertrace.cmdfile on the Local computer, specify the credentials for connecting to the DMZ computer and the path to thefeedsfolder on the DMZ computer.
Configuring the updating of feeds on the DMZ computer
Create a regularly launched task that runs the updating of feeds on the DMZ computer so that the cron_dmz.cmd script will run twice as often as in the case when Kaspersky CyberTrace is installed on a single computer. This task will cause new versions of feeds to be used as soon as possible. For example, create the task by running the following command:
schtasks /create /tn KasperskyFeedServiceUpdate /ru system /f /tr "\"%path_to_cron.cmd%\cron_dmz.cmd\"" /sc minute /mo 15
Configuring the updating of feeds on the Local computer
Add a task that runs the updating of feeds so that the cron_cybertrace.cmd script will run twice as often as when Kaspersky CyberTrace is installed on a single computer. For example, modify the task by running the following command. Substitute %user% with the name of the user that is authorized to run Cygwin on a Windows computer, and substitute %password% with a password for this user.
schtasks /create /tn KasperskyFeedServiceUpdate /ru %user% /rp %password% /f /tr "%service_dir%\scripts\cron_cybertrace.cmd" /sc minute /mo 15
The synchronization of feeds must occur after they are updated on the DMZ computer, and so you can specify launching of the cron_cybertrace.cmd script several minutes after the cron_dmz.cmd script is launched on the DMZ computer.
You may have to change the settings in the cron_cybertrace.cmd script. The settings are describes in the following table. For more information, see subsection "Synchronizing directories that contain feeds" below.
Settings in cron_cybertrace.cmd
Setting |
Description |
RSYNC_USER |
Login on the computer where the RSync utility is installed. |
RSYNC_HOST |
Host where the RSync utility is installed. |
PATH_TO_FEEDS |
Path to the directory where to store the processed feeds. |
DOWNLOAD_DIR |
Path to the directory in which the feeds are dowloaded. Do not change the value of this parameter. Changing this value may cause Feed Utility not to work properly. |
SSH_KEY |
The RSA public key to be used when synchronizing directories with feeds. |
Synchronizing directories that contain feeds
For synchronizing feeds on both the Local computer and DMZ computer, you can use the RSync utility. On a computer running Windows, the RSync utility can be run by using Cygwin.
All Linux commands below are run on Windows computers by using Cygwin.
To install the RSync utility on a Windows computer:
- Install the default set of packages from the Cygwin distribution.
- Install the following utilities: OpenSSH, OpenSSL, and RSync.
- On the DMZ computer, configure the OpenSSH components as follows:
- Run the following command as root:
ssh-host-configYou can answer
Yesevery time. The important point is to run the sshd daemon as a service. - Run the following command:
net start sshd
- Run the following command as root:
The sshd daemon will start automatically.
To configure the synchronization of feeds:
- Create a private key and a corresponding public key.
For this purpose, run the following command on the Local computer:
ssh-keygen -t rsa -q -N '' -f /home/<user>/.ssh/dmz_rsa_key(Specify the user login instead of
<user>.) The keys will be created without a password. - Copy the public key from the Local computer to the DMZ computer by running the following command:
ssh-copy-id -i /home/<user>/.ssh/dmz_rsa_key <DMZ_user>@<DMZ_host>When you run this command, you will be asked for the password to
<DMZ_user>@<DMZ_host>. - Test the synchronization of the contents of directories that contain feeds by running the following command on the Local computer:
rsync -a --delete-before --delay-updates -e "ssh -i /home/<user>/.ssh/dmz_rsa_key" <DMZ_user>@<DMZ_host>:/<Path_to_feeds>/ /<Path_to_feeds_on_Local>/In this command,
<Path_to_feeds_on_Local>is the path to the folder containing feeds on the Local computer (namely,%service_dir%/feeds), and<Path_to_feeds>is the path to the folder on which updated feeds are stored on the DMZ computer.To pass the synchronization test, the contents of the
<Path_to_feeds_on_Local>folder on the Local computer must be the same as the contents of the<Path_to_feeds>folder on the DMZ computer.
Separate installation of Feed Service and Feed Utility (Linux)
You can install Feed Service and Feed Utility on separate computers. This allows you to isolate the computer, on which event data is matched against feeds, from the Internet.
Do not delete the dmz directory from the distribution kit of Kaspersky CyberTrace, even if you are not going to use Feed Service and Feed Utility on separate computers.
You can install Feed Utility on a Windows computer. For this you must have the distribution package for Windows which also contains the instructions on how to perform the installation.
How Feed Service and Feed Utility work in DMZ
The following diagram describes how Feed Service and Feed Utility work in DMZ.
Workflow when Feed Service and Feed Utility are installed on separate computers
Using CyberTrace Web if Feed Service and Feed Utility are on separate computers
If you use Kaspersky CyberTrace Web with Feed Service and Feed Utility installed on separate computers, avoid performing the actions below on the Settings > Feeds tab, in the Feeds update period section. The actions will be ineffective.
- Do not update feeds (by clicking the Launch update now button) or change the update frequency (by selecting a value from the Update frequency drop-down list).
The feeds will not be updated on the Local computer, because it is isolated from the Internet.
- (Kaspersky CyberTrace version 3.0) Do not change the Kaspersky certificate (by clicking Import certificate).
The certificate will only be changed on the Local computer. To change the certificate on the DMZ computer, manually copy it from the Local computer to the
dmzdirectory.
By default, Kaspersky CyberTrace updates Kaspersky Threat Data Feeds every 30 minutes.
If you use DMZ integration, perform one of the following actions:
- Stop the scheduled task that regularly updates feeds by disabling feed updates on the Settings > Feeds page of the web interface.
- Stop the scheduled task that regularly updates feeds by specifying
0in theupdate_frequencyattribute of the Feeds element in the Feed Service configuration file.
You can use Kaspersky CyberTrace Web to perform the actions listed below. However, note that each time you make any changes, you have to copy the kl_feed_util.conf file from the Local computer to the DMZ computer so that the changes you made on the Local computer get replicated on the DMZ computer.
- You can change the remaining settings of feeds on the Settings > Feeds tab.
For example, you can add new custom or third-party feeds.
- You can change the settings of a proxy server on the Settings > Service tab in the Connection settings section.
Outline of the installation procedure
The following procedure describes how to install Feed Service on one computer (in this topic, referred to as Local) and Feed Utility on another computer (in this topic, referred to as DMZ).
If you use Kaspersky CyberTrace Web, please see section "Using CyberTrace Web if Feed Service and Feed Utility are on separate computers" above before proceeding to the installation.
To install Feed Service and Feed Utility on separate computers:
- Install Kaspersky CyberTrace from the distribution package to a directory (referred to as
%service_dir%) on the Local computer.(Kaspersky CyberTrace version 3.0) After you specify the path to the certificate file in the configurator, the list of available feeds is not retrieved, because the Local computer is not connected to the Internet. In this case, you are prompted to manually select the feeds.
- Locate the kl_feed_service.conf configuration file. In this file, locate the
<NotifyKTFS path="">false</NotifyKTFS>element. Change it to<NotifyKTFS path="..\bin">true</NotifyKTFS>. - Copy the
dmzsubdirectory of the installation directory from the Local computer to the DMZ computer.(Kaspersky CyberTrace version 3.0) When you have to use a new PEM-formatted certificate for updating feeds, change Kaspersky CyberTrace configuration using the installation script. You will have to copy the
dmzsubdirectory from the Local computer to the DMZ computer. - If you use Kaspersky CyberTrace Web and want to change the settings of any feed or add a new custom or third-party feed, make all the necessary changes directly on the Settings > Feeds tab in Kaspersky CyberTrace Web.
- Replace the kl_feed_util.conf file in the
dmzdirectory located on the DMZ computer with the copy of the same file stored on the Local computer.You can obtain kl_feed_util.conf on the Local computer in one of the following ways:
- Configure the synchronization of directories containing feeds as stated in section "Synchronizing directories that contain feeds" below.
- In the
%service_dir%/scripts/cron_cybertrace.shfile on the Local computer, specify the credentials for connecting to the DMZ computer and the path to thefeedsdirectory on the DMZ computer.
Configuring the updating of feeds on the DMZ computer
Configure the cron task that runs the updating of feeds on the DMZ computer so that the cron-dmz.sh script will run twice as often as when Kaspersky CyberTrace is installed on a single computer. This is done so that the new versions of feeds will be used as soon as possible. For example, specify the following line in the cron configuration file:
*/15 * * * * %path_to_cron.sh%/cron-dmz.sh
Configuring the updating of feeds on the Local computer
Add a task that runs the updating of feeds so that the cron_cybertrace.sh script will run twice as often as when Kaspersky CyberTrace is installed on a single computer. The synchronization of feeds must occur after they are updated on the DMZ computer, and so you can specify launching of the cron_cybertrace.sh script several minutes after the cron-dmz.sh script is launched on the DMZ computer. For example, specify the following line in the cron configuration file:
*/15+7 * * * * %service_dir%/scripts/cron_cybertrace.sh
You might have to change the settings in the cron_cybertrace.sh script. The settings are describes in the following table. For more information, see subsection "Synchronizing directories that contain feeds" below.
Settings in cron_cybertrace.sh
Setting |
Description |
RSYNC_USER |
Login on the computer where the RSync utility is installed. |
RSYNC_HOST |
Host where the RSync utility is installed. |
PATH_TO_FEEDS |
Path to the directory where to store the processed feeds. |
DOWNLOAD_DIR |
Path to the directory in which the feeds are downloaded. Do not change the value of this parameter. Changing this value may cause Feed Utility not to work properly. |
SSH_KEY |
The RSA public key to be used when synchronizing directories with feeds. |
Synchronizing directories that contain feeds
For synchronizing feeds on both the Local and DMZ computers you can use the RSync utility. If the DMZ computer is a Windows computer, the RSync utility can be run by using Cygwin.
To install the RSync utility on a Windows computer:
- Install the default set of packages from the Cygwin distribution.
- Install the following utilities: OpenSSH, OpenSSL, and RSync.
- On the DMZ computer, configure the OpenSSH components as follows:
- Run the following command as root:
ssh-host-configYou can answer
"Yes"every time. The main point is to run the sshd daemon as a service. - Run the following command:
net start sshd
- Run the following command as root:
The sshd daemon will start automatically.
To configure the synchronization of feeds:
- Create a private key and a corresponding public key.
For this purpose, run the following command on the Local computer:
ssh-keygen -t rsa -q -N '' -f /home/<user>/.ssh/dmz_rsa_key(Specify the user login instead of
<user>.) The keys will be created without a password. - Copy the public key from the Local computer to the DMZ computer by running the following command:
ssh-copy-id -i /home/<user>/.ssh/dmz_rsa_key <DMZ_user>@<DMZ_host>When you run this command, you will be asked for the password to
<DMZ_user>@<DMZ_host>. - Test the synchronization of the contents of directories that contain feeds by running the following command on the Local computer:
rsync -a --delete-before --delay-updates -e "ssh -i /home/<user>/.ssh/dmz_rsa_key" <DMZ_user>@<DMZ_host>:/<Path_to_feeds>/ /<Path_to_feeds_on_Local>/In this command,
<Path_to_feeds_on_Local>is the path to the directory containing feeds on the Local computer (namely,%service_dir%/feeds), and<Path_to_feeds>is the path to the directory on which updated feeds are stored on the DMZ computer.To pass the synchronization test, the contents of the
<Path_to_feeds_on_Local>directory on the Local computer must be the same as the contents of the<Path_to_feeds>directory on the DMZ computer.
Integration with QRadar when QRadar cannot get updates
If it is not possible to get the latest QRadar updates, use the configuration procedure below.
To use QRadar with Feed Service if QRadar cannot be updated:
- Import new QRadar identifiers to QRadar.
- Add Feed Service as a log source for QRadar.
- Map Feed Service events to QRadar identifiers.
- Perform the verification test.
- (optional) Perform all steps from the following instructions: Configure QRadar to display custom fields of events.
- (optional) Perform all steps from the following instructions: Configure QRadar to display events in a dashboard.
After you have successfully integrated Kaspersky CyberTrace with QRadar, install Kaspersky Threat Feed App:
Importing QIDs to QRadar
QRadar must correctly process the incoming events from Feed Service. For this purpose, you must add a list of permissible events (a list of QRadar identifiers (QIDs)) to QRadar. In Feed Service, the event categories are defined in the configuration file, in the Feeds > Feed > Field element, the category attribute.
The distribution kit of Kaspersky CyberTrace includes a file named sample_qid.txt that contains necessary events from Feed Service. Do not alter the descriptions of these events but, instead, add your own events to this file.
We recommend that you name the event categories according to the format "KL_<feed>_<object_type>", where:
<feed>—The name of the feed which detects the event (for example,PhishingUrl).<object_type>—The field by which the event is detected (for example,URL,Hash_MD5,Hash_SHA1,Hash_SHA256).
To import the list of QIDs to QRadar:
- If necessary (for example, if your technical account manager recommends it), edit the
%service_dir%/integration/qradar/sample_qid.txtfile by adding to it all the event categories contained in the configuration file.Every event category must be described in a single line that has the following format:
,<event>,<descr>,<sev>,<cat_id>where:
<event>—The name of the incoming event.<descr>—The description of the event.<sev>—The severity of the event.<cat_id>—A low-level QRadar event identifier.The total list of QRadar event identifiers can be printed by the following command:
/opt/qradar/bin/qidmap_cli.sh -lWe recommend that you use values for
<sev>and<cat_id>according to QRadar documentation.
For example:
,KL_Malicious_URL,Malicious URL is detected by Kaspersky Threat Feed Service,8,7058 - Upload the
%service_dir%/integration/qradar/sample_qid.txtfile to the server that has QRadar installed. - Invoke the command:
/opt/qradar/bin/qidmap_cli.sh -i -f <filename>where
<filename>is the destination path of thesample_qid.txtfile uploaded in step 2. - To view the added custom QIDs, run the following command:
/opt/qradar/bin/qidmap_cli.sh –e
If an error occurs, refer to IBM Security QRadar SIEM Administration Guide for information on resolving the problem.
Page topAdding Feed Service as a log source
QRadar must treat Feed Service as a log source to receive the events sent by the service. The events sent by Feed Service are in the QRadar Log Event Extended Format (LEEF) format, and the new log source in QRadar will be a Universal LEEF log source.
To add Feed Service to QRadar as a log source:
- Select the Admin > Log Sources > Add menu item.
- In the Add a log source window, type a unique name for the log source.
This name will be displayed in the GUI for any event from this source.
- Type the description of the log source.
- Select
Universal LEEFin the Log Source Type control. - Select "Syslog" in the Protocol Configuration drop-down list.
- In the Log Source Identifier text box, type the identifier that is set in the Feed Service configuration file—in this case, it is
KL_Threat_Feed_Service_v2. This identifier is used in the EventFormat and AlertFormat parameters.Do not select the Coalescing Events checkbox. If you select it, all the events from Feed Service will coalesce into a single event that will contain no useful information.
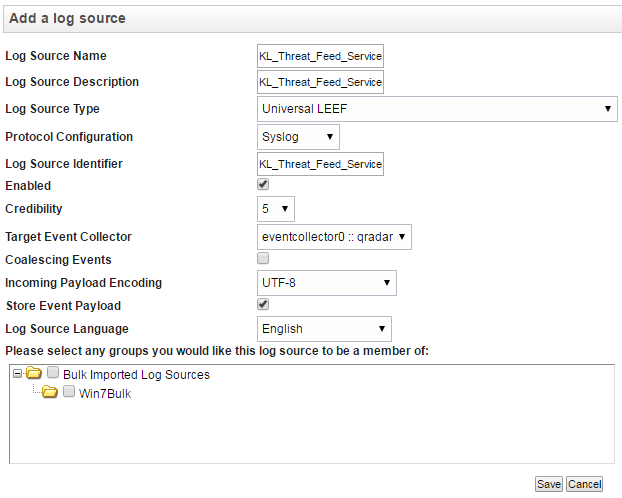
Adding a log source to QRadar
- Click Save.
Perform the same actions to add another log source with the KL_Verification_Tool identifier. It will be used for testing the interaction between Feed Service and QRadar.
After the two log sources are added, select the Admin > Deploy Changes menu item.
Page topMapping events to QIDs
When the events from the sample_initiallog.txt file are received by QRadar, the Log Activity page displays them as of "unknown" type.
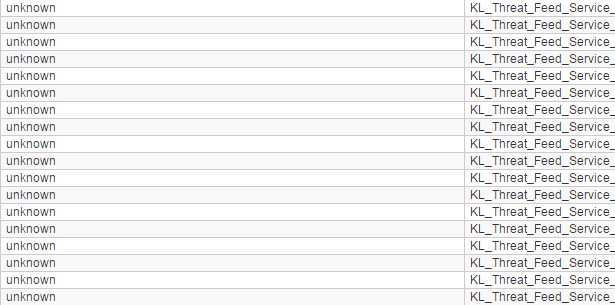
Log with "unknown" events
If the Log Activity page displays too many events that arrive from different devices, you can add an event filter. In this event filter, set KL_Threat_Feed_Service_v2 and KL_Verification_Tool as the log sources (the operator used in the filter must be Equals any of).
To correctly identify the events, set the mapping between QIDs and events:
- In QRadar Console, select the Log Activity tab, stop the events flow by clicking Pause () in the upper-right area of the window, and then double-click any event of "unknown" type that has "
KL_Threat_Feed_Service_v2" in the Log Source column.
Stop the events flow
The event information will be displayed. The event name will be contained in Payload information.
- Click the Map Event button.
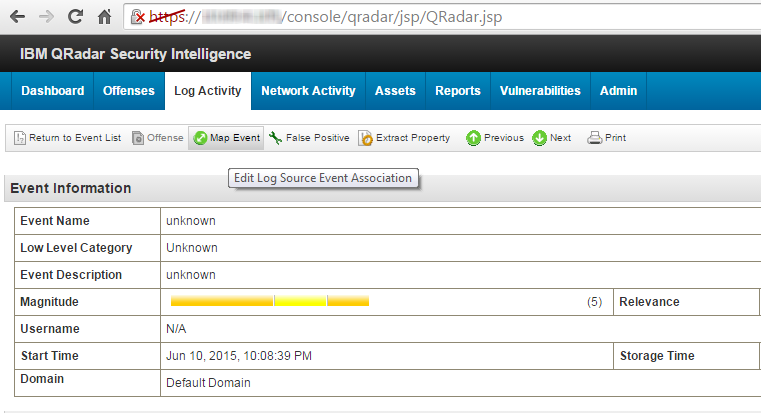
Browsing event information
- In the Log Source Event window in the QID/Name text box, type the event name. It must be one of the QIDs imported to QRadar.
- Click Search.
One result will be displayed in the Matching QIDs table.
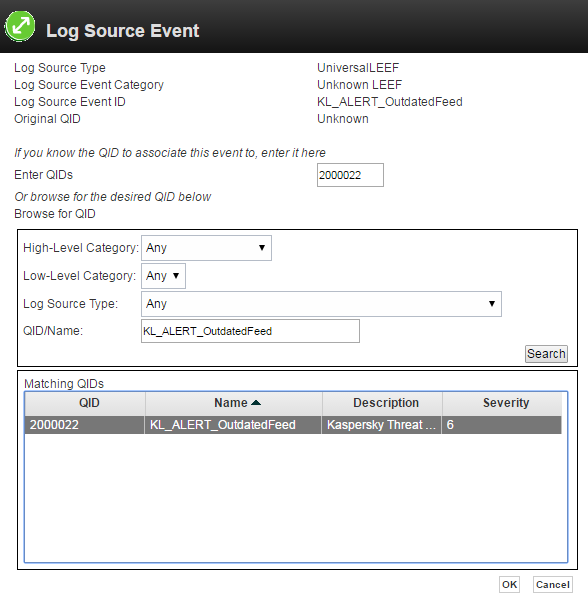
Adding the correspondence between a QID and an event name
- Select the table row and click OK.
- Perform steps 3, 4, and 5 for all event types (imported QIDs).
- To ensure that events and QIDs are mapped correctly, repeat the procedure for sending a set of events to QRadar. The Log Activity page must not contain any event of "unknown" type.
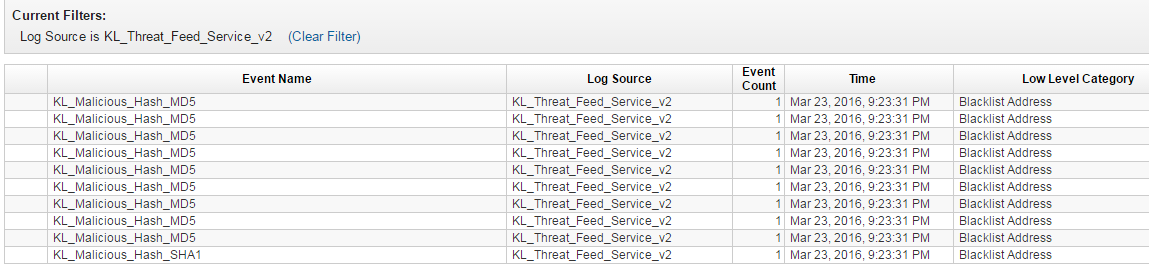
Log without "unknown" events
Specifying the log source type
Perform the following procedure only if you had to add Feed Service to QRadar as a log source manually because you did not have the latest QRadar updates. Use the procedure to specify the Log Source Type property of the added custom event properties.
To specify the log source type of the added custom event properties:
- In QRadar, select Admin and under Data sources, in the Events section, select Custom Event Properties.
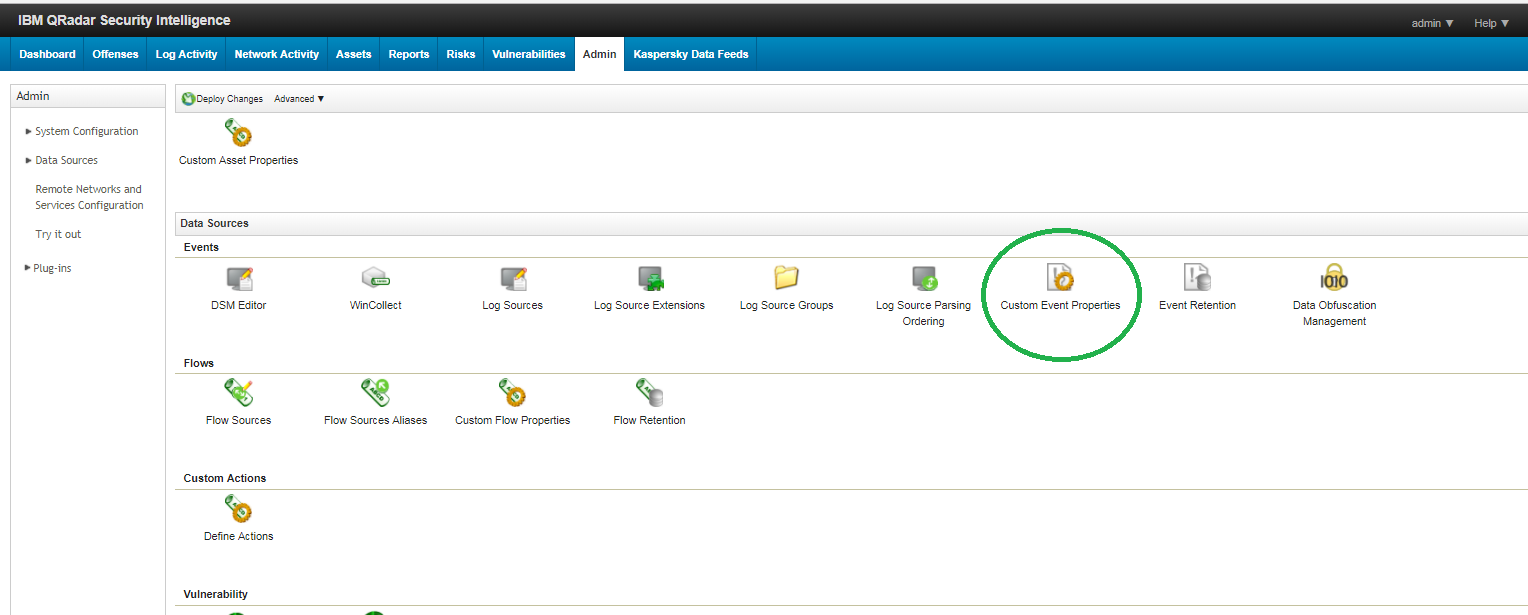
Admin tab of QRadar Console
The Custom Event Properties window opens.
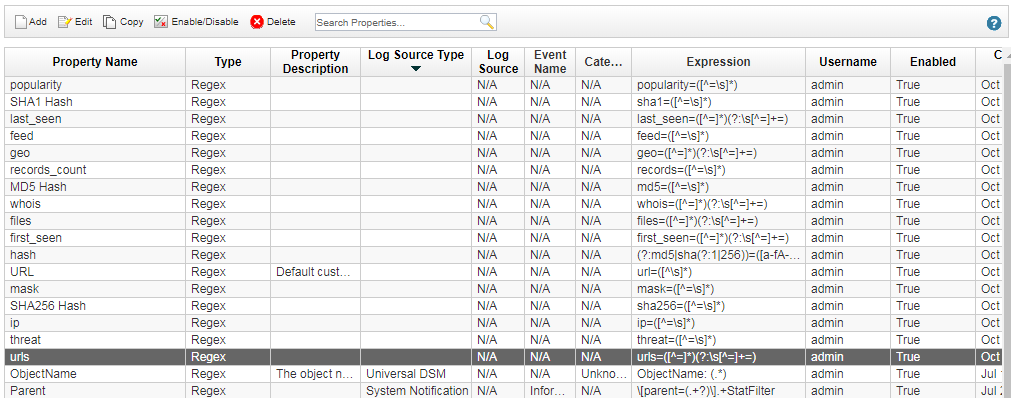
Custom event properties
- For each custom event property, perform the following steps:
- Select the property.
- Click Edit.
A Custom Event Property Definition window opens.
- In the Log Source Type drop-down box, select Universal LEEF.
- Select the Existing Property option.
The Existing Property option was selected before you changed the value in the Log Source Type drop-down box. However, after you changed the log source type, the New Property option was selected. Therefore, you have to select the Existing Property option again.
- Click Save.
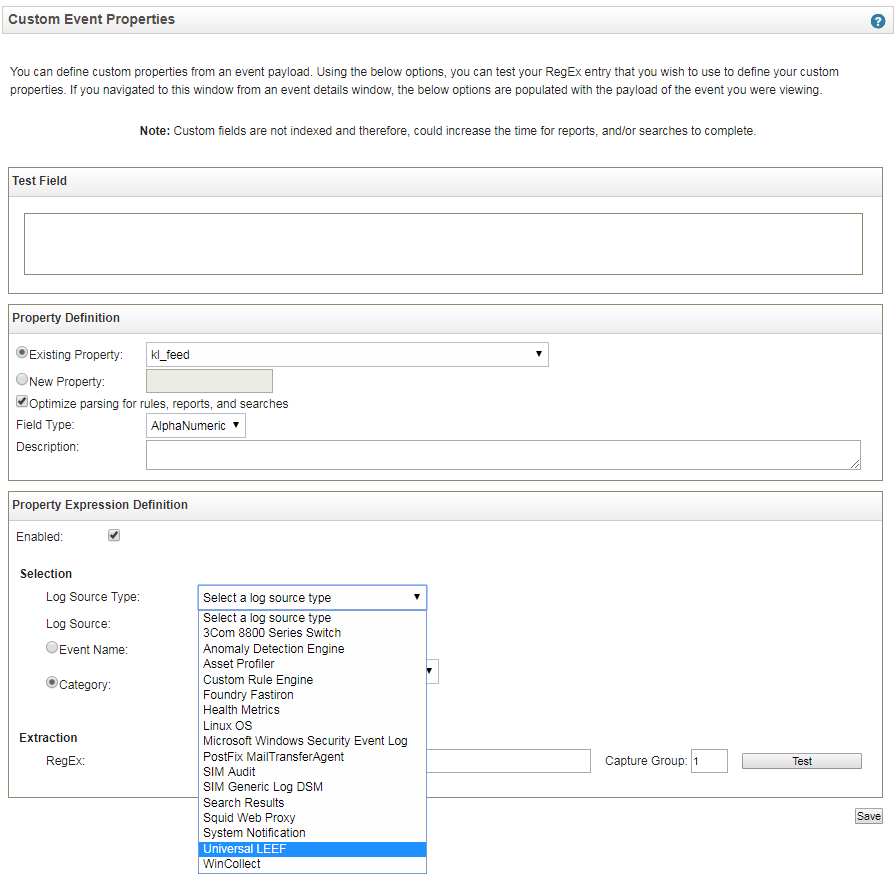
Custom event property definition
The log source type of every custom event property will now be Universal LEEF.
Specifying custom ArcSight user in ArcSight Forwarding Connector settings
This section describes how to specify a custom ArcSight user in the ArcSight Forwarding Connector settings.
When the ARB package is imported to ArcSight, the FwdCyberTrace user is created in the Kaspersky CyberTrace Connector group. This user account is intended for use by ArcSight Forwarding Connector. You may want to use another user account instead. We recommend that in this case you remove the FwdCyberTrace user and the Kaspersky CyberTrace Connector group. Note that your custom user must have the Forwarding Connector type.
To create a custom ArcSight user account for forwarding events from ArcSight ESM to Feed Service:
- Run ArcSight Console.
- In the Navigator pane, select the Resources tab.
- Open the drop-down list and select Users.
- In the tree view, select the user group that contains the custom user account.
It is recommended to put this user account into a separate user group created only for this user.
- In the tree view, right-click the group entry and select Edit Access Control.
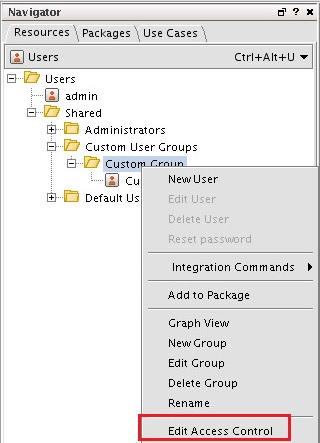
Editing access settings
- In the Inspect/Edit pane, select the Events tab.
- Click Add.
- Select the following event filters:
CyberTrace forwarding eventsThis is the filter for events that contain hashes, URLs, and IP addresses.
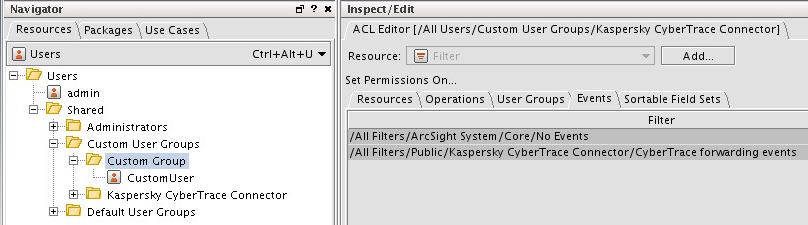
Selecting the event filters
- Install or reconfigure ArcSight Forwarding Connector.
The procedure for reconfiguring of ArcSight Forwarding Connector is provided below in this section.
To reconfigure ArcSight Forwarding Connector:
- Change the current working directory to
%FORWARDING_DIR%/current/bin.Here
%FORWARDING_DIR%is a directory where ArcSight Forwarding Connector is installed. - Execute the runagentsetup.sh script.
- Select Modify Connector and click Next.
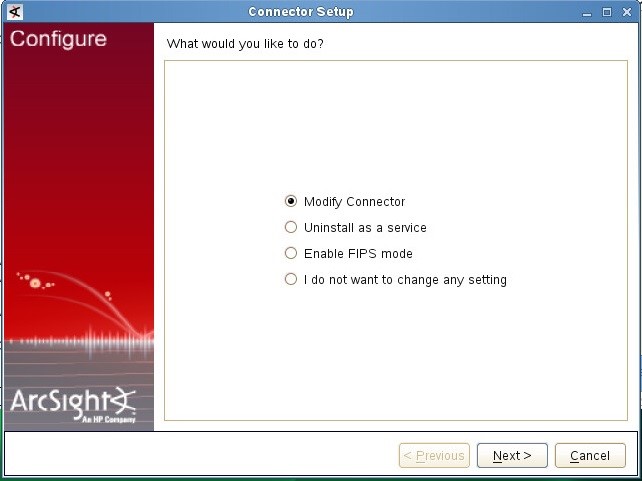
Modifying the connector
- Select Modify connector parameters and click Next.
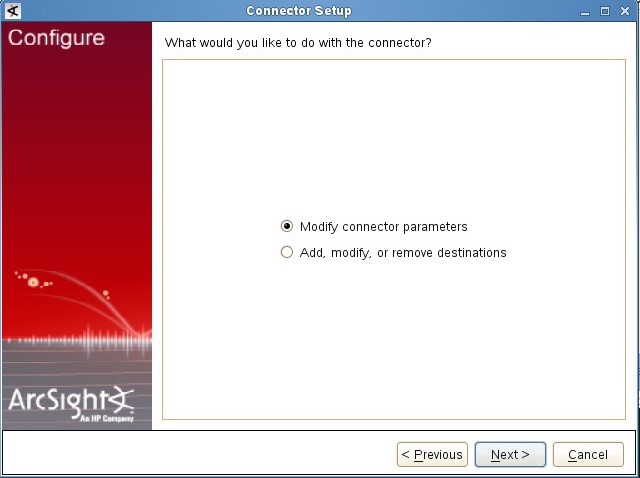
Modifying the connector parameters
- Specify the ArcSight parameters and the credentials of the custom user account and click Next.
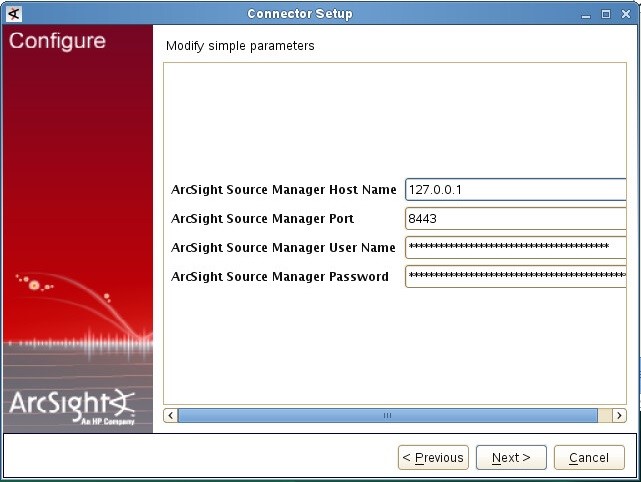
Specifying the ArcSight Source Manager parameters
- Click Next and then click Finish to finalize the Connector Setup window.
User guides
This chapter provides information about using the Kaspersky CyberTrace web interface and applications for SIEM solutions.
Using Kaspersky CyberTrace Web
This section describes the web user interface (web interface) for Kaspersky CyberTrace.
About the Kaspersky CyberTrace web interface
The Kaspersky CyberTrace web interface is implemented by an HTTP service. This web interface is called Kaspersky CyberTrace Web.
Starting from Kaspersky CyberTrace version 3.1.0, the mode without a web user interface is not supported.
Kaspersky CyberTrace Web uses tokens for user authentication. A token is stored in cookies and is renewed every several minutes.
The web interface contains the following web pages:
- Login form
- Dashboard that displays statistics of the work of Kaspersky CyberTrace
- Search
In Kaspersky CyberTrace version 3.0, this tab was named Lookup.
- Retroscan
- Indicators
- Detections
- Tasks
Keyboard keys usage
Starting from Kaspersky CyberTrace version 4.0, you can use keyboard keys for actions that usually require a mouse.
The following keyboard keys can be used:
- ENTER
Press ENTER to confirm an action (for example, to go to the next page or to apply changes). This keyboard key is a shortcut for the Next and Save buttons in the Kaspersky CyberTrace web interface.
- ESC
Press ESC to cancel an action (for example, to cancel changes). This keyboard key is a shortcut for the Cancel button in the Kaspersky CyberTrace web interface.
Integration with Kaspersky Unified Monitoring and Analysis Platform
Kaspersky CyberTrace for Linux supports integration with Kaspersky Unified Monitoring and Analysis Platform (hereinafter referred to as KUMA). In this integration scheme, Kaspersky CyberTrace web interface serves as a built-in interface for KUMA in order to promote further development of the platform by providing key features of Kaspersky CyberTrace Web.
Kaspersky CyberTrace submits the following pages of the web user interface to KUMA depending on the KUMA user role (Administrator or Analyst). All the pages below, except for the Settings page, are available both for the Administrator and Analyst user roles. The Settings page is available only for Administrators:
- Dashboard
Displaying of this page is supported with some limitations. Thus, you cannot view the statistics of the work of Kaspersky CyberTrace in full-screen mode.
- Search
- Detections
- Indicators
- Retroscan
- Settings
Logging in to Kaspersky CyberTrace Web
Kaspersky CyberTrace Web requires authentication. Unauthenticated users are redirected to the login form. You can perform authentication by providing a valid local or domain user name and password.
Login form
To access Kaspersky CyberTrace Web as a domain user, enable and configure the usage of domain user accounts and LDAP authentication.
If you have not used Kaspersky CyberTrace Web in more than two hours, your session expires and you must log in again.
Credentials
To access Kaspersky CyberTrace from an Analyst account, ask your Administrator for credentials.
I forgot my password
Your Administrator can reset passwords for Analyst accounts. Contact your administrator to reset your password.
Changing the password
If you are logged in, you can change your account password at any time.
When you are logged in as a domain user, you cannot change the password by using Kaspersky CyberTrace Web.
To change your account password,
In the upper-right corner of the window, select Change Password.
The new password must contain six to 16 ASCII characters: there must be at least one uppercase Latin letter, one lowercase Latin letter, one digit, and one symbol of other type (for example, a comma, an exclamation mark, or a number sign).
Change password form
Page topViewing statistics on the dashboard
Kaspersky CyberTrace Web opens with the Dashboard tab selected. The Dashboard displays the statistics of the work of Kaspersky CyberTrace and contains several sections:
- Statistics overview
- Supplier statistics
- Indicator statistics
- Supplier intersections
Note that if Feed Service works in ReplyBack mode or you use Log Scanner in report mode (with the -r or --report command-line option), Kaspersky CyberTrace does not keep the statistics of the detection events and the Dashboard does not display the statistics. To save detection statistics in ReplyBack mode, use the X-KF-SaveStatistic flag.
When switching from demo feeds to commercial feeds, it takes some time to load the indicators and to update the statistics. During that time, the Dashboard may display insufficient information.
Starting from Kaspersky CyberTrace version 4.0, you can view the statistics of the work of Kaspersky CyberTrace in flexible full-screen mode. This feature allows Kaspersky CyberTrace to fit all sections below (except the Supplier intersections table) on a single Full HD display, without scrollbars.
Specifying the statistics period
You specify the time period for displaying statistics by selecting one of the Time range options on the Dashboard tab. You can select one of the following periods:
- Day (24 hours)
- Week
- Month (31 days)
- 3 months (93 days)
Kaspersky CyberTrace Web Dashboard. Time ranges for statistics display
Enabling automatic data updates
You can enable automatic data updates on a regular basis by clicking the Auto-update dashboard toggle button. Kaspersky CyberTrace can automatically update all data from the Dashboard tab. Kaspersky CyberTrace updates data every minute. If you enable automatic updating and if your user account role is Analyst, the session will not expire as long as you stay on the Dashboard tab.
By default, automatic updating is disabled.
Statistics overview
This section provides an overview of detection statistics and contains the following items:
- Graph showing the total number of checked objects
The graph is displayed when the Checked objects button is selected.
- Graph showing the number of detections
A line graph displays statistics of detections on points. Such detections occurred during the specified period. The time scale is divided into hours, days, or weeks, depending on the specified period.
The graph is displayed when the Number of detections button is selected.
- Graph showing the number of detected indicators, for each indicator type (URL, IP address, and hash)
A line graph displays the number of detected indicators during the specified period. The time scale is divided into hours, days, or weeks, depending on the specified period.
The graph is displayed when the Number of detected indicators button is selected.
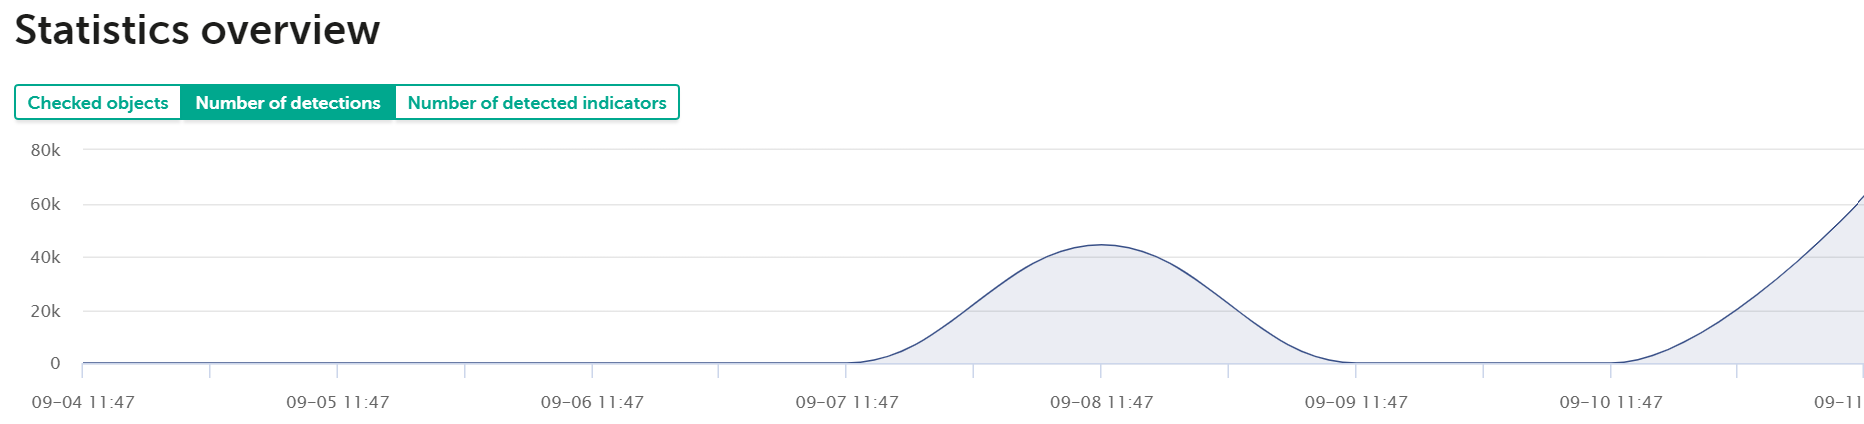
Kaspersky CyberTrace Web Dashboard. Statistics overview
Supplier statistics
This section provides detection statistics, organized by supplier, and contains the following items:
- Table with statistics of detections for each supplier in use
The table contains the following columns with data:
- Supplier name—Names of the indicator suppliers in use
- Indicators—Number of unique indicators for all enabled suppliers
If an indicator is present in multiple suppliers, duplications of this indicator are discarded from the total number.
- A mark indicating whether the supplier is not loaded or loaded partially due to license restrictions
- False positives—Number of false positive indicators in each supplier (false positive indicators belonging to the FalsePositive supplier)
- Detected—Number of detected indicators for each supplier
- Last update—Date and time of the last supplier update
If an error occurs during an attempt to update a supplier, Kaspersky CyberTrace will display a notification about it.
The table also gives a total for each column.
If a supplier is not loaded or is loaded only partially because of license restrictions, this supplier will be marked explicitly with a warning symbol (
 ).
). - Donut chart that presents the number of detections for each supplier in use
This donut chart is displayed when the Detected button is selected. When you hover your mouse over a slice of the ring, the supplier name, number of detections, and percentage of total detections will appear.
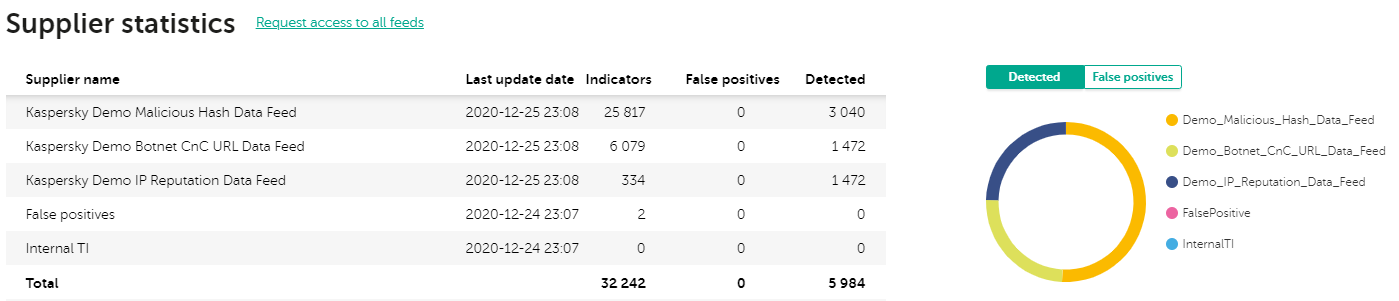
Supplier statistics
- Donut chart that presents the number of false positive indicators (indicators belonging to the FalsePositive supplier) for each supplier in use
This donut chart is displayed when the False positives button is selected. Hover your mouse over a slice of the ring: the supplier name, number of false positive indicators, and percentage of total false positive indicators will appear.
If the false positives list contains records, the Supplier statistics table has a row with False Positives in the Supplier name column and the size of the false positives list in the Indicators column. Other columns in this row contain 0.
If the Internal TI list contains records, the Supplier statistics table has a row with Internal TI in the Supplier name column and the size of the Internal TI list in the Indicators column. The Detected column in this row contains the number of detections against the Internal TI list, and the False positives column contains 0.
If you disable or remove a previously enabled supplier, this supplier will still be displayed in the table. Values in the Detected and False positives columns will reflect the number of true and false detections produced by this supplier while it was enabled, but the value in the Indicators column will always remain a hyphen (-). To check whether a supplier is disabled, hover your mouse over a string with the supplier name: if the supplier is disabled, a window with the supplier status appears.
Indicator statistics
This section provides statistics of the checked indicators and contains the following items:
- Table with the statistics of the checked indicators
The table contains the following columns with data:
- Indicator type—Different types of indicators
- Checked—Number of indicators of each type (URL, IP address, and hash) that are checked by Feed Service
- Detected—Number of indicators of each type (URL, IP address, and hash) that are detected by Feed Service
The table also gives a total for each column.
- Donut chart that presents the relative numbers of the checked indicators of each type (URL, IP address, and hash)
This donut chart is displayed when the Checked button is selected. Hover your mouse over a slice of the ring: the indicator type, number of indicators, and percentage of total will appear.
- Donut chart that presents the relative numbers of the detected indicators of each type (URL, IP address, and hash)
This donut chart is displayed when the Detected button is selected. Hover your mouse over a slice of the ring: the indicator type, number of indicators, and percentage of total will appear.
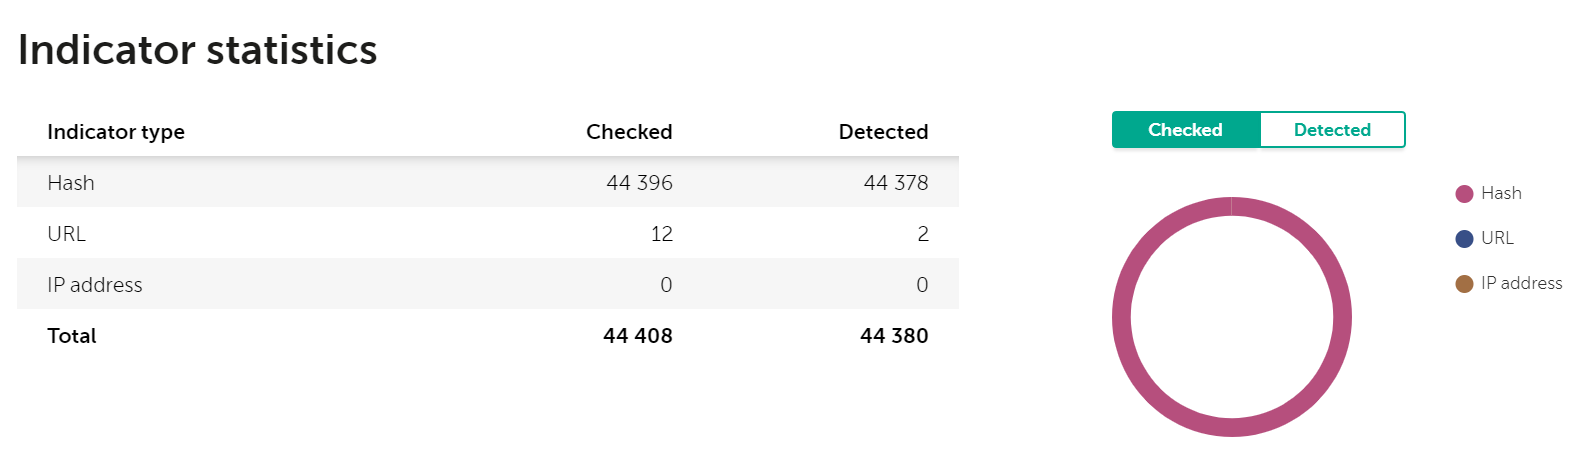
Indicator statistics
Suppliers intersections table
This section shows the percentage of overlap between the suppliers used in Kaspersky CyberTrace. The table consists of rows and columns with suppliers. The intersection shows what percentage of indicators from suppliers in rows are present in suppliers in columns. If you choose to display statistics for a specific tenant, the table will show the overlap between suppliers used in this tenant.
The section does not display the FalsePositive and InternalTI indicator suppliers, and the suppliers that do not contain indicators.
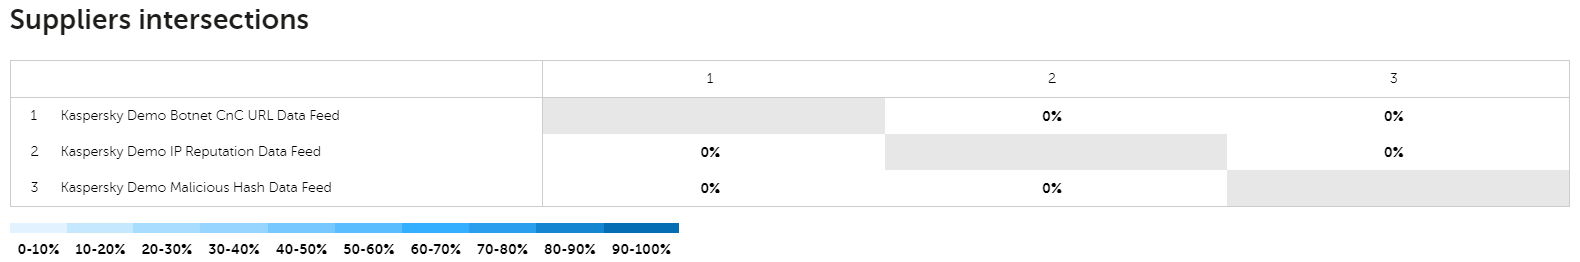
Suppliers intersections
Clicking the Fullscreen mode button hides this section.
Viewing data for different tenants
In the drop-down list with all available tenants in the upper-left area of the window, you can select either a tenant for which to display statistics or the General tenant to display the overall statistics.
Downloading statistics reports
You can download a detection statistics report by using the Dashboard tab. The report is an HTML file. If a particular settings tenant <tenant> is selected, the file name is CyberTrace_Statistics_<tenant>_<interval>_<date>.html.
To download a report:
Select the Download statistics link.
Note that the data displayed in the report is based on the data that is displayed on the Dashboard tab. If a particular settings tenant is selected, the settings tenant name is written in the report.
The generated file contains the following:
- Graph with the number of detections
This graph is displayed in the report when the Number of detections button is selected on the Dashboard tab.
- Graph with the number of detected indicators, for each indicator type
This graph is displayed in the report when the Number of detected indicators button is selected on the Dashboard tab.
- Table with supplier statistics
- Table with indicator statistics
- Donut chart that shows the number of detections foreach supplier in use
This donut chart is displayed in the report when the Detected button is selected on the Dashboard tab.
- Donut chart that shows the number of false positives indicators for each supplier in use
This donut chart is displayed in the report when the False positives button is selected on the Dashboard tab.
- Donut chart that shows the relative numbers of the checked indicators of each type
This donut chart is displayed in the report when the Checked button is selected on the Dashboard tab.
- Donut chart that shows the relative numbers of the detected indicators of each type
This donut chart is displayed in the report when the Detected button is selected on the Dashboard tab.
- Suppliers intersections table
Searching indicators
On the Kaspersky CyberTrace web user interface you can select the Search tab to activate a form for searching threat indicators.
In the Kaspersky CyberTrace version 3.0 this tab was named Lookup.
The threat search can be disabled due to restrictions imposed by the licensing level.
From the Search tab you can access pages for individual indicator types:
- Indicator—Single indicator.
In the text field enter a hash, IP address, domain, or URL, and then click the Search button.
This page opens by default.
- Log file—Indicators from log files.
- File—File hashes.

The Search tab
Starting from Kaspersky CyberTrace version 3.1.0, each search request is added to the search request history.
Saving search results
You can save the result of a search operation to a text file.
The result will be saved in a file named kl_lookup_result_%TYPE%_hhmmss_ddMMyyyy.txt. Here %TYPE% is either indicator (for a single indicator search), logfiles (for a log files search), or files (for a file hashes search).
A full report about a search result is a CSV file. In the first line of this file, the field names are listed. The remaining lines of the report contain the field values, enclosed in quotation marks. If a field value has a quotation mark, a second quotation mark is added. All data is delimited by semicolons.
Different search types imply different sets of fields in a report file. The field sets for each search type are described in a section for that particular search type.
Canceling the search
You can cancel the search operation.
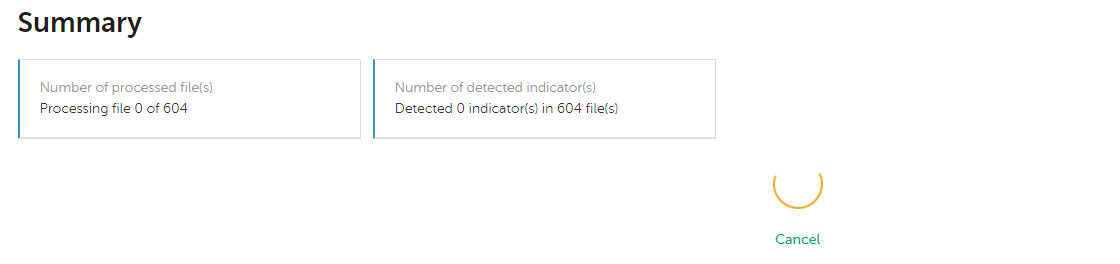
The Cancel button
To cancel the search operation:
- Click the Cancel button in the middle of the screen.
A confirmation window opens.
- Select Cancel the search, if you want to cancel the search operation.
If the search operation is canceled, the search request is added to the search request history, and the search result is
Canceled. The search result form is cleared and the "Operation is canceled" message is displayed. The information about the processed item is added to the search requests history with a remark that the search process was not finished.
About the indicator search syntax
This section lists types of indicators that you can search for and the syntax for them.
URLs
You can search for domain names and specific URLs by using the following syntax:
- Second-level domain names
example.com
- Domain names of third and lower levels
www.example.com
- URLs
http://www.example.com/index.html
Hashes
You can search for hashes by using the following syntax:
- MD5
1A79A4D60DE6718E8E5B326E338AE533
- SHA1
C3499C2729730A7F807EFB8676A92DCB6F8A3F8F
- SHA256
50D858E0985ECC7F60418AAF0CC5AB587F42C2570A884095A9E8CCACD0F6545C
IP addresses
You can search for IPv4 addresses by using the following syntax:
198.51.100.0 |
Searching for IP addresses represented in Classless Inter-Domain Routing (CIDR) notation is not supported.
Page topAbout the search request history
This section describes the search request history that is displayed on every threat search page.
Storing the search requests
When a search is performed using Kaspersky CyberTrace Web, information about it is stored in the history. The log file itself is not stored when a log file search is performed, only strings from the log file that contained detected indicators are stored; also, the file itself is not stored when a file hash search is performed.
For each authenticated user, the CyberTrace HTTP service stores the following amount of information:
- Last 1000 indicator search requests made in the last three months.
- Last 1000 log file search requests made in the last three months.
- Last 1000 file hash search requests made in the last three months.
Displaying the search request history
Every search page contains a form with the request history. The request history form contains requests of the corresponding search request type:
- Single indicator search request
- Log file search request
- File hash search request
If you have signed in as an administrator, the search request history of all users is available; otherwise, only the current user's search request history is available.
The search requests are displayed from the last to the first. The active page contains up to 20 search requests. If there are more than 20 search requests available, you can display others by using the navigation controls.
You can specify the period during which the search requests to display were made:
- Last hour
- Last day
- Last week
- Last month (30 days)
- Last 3 months (91 days)
- Arbitrary period
Single indicator search request history
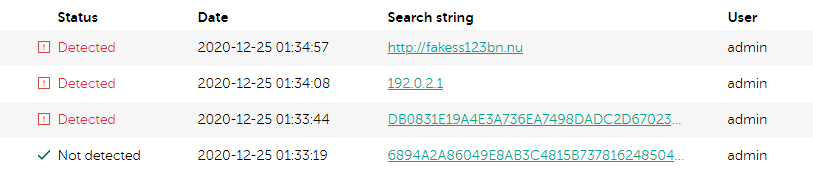
Single indicator search request history
The form with the history of single indicator search requests displays the following data:
- The search result
It is
Detectedif the indicator is detected one or more times,Not detectedif the indicator is not detected, orCanceledif the search operation was canceled.This information is displayed in the Status column.
- Date of request in the format
yyyy-mm-dd HH:MM:SSFor example,
2012-12-31 23:58:25.This information is displayed in the Date column.
- Name of the user who performed the search request
This information is displayed in the User column and can be seen only by administrators.
- Indicator that was searched for
This information is displayed in the Search string column.
For a search operation that was not canceled, if you select an indicator, the full search result and the button for exporting the search result are displayed.
Log file search request history

Log file search request history
The form with the history of log file search requests displays the following data:
- The search result
It is
Detectedif indicators in the log file are detected one or more times,Not detectedif no indicator is detected, orCanceledif the search operation was canceled.This information is displayed in the Status column.
- Date of request in the format
yyyy-mm-dd HH:MM:SSFor example,
2012-12-31 23:58:25.This information is displayed in the Date column.
- Name of the user who performed the search request
This information is displayed in the User column and can be seen only by administrators.
- Log file in which the indicators were searched for
This information is displayed in the Log file column.
For a search operation that was not canceled, if you select a row in the table, the full search result and the button for exporting the search result are displayed.
File hash search request history

File hash search request history
The form with the history of file hash search requests displays the following data:
- The search result
It is
Detectedif the file hash is detected one or more times,Not detectedif the file hash is not detected, orCanceledif the search operation was canceled.This information is displayed in the Status column.
- Date of request in the format
yyyy-mm-dd HH:MM:SSFor example,
2012-12-31 23:58:25.This information is displayed in the Date column.
- Name of the user that performed the search request
This information is displayed in the User column and can be seen only by administrators.
- Name of the file whose hash was searched for
This information is displayed in the File column.
- File hash that was searched for
This information is displayed in the Checksum column.
For a search operation that was not canceled, selecting a file hash will display the full search result and the button for exporting the search result.
Page topSingle indicator search
You can search for a single indicator by selecting the Indicator tab after selecting the Search tab.
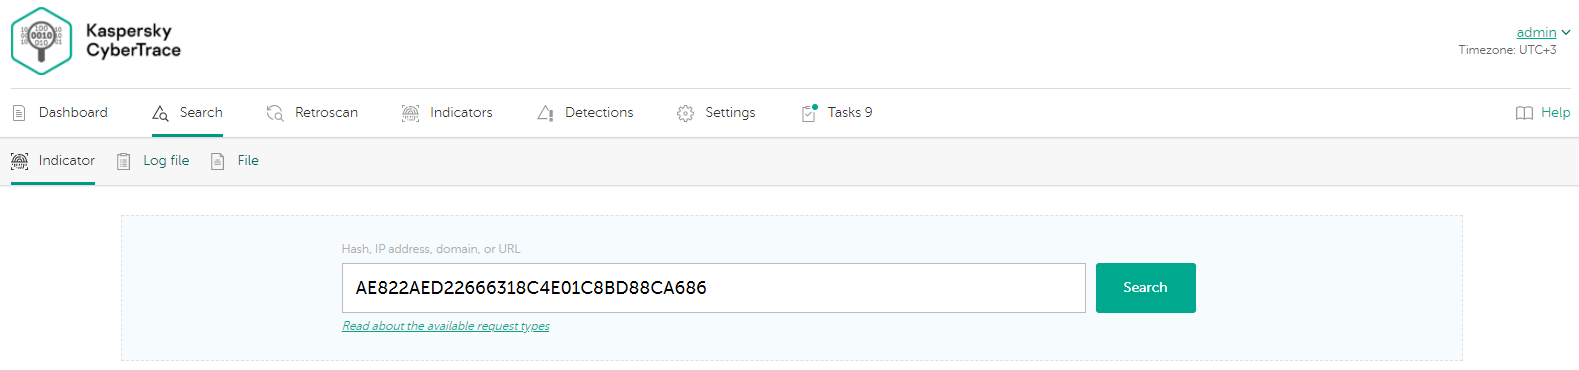
The Indicator tab
Search for objects
You can search for one of the following indicator types:
- Hash
- IP address
- Domain
- URL
To search for an indicator:
- Enter the indicator in the search field.
- Click the Search button.
The search result will appear in the Detections section.
Indicator search syntax
You can search for a URL in two ways:
- By specifying the full URL
- By specifying only the domain name
When searching for a hash or an IP address, specify the full indicator, as described in the section about indicator search syntax.
Search result
After a search is performed, CyberTrace Web displays the result in the Detections section.
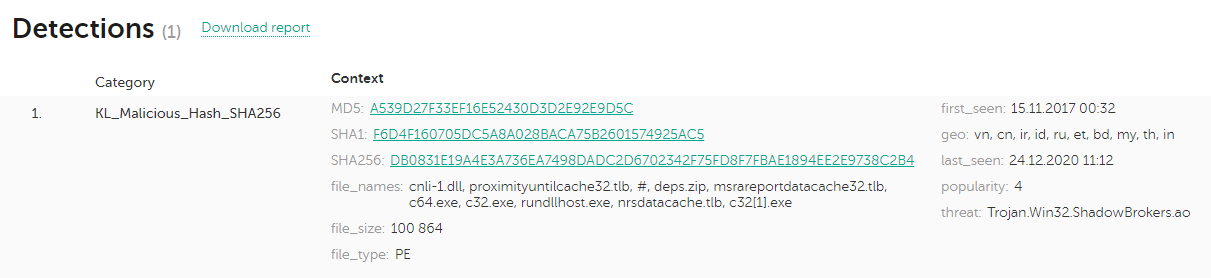
The Detections section
The search result consists of the following data:
- Requested indicator
- Category of the requested indicator
This information is displayed in the Category column.
- Fields of feed records that matched the indicator
If the feeds do not contain information about the requested indicator, a message about this is displayed.
This information is displayed in the Context column.
- Link or links to detailed information about the requested indicator
The links are displayed as fields in the Context column.
If the indicator is not detected because it belongs to the FalsePositive supplier, the search result consists of the following data:
- Requested indicator
- Message that there is no detection
- Link or links to detailed information about the requested indicator
If no information is found for the requested indicator, the message about it appears. This message displays a link that redirects you to the search page of Kaspersky Threat Intelligence Portal.
Notice that if you run a search and then switch to another tab, the search results will become available in the search request history.
Downloading search reports
You can download a report with the results of the search operation. The report is a .csv file.
To download a report:
Click the Download report link and specify the directory to which you want to save the report.
Regular expressions for searching indicators
To search for indicators, CyberTrace Web uses the regular expressions defined in the Feed Service configuration file. The regular expressions are specified by a special event source called http_single_lookup.
Log file indicators search
You can search for indicators from log files by selecting the Log file tab after selecting the Search tab.
All log files that you pass to Kaspersky CyberTrace for scanning must be in UTF-8 encoding. If your log files have a different encoding, make sure to convert them to UTF-8.
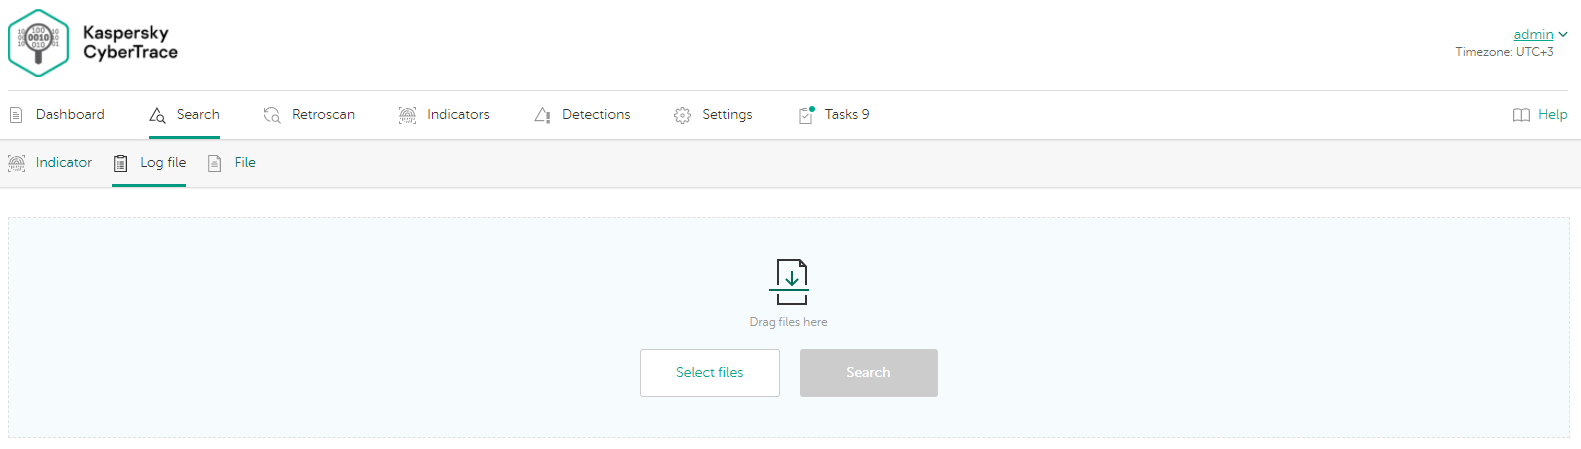
The Log file tab
Search for objects
You can search for one or more log files.
To search for indicators in log files:
- Select the log files that you want to search. Do one of the following:
- Click the Select files button, and then select the log files.
- Drag the log files into the colored area.
- Click the Search button.
The search result will appear in the Summary section.
Do not use feeds as log files for search. The scan results will contain a large number of matches, which will render the results uninformative.
Search result
After a search is performed, CyberTrace Web displays the result in the Summary section.
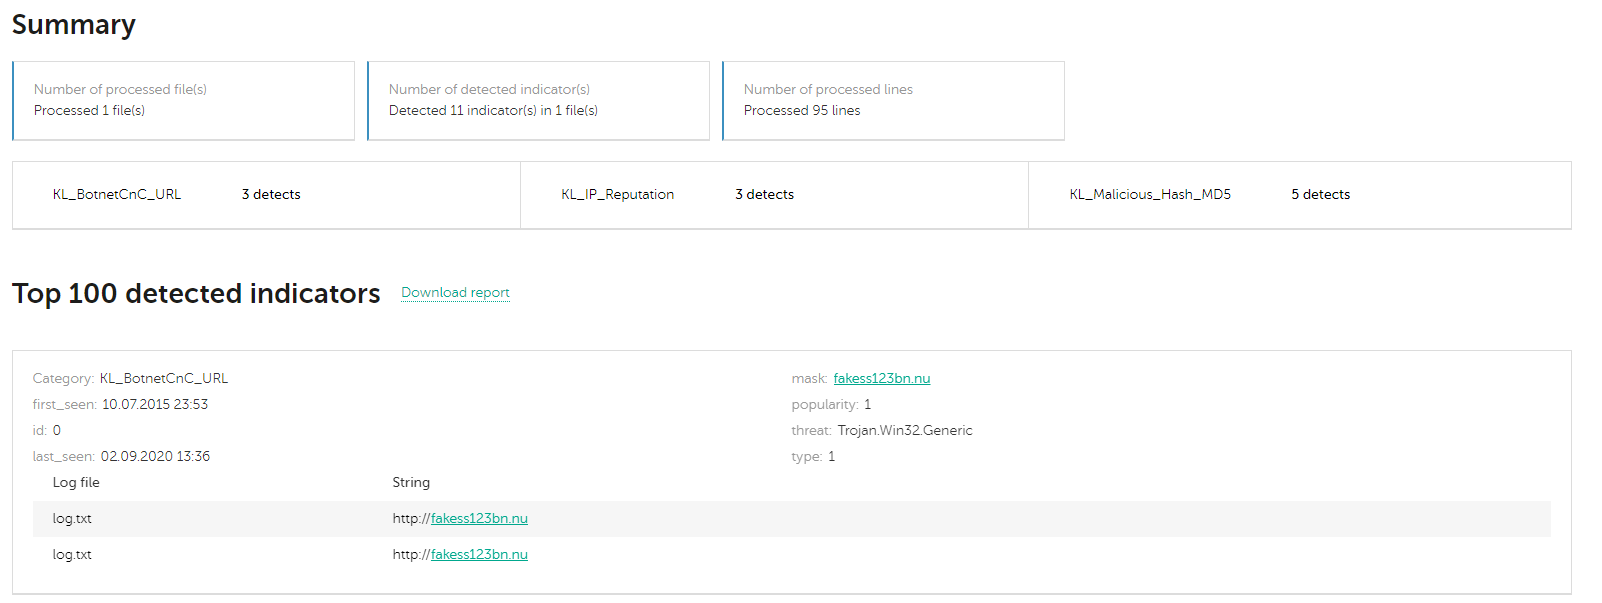
The Summary section
The search result consists of the following data:
- Summary information about the search result:
- Number of processed log files
- Number of detected indicators
- Number of lines that were processed
- Number of detections for each category
- Information about the top 100 matching indicators
- Link to download the report about the search result
For every item among the top 100 matching indicators, the following information is displayed:
- Number of occurrences in the checked log files
- Name of the log file and the lines that contain the detected indicator
Up to three lines are displayed. To view more lines that contain the detected indicator, click Show first 100 matches.
The detected indicator is hyperlinked to detailed information about it.
This information is displayed in the table at the bottom of the indicator card.
- Fields of feed records that matched the indicator
This information is displayed at the top of the indicator card.
If no information is found for the indicators in the log file, a message about this is displayed.
Notice that if you run a search and then switch to another tab, the search results will become available in the search request history.
Downloading search reports
You can download a report with the results of the search operation. The report is a .csv file.
To download a report:
Select the Download report link and specify the directory to which you want to save the report.
A full report about a search result has the following fields:
file_name—Name of the log filefile_line—Line in the log file that contains the detected indicatordetected_indicator—The detected indicatorcategory—Category of the detected indicator- Context fields from the feed
The files with search reports will be stored in the httpsrv directory. Only the administrator (in Windows) or the root user (in Linux) has permission to open this directory.
Regular expressions for searching indicators from log files
To parse log files for indicators, CyberTrace Web uses the regular expressions defined in the Feed Service configuration file. The regular expressions are specified by a special event source called http_file_lookup.
File hashes search
You can search for file hashes by selecting the File tab after selecting the Search tab.
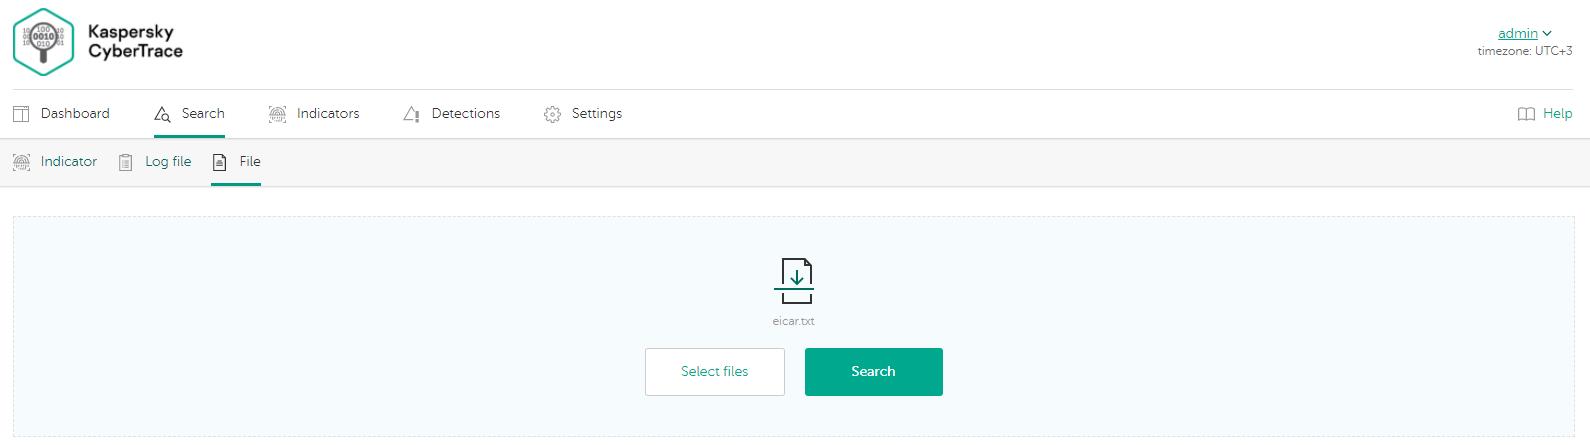
The File tab
Search for objects
You can specify one or more files. The search will be done for the MD5 hashes of these files.
To search for file hashes:
- Select the files that you want to search for. Do one of the following:
- Click the Select files button, and then select the log files.
- Drag the log files into the colored area.
- Click the Search button.
The search result will appear below in the Summary section.
Search result
After a search is performed, CyberTrace Web displays the result in the Summary section.
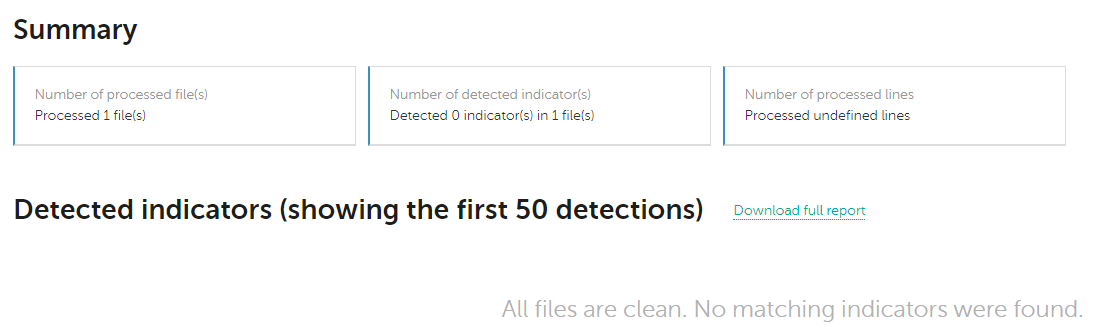
The Summary section
The search result consists of the following data:
- Number of processed hash files
- Number of detected indicators
- Number of detections for each category
For every checked file hash, the following information is displayed:
- File name
- MD5 file hash
The file hash is linked to detailed information about the object.
- Fields of feed records that matched the indicator
- Message that there is no detection (if the file hash is not detected)
If no information is found for the requested indicator, the message about this appears. This message displays a link that redirects you to the search page of Kaspersky Threat Intelligence Portal.
If you run a search and then switch to another tab, the search results will become available in the search request history.
Downloading search reports
You can download a report with the results of the search operation. The report is a .csv file.
To download a report:
Click the Download report link and specify the directory to which you want to save the report.
A full report about a search result has the following fields:
file_name—Name of the file whose hash is detecteddetected_indicator—The detected hashcategory—Category of the detected hash- Context fields from the feed
Viewing retrospective scan results
In the Kaspersky CyberTrace web user interface you can select the Retroscan tab.
Retrospective scanning allows you to rescan incoming events with objects that were not considered malicious. The reason for these checking results could be that at the time of receiving such objects, Kaspersky CyberTrace did not contain information about related threats. However, because threat data feeds are continuously updated, it can be useful to save events that do not contain detected indicators and then rescan these events manually or according to a schedule.
The Retroscan tab allows you to launch the retrospective scan manually and view the results that are received after the scan process is finished.
On this tab, you can perform the following actions:
- Launch a retrospective scan manually
- Configure displaying of scan results
- View detailed information about a single retrospective scan result that contains detected indicators
Also, this tab displays the following:
- Date and time of the next retrospective scan task
- Number of events that are saved for the retrospective scan
- Size of events that are saved for the retrospective scan
The size of events is displayed with a delay of up to one hour. The actual current size of saved events may exceed the displayed value.
- Table with retrospective scan results for the specified period
The table contains the following columns of data:
- Status of the retrospective scan task:
- Detected
The result contains detected indicators.
- Not detected
The result does not contain detected indicators.
- Canceled
The retrospective scan process was canceled.
- Detected
- Date and time when each retrospective scan task has finished
- Number of scanned indicators
- Number of detected indicators
If necessary, you can configure displaying only those results that contain detected indicators.
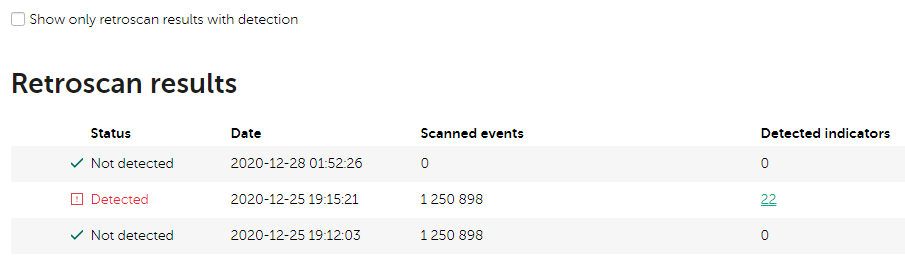
Retroscan results
- Status of the retrospective scan task:
Launching a retrospective scan
To launch a retrospective scan:
Click the Start retroscan button.
If needed, you can cancel the scan process.
Launching the retrospective scan can be unavailable for several reasons:
- Kaspersky CyberTrace is performing another retrospective scan task at the moment.
- Retrospective scan is disabled.
- Kaspersky CyberTrace contains less than 1 MB of saved events for the retrospective scan.
Configuring display of retrospective scan results that contain detection events
To display only the results that contain detection events:
Select Show only retroscan results with detection above the Retroscan results table.
Specifying the results period
You can specify the time period for displaying results by selecting one of the Retroscan results period options above the Retroscan results table. You can select one of the following periods:
- Day
- Week
- Month
- 3 months
- All time
- Custom range
Specifying the time period for retroscan results
Viewing results of a single reptrospective scan
To view detailed information about a single retrospective scan task:
- In the Retroscan results table, locate the result (containing detected indicators) that you want to view in detail.
- Click the link in the Detected indicators column.
On the page that opens, you can see detailed information about the first 50 detection events. To see all events, download the full report in CSV format (see below).
On the page, the following information is displayed:
- Date and time of the retrospective scan
- Number of scanned events
- Number of scanned indicators
- Number of detected indicators
- Number of detection events by category
- Information about each detection event:
- Detected indicator
You can view detailed information about each indicator by clicking the indicator that you want.
- Category of the detected object
- Saved original event that contains detected indicator
- Tenant name that is associated with the original event
- Event source that sends the original event
- Context information about the detection event
- Detected indicator
Downloading a report with the results of the retrospective scan
To download a report:
Click the Download report link near the Detected indicators section.
The generated CSV file contains the following data:
- Date and time when the detection event received
- Tenant name that is associated with the original event
- Name of the event source
- Category of the detected object
- Detected indicator that caused the event
- Context information about the detection event
- Detection event
Viewing detections
On the Kaspersky CyberTrace web user interface you can select the Detections tab. This tab displays the detects that can meet the filtering conditions specified in the Filtering conditions section and contains the following sections:
- Information about detections
- Filtering conditions
The Detections section contains a table that provides the following information about detection events:
- Date and time of the detection event
This column contains system date and time of the event (in the
%M.%d.%Y %H:%i:%sformat). - Tenant name that is associated with event source
- Name of the event source
- Category of the detected object
Once recorded, the category name does not change, even if the corresponding supplier name changes.
- Detected indicator (the URL, hash, or IP address)
This column contains the indicator from the database that was matched to the incoming event.
- Detection event
Detection event has the
%FieldName%: %Value%format.Here,
%FieldName%is the name of the regular expression is used for parsing incoming events or the field name of the feed record that matched the detected indicator.%Value%is the value of the regular expression is used for parsing incoming events or the value of the feed record that matched the detected indicator.
- Incoming event
Detections in the table are sorted by date and time in descending order.
You can update the table contents by clicking the Auto-update table toggle button. Kaspersky CyberTrace will then update the data in the table every 10 seconds.
Filtering conditions
In this section you can specify the following filtering conditions for the Detections table contents:
- Filtering by date and time when the detection event was seen.
You can specify a period or the particular date for the data to be displayed.
- Filtering by tenant name.
You can specify one or several tenant names.
- Filtering by event source.
You can specify one or several event sources.
- Filtering by category of the detected object.
You can specify one or several categories of the detected object.
- Filtering by text substring contained in the detection event.
You can specify only one text substring.
- Filtering by detected indicator.
You can specify one or several indicators.
By default, filtering conditions are not applied.
Page topWorking with indicators
Kaspersky CyberTrace uses the Elasticsearch database to store the indicators of compromise (IOC) from the threat intelligence feeds. This database contained in the Kaspersky CyberTrace distribution package.
On the Kaspersky CyberTrace web user interface you can select the Indicators tab. This section allows you to do the following:
- View the list of indicators from the indicator database (hereinafter, also called the database)
- Perform a search by indicator
- Add new indicators to the database
When a new indicator is successfully added to the database, it can be used in the matching process. Such indicators are written to the database by using the InternalTI value of the
supplier_nameattribute. - Delete indicators from the database
- Add existing indicators to the FalsePositive supplier (mark as false positive)
- Browse detailed information about indicators
- Filter indicators by suppliers
FalsePositive and InternalTI suppliers
The FalsePositive and InternalTI suppliers are built-in Kaspersky CyberTrace suppliers that you can add indicators to:
- A FalsePositive supplier is designed for existing indicators that users mark as false positives in CyberTrace Web
- An InternalTI supplier is designed for new indicators that users add to the database in CyberTrace Web or via the REST API
Search syntax
Kaspersky CyberTrace allows you to search the indicator database by the following attribute names:
Attribute name |
Description |
|
Indicator type. |
|
Indicator value. |
|
Date and time when the requested indicator was added to the database. |
|
Date and time of the last indicator update. |
|
Comment about the indicator. |
|
Summary information about the indicator from the InternalTI supplier. |
|
Date and time when the detection event was first received. |
|
Date and time when the detection event was last received. |
|
Name of the user who added the indicator to the InternalTI supplier / FalsePositive supplier. |
|
Flag for showing that the indicator can be used in the matching process. This flag is used for indicators that have to be deleted during an update of a supplier or on expiration of retention period, but were not, as they belong to the InternalTI supplier or such indicators were involved in the detection process. Use |
|
Date and time when the information related to the indicator from the supplier was last updated. |
|
Flag for sending detection events to the SIEM solution. |
|
Name of the indicator supplier. In Kaspersky CyberTrace, the following types of suppliers are supported:
|
|
Level of confidence of the supplier. |
|
Name of the supplier vendor. |
|
Context information related to the indicator. This attribute can contain nested attributes. The rule to search for all nested attributes is described below. |
Use the following syntax for search requests:
- If special symbols (+, -, =, &&, ||, >, <, !, (, ), {, }, [, ], ^, ", ~, *, ?, :, \, /) are not used in a search for a substring (see below), use an escape character to specify these symbols in the request body. Below you can see exceptions for using special symbols in search requests.
Kaspersky CyberTrace uses the
\escape character. - Use quotation marks to enclose particular substrings, parentheses to enclose logical blocks. For starting or ending values, use braces (
{}) for intervals that exclude the boundaries, and brackets ([]) for intervals that include the boundaries. Braces and brackets can be combined if you need to specify an interval with an opening bracket of one type and a closing bracket of another type. Quotation marks and all these types of brackets have to be in pairs in the search request.You can use quotation marks and all types of brackets unpaired in the following cases:
- If an unpaired bracket or quotation mark is used together with an escape character.
Example:
ioc_value:asd\} - If an unpaired bracket is enclosed in quotation marks.
Example:
ioc_value:"1234}"
- If an unpaired bracket or quotation mark is used together with an escape character.
- Do not use a tab character.
- Specify a colon (
:) only after the indicator attribute name or use it together with an escape character. - Do not specify an empty value in parentheses, except when this value is specified with an escape character or is enclosed in quotation marks.
Example of the incorrect request:
( )Example of the correct request:
(" ") - In braces (
{}) and brackets ([]), use the%begin_value% TO %end_value%pattern, where%begin_value%and%end_value%are the values intended for open and closed intervals (except when brackets are enclosed in quotation marks).Example of an incorrect request:
[* 100]Example of a correct request:
[* TO 100] - Do not specify an empty value when searching for a specific attribute.
Example of an incorrect request:
ioc_type:Example of a correct request:
ioc_type:url - Use logical operators (
AND,OR,NOT) without quotation marks and all uppercase. - Enclose logical
AND,ORin spaces. You may not use a logicalNOTwith left space ifNOTis specified just after the left parenthesis or colon.Example of an incorrect request:
supplier_confidence:(89OR91)Example of a correct request:
supplier_confidence:NOT(89 OR 91) - Do not specify an empty value after a logical operator.
Example of an incorrect request:
supplier_confidence:(89 OR )Example of a correct request:
supplier_confidence:(89 OR 91) - For the
ioc_supplier_contextattribute, use a period when searching for a specific nested attribute.Example:
ioc_supplier_context.files.threat:"HEUR:Exploit.SWF.Generic" - For the
ioc_supplier_contextattribute, if your search string contains a space character, use the "\" (backslash) escape character before the space character.Example:
ioc_supplier_context.details.SMS\ Number:1003 - For the
ioc_supplier_contextattribute, use theioc_supplier_context.\\*pattern to search for all nested attributes.Example:
ioc_supplier_context.\\*:HEUR - Use the asterisk (
*)for any other sequence of characters and question mark (?)for a single character as wildcards in substitutes.Example:
sea*The use of an asterisk (
*) at the beginning of the request can lead to checking all attribute values from the indicator database. This usually causes a long wait for a response from the database.
Examples
The following request will display all indicators that contain an at, ca, kr, ru, ir substring in any of the indicator attributes:
"at, ca, kr, ru, ir" |
The following request will display all indicators that have a supplier_confidence attribute value that is equal to 89 or 91:
|
The following request will display all indicators that have an ioc_value attribute value containing the 123321 substring:
ioc_value:"123321" |
The following request will display all indicators that were added to the database between 2012-01-01 and 2012-12-31 (including the boundaries):
ioc_created_date:[2012-01-01 TO 2012-12-31] |
The following request will display all indicators that have a level of confidence in the range of 10 to 50 (excluding the boundaries):
supplier_confidence:{10 TO 50} |
The following request will display all indicators that have a threat_score context field value greater than 75:
ioc_supplier_context.threat_score:[75 TO *] |
The following request will display all indicators that have a files/threat context attribute containing the HEUR:Exploit.SWF.Generic substring:
ioc_supplier_context.files.threat:"HEUR:Exploit.SWF.Generic" |
The following request will display all indicators that have context attributes with any nesting level that contains the HEUR value:
ioc_supplier_context.\\*:HEUR |
Search result
After a search is performed, CyberTrace Web displays a table with the requested indicators. This table can be sorted by columns. For each of these indicators, you can view the following data:
- Type of the requested indicator
The indicator can be of several types (for example, IP and URL).
- Tag indicating whether the requested indicator belongs to the FalsePositive supplier
The table does not display indicators which are contained only in the false positives list (and were not added to CyberTrace from a feed or using the REST API or Kaspersky CyberTrace Web). To manage indicators which are contained only in the false positives list, select the Settings tab, and then the Feeds tab.
- Value of the requested indicator
- Date and time when the requested indicator was added
- Date and time of the latest indicator update
- Suppliers that contain the requested indicator
Below the table is the number of indicators returned after a search is performed. If you do not perform a search, the total number of unique indicators for all enabled suppliers is displayed. The table does not contain repeated indicator values and corresponding suppliers are listed in the Suppliers column. Thus, duplications of indicator values are discarded from the total number.
Adding new indicators to the database
To add a new indicator to the database:
- Click the Add link.
The Add new indicator window opens.
- Select the indicator type.
- Specify the indicator value.
Kaspersky CyberTrace will apply URL normalization rules to any URL that you add on the URL tab and which are not yet contained in the indicator database, thus, the representation of these URLs may change. For example, if you add a URL that contains a port, this port value will be removed.
- Add indicator attributes by specifying their names and values.
The name can be up to 255 characters in length, must contain only lowercase Latin letters and cannot begin with a hyphen ("-") and an underscore ("_"). The space symbol (" ") and the tab symbol cannot be used. Also, the attribute name cannot be equal to
summary. - In the text field, enter summary information about the indicator, if necessary.
- Click Save.
After that, the indicator will be added to the database with the InternalTI value of the supplier_name attribute.
Adding existing indicators to the list of false positives
To add an existing indicator to the list of false positives:
- Select the indicator (or several indicators) that you want to mark as false positive.
- If some of selected indicators are of several types, perform one of the following:
- Click the Mark as False Positive <Type> button, where <Type> is the indicator type that you want to mark as a false positive
- Click the Mark all as False Positive button, if you want to mark all indicator types as false positive
- If none of selected indicators has several types, click the Mark as false positive button.
- Click Mark to confirm that you want to mark the selected indicator (or several indicators) as false positive.
Deleting indicators
To delete an indicator:
- Select the indicator (or several indicators) that you want to delete.
- Click the Delete button.
The Delete indicator window opens.
- Click Yes to confirm that you want to delete the selected indicator (or several indicators).
Browsing detailed information about indicators
You can learn more about the indicators from the table by clicking the indicator that you want. You will go to a page that will provide you with the following information:
- Type of the requested indicator
The indicator can be one of several types (for example, IP and URL).
- Value of the requested indicator
- List of event sources that are associated with the requested indicator
- Tag indicating whether the requested indicator belongs to the FalsePositive supplier
- Date and time when the requested indicator was added
- Date and time of the latest indicator update
- Link to information about the indicator on Kaspersky Threat Intelligence Portal
- Link to the Kaspersky CyberTrace Web page that displays detection events
- External analysis links to the resources that contain additional information about indicators
For the full list of these resources, see subsection "External resources with additional information about indicators" below.
On this page you can perform the following actions:
- Delete the indicator
- Add information related to the InternalTI supplier, including adding or changing context information and summary
An indicator can be one of several types. In this case, you will be asked which type of indicator to add to the Internal TI list.
- Mark the indicator as a false positive or delete the indicator from the list of false positives
An indicator can be one of several types. In this case, you will be asked which type of indicator to mark as a false positive or delete from the list of false positives.
- Enable or disable a flag that indicates whether to generate detection events when the matching process is complete
- Add or delete comments related to the indicator
External resources with additional information about indicators
Below is a list of external resources that provide additional information about each type of indicator.
For the MD5, SHA1, and SHA256 indicator types, the following resources can be displayed:
- #totalhash
- AlienVault OTX
- VirusTotal
- IBM X-Force
- RecordFuture
- URLScan
- ThreatMiner
For the IP indicator type, the following resources can be displayed:
- #totalhash
- AlienVault OTX
- VirusTotal
- IBM X-Force
- Shodan
- URLScan
- ThreatMiner
- IPInfo
For the DOMAIN indicator type, the following resources can be displayed:
- #totalhash
- AlienVault OTX
- VirusTotal
- IBM X-Force
- Shodan
- URLScan
- ThreatMiner
For the URL indicator type, the following resources can be displayed:
- #totalhash
- AlienVault OTX
- VirusTotal
- IBM X-Force
- ThreatMiner
- WebArchive
Viewing tasks
To keep you informed about the current status and usage of Kaspersky CyberTrace, starting with version 4.0, Kaspersky CyberTrace provides you with information about running tasks.
In Kaspersky CyberTrace, there are two types of tasks:
- Tasks launched by a user (on demand tasks).
- Tasks launched by Kaspersky CyberTrace (scheduled background tasks).
As a user without administrator rights, you can see the tasks that you have launched.
As Administrator, you can see all tasks launched by all users, as well as scheduled background tasks. You can identify the type of a task by looking at its Name property: For scheduled background tasks, CyberTrace is displayed.
As Administrator, you have access to the following information about scheduled background tasks:
- Regular feeds update.
- Calculation of overlap between the suppliers used in Kaspersky CyberTrace (suppliers intersections).
- Regular retrospective scan.
- Regular update of the indicators export.
Kaspersky CyberTrace displays running tasks and finished tasks separately, and you can switch between them by using the Running / Finished element at the top of the page.
Each task in the list includes the following information:
- State of each task (in progress / success / failure / canceled).
The Administrator can disable the display of the state of scheduled tasks.
- Date and time when a task was launched.
- Name of the user who launched a task.
- Date and time when a task was finished.
You can sort the list by clicking the column headers.
Kaspersky CyberTrace updates the list every second and stores information about each task for seven days.
Page topApplication for Splunk
This chapter explains how to use Kaspersky CyberTrace App for Splunk.
About Kaspersky CyberTrace App for Splunk
Kaspersky CyberTrace App for Splunk is a Splunk app. It does the following:
- Displays information about URLs, IP addresses, and hashes from events that match Kaspersky Threat Data Feeds in the Kaspersky CyberTrace Matches dashboard.
- Displays information about Kaspersky CyberTrace status in the Kaspersky CyberTrace Status dashboard.
- Matches individual URLs, IP addresses, and hashes to Kaspersky Threat Data Feeds by performing a lookup on the Indicators lookup tab.
- Performs Self-test and displays the feeds in use.
Additionally, Kaspersky CyberTrace App for Splunk comes with alert templates that demonstrate the basic trigger conditions that can be used with Kaspersky CyberTrace.
About Kaspersky CyberTrace App dashboards
Kaspersky CyberTrace App uses the following dashboards:
- Kaspersky CyberTrace Matches
This dashboard provides information about URLs, IP addresses, and hashes from events that matched Kaspersky Threat Data Feeds, together with statistical information and a log of matches.
- Kaspersky CyberTrace Status
This dashboard provides match statistics for Feed Service and a log of alerts received from it. The dashboard can also be used to run the Self-test of Kaspersky CyberTrace App for Splunk.
- Indicators lookup
This tab allows you to configure and perform a lookup by indicator.
- Alerts
This is a standard Alerts dashboard. Kaspersky CyberTrace App for Splunk comes with several alert templates that you can use and customize from this dashboard.
- Kaspersky CyberTrace online documentation
Link to the online documentation for Kaspersky CyberTrace.
Kaspersky CyberTrace Matches dashboard
The Kaspersky CyberTrace Matches dashboard provides information about URLs, IP addresses, and hashes from events that match Kaspersky Threat Data Feeds, together with statistical information and a log of matches.
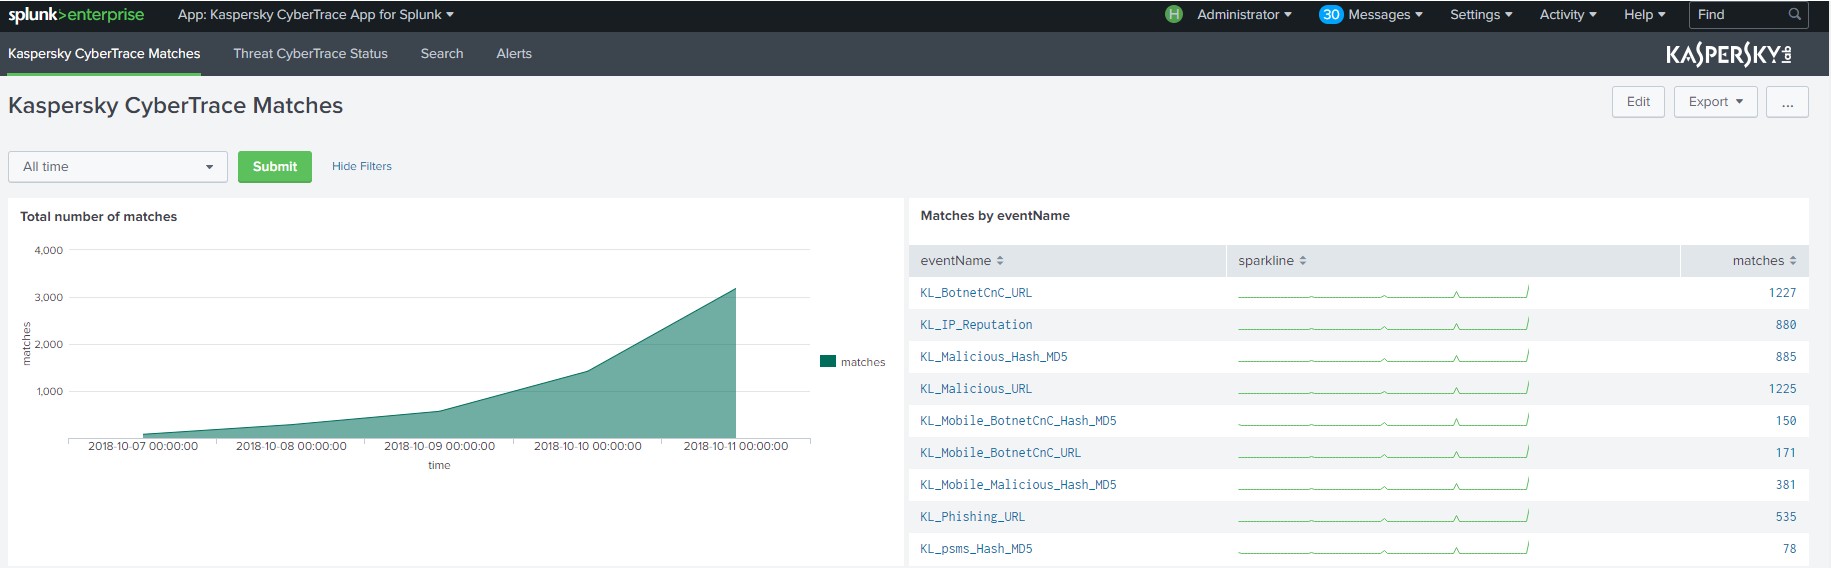
Kaspersky CyberTrace Matches dashboard
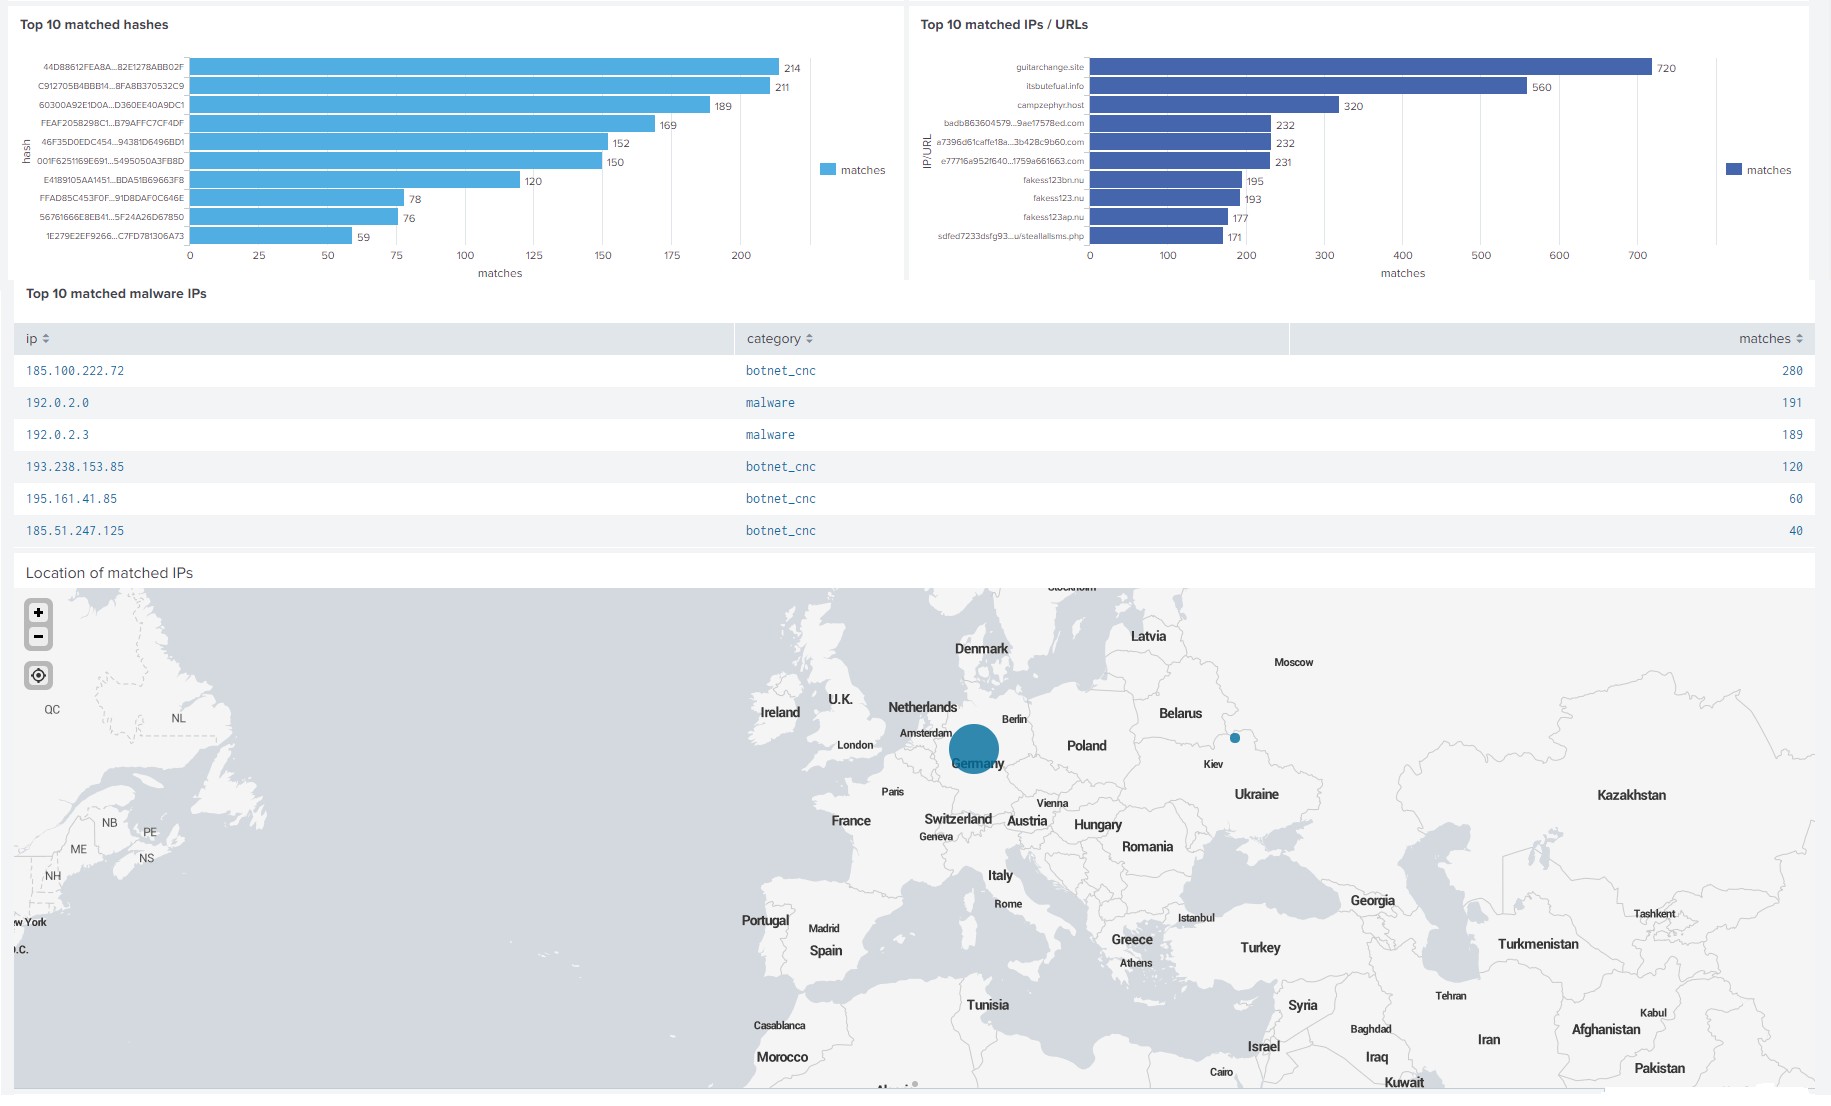
Top 10 panels
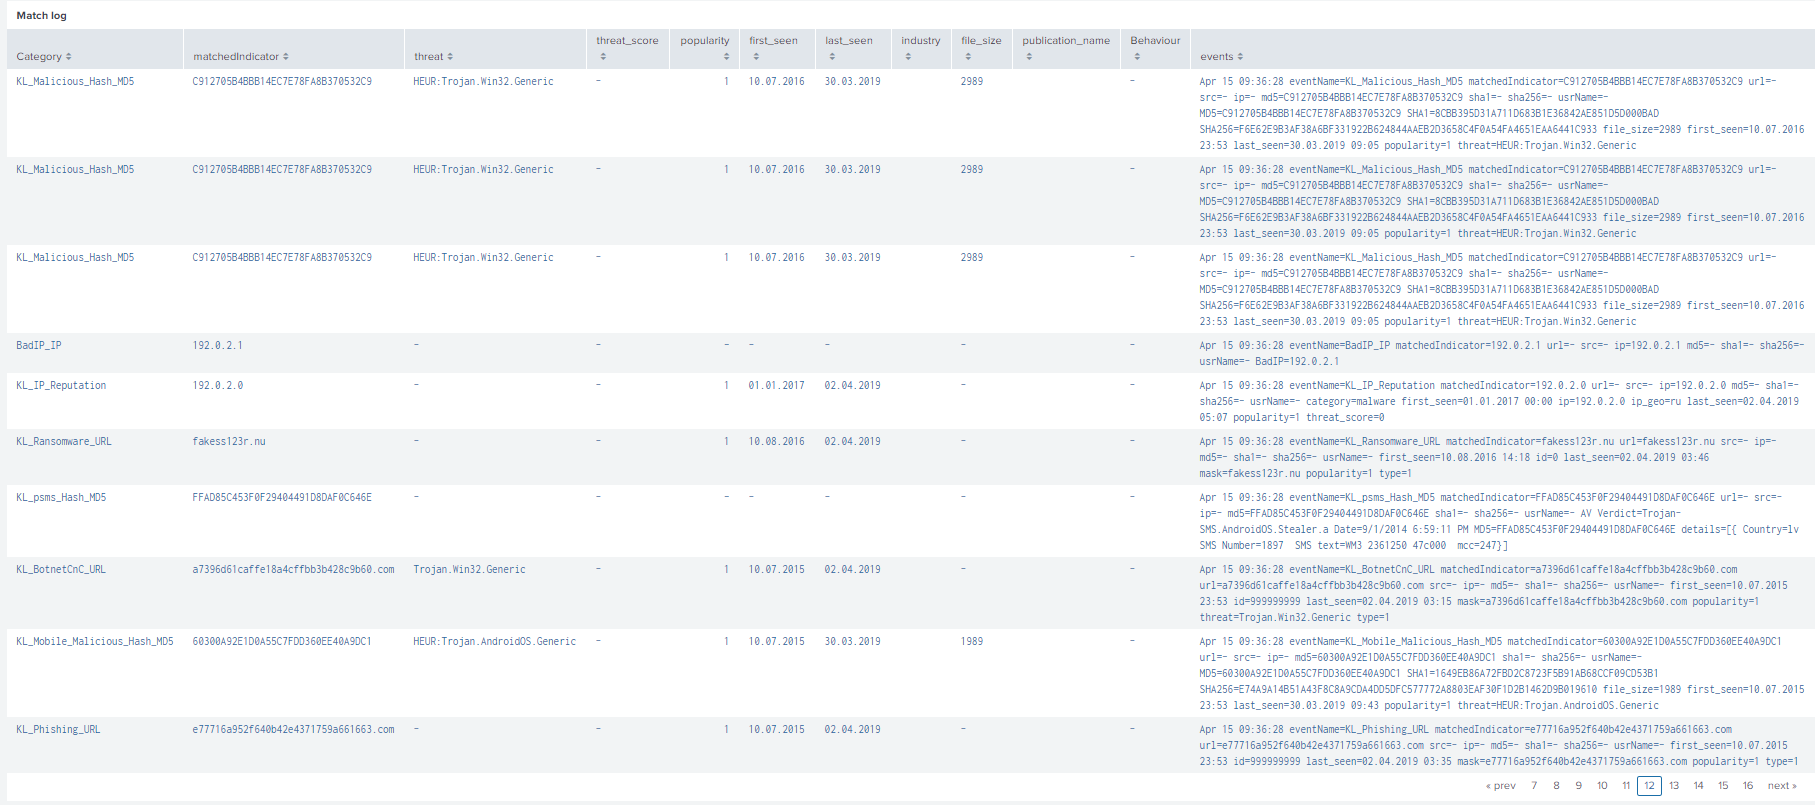
Match log panel
There is a time range picker and several panels on this dashboard:
- Time range picker
You can use it to select a time range for the displayed information.
- Total number of matches
This panel displays a chart of the total number of matches with all feeds used by Feed Service.
- Matches by the
eventNamefieldThis panel displays a table with the number of matches for each category.
- Top 10 matched hashes
This panel displays a bar chart of matches for the top 10 hashes.
- Top 10 matched IPs / URLs
This panel displays bar charts of matches for the top 10 IP addresses and URLs.
- Top 10 matched TOR / malware / spam IPs
This panel displays bar charts of matches for the top 10 IP addresses of Tor exit nodes, malicious IP addresses, and spam IP addresses.
- Location of matched IPs
This panel displays a map with the locations of matched IP addresses.
- Match log
This panel displays a table with a log of all matches, including actionable context for each match. The actionable context fields below will be displayed. These are fields that you can insert into outgoing events separately from the context of feed records.
- First_seen
- Last_seen
- Popularity
- Threat
- Publication name
- Industry
- Threat_score
- File_size
- Behavior
Kaspersky CyberTrace Status dashboard
The Kaspersky CyberTrace Status dashboard provides match statistics for Feed Service, and displays a log of alerts generated by Feed Service.
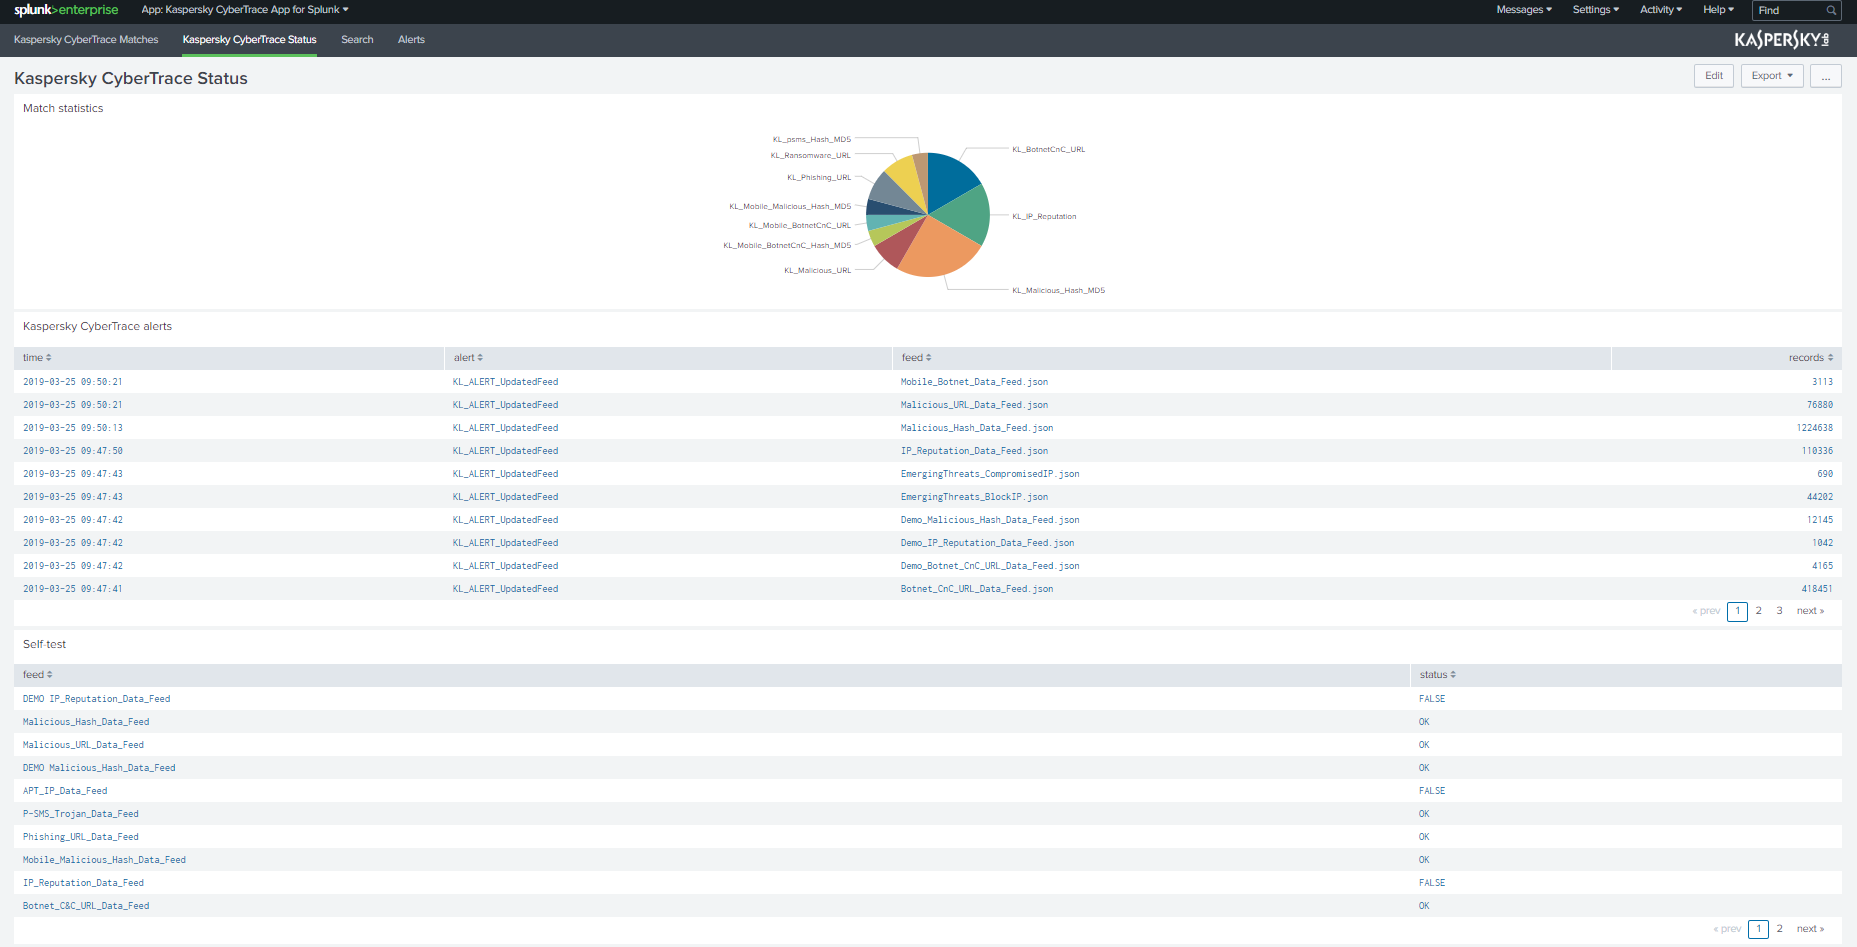
Kaspersky CyberTrace Status dashboard
The Kaspersky CyberTrace Status dashboard has three panels:
- The Match statistics panel
- The Kaspersky CyberTrace alerts panel
- The Self test panel
Match statistics panel
This panel displays a pie chart of matches for each category returned by Feed Service.
Kaspersky CyberTrace alerts panel
This panel displays a table with a log of alerts generated by Feed Service.
Self test panel
This panel displays a table with Self-test results.
These settings are used for performing the self-test on the Kaspersky CyberTrace Status tab.
The Self-test is performed automatically when you open the Kaspersky CyberTrace Status dashboard. The following status values are possible:
- OK
The feed is turned on and the matching for this feed was successful.
- FALSE
The feed is turned off or is processed incorrectly by Feed Utility or Feed Service.
To perform a lookup, Kaspersky CyberTrace connection settings are used. These settings are specified on the Indicators lookup tab.
Page topIndicators lookup
The Indicators lookup tab allows you to do the following actions:
- To perform a lookup by a single indicator.The following formats can be used:
%INDICATOR%, if Kaspersky CyberTrace uses general regular expressions (regular expressions that are not associated with binding to a specific field).%FIELDNAME%=%INDICATOR%, if Kaspersky CyberTrace uses regular expressions that expect the%INDICATOR%value to be specified in the%FIELDNAME%field.
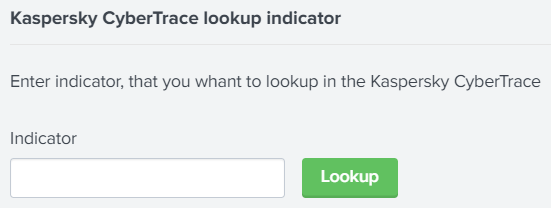
Lookup by a single indicator
- To configure a lookup by indicator. These settings will be applied to any indicator that is involved in the lookup process only if you perform a lookup by some indicator. These settings are also used for performing the Self-test in the Kaspersky CyberTrace Status tab. The settings will be placed in the Splunk storage.
In this section, you can specify the IP address and port of Kaspersky CyberTrace.
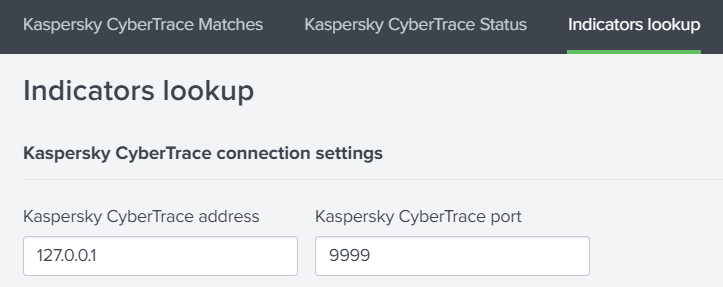
Kaspersky CyberTrace connection settings
- To browse detailed information about the indicator.
You can learn more about the indicator that you need by clicking the lookup result. The link redirects you to the Kaspersky Threat Intelligence Portal page that contains information about the object.
Alert templates
Kaspersky CyberTrace App for Splunk comes with several alert templates that you can use and customize from the Alerts dashboard.
Alert templates and triggers
Following alert templates are available:
- Matches alert
This alert is triggered if there were matches with Kaspersky Threat Data Feeds in the past 24 hours.
- No Matches alert
This alert is triggered if there were no matches with Kaspersky Threat Data Feeds in the past 24 hours.
- Emergency alert
This alert is triggered if there were 5000 matches with Kaspersky Threat Data Feeds in the course of 1 minute.
- Service Unavailable alert
This alert is triggered if Feed Service is unavailable.
This alert contains the date when the alert was generated followed by a timestamp in the UNIX time format.
- Service Started alert
This alert is triggered when Feed Service is started.
This alert contains the date when the alert was generated followed by a timestamp in the UNIX time format.
Alert actions
By default, the Add to Triggered Alerts action is defined for all alerts. As an option, you can add a Send email action so that Splunk will send an email message to the email address specified for the action.
Creating notifications about incoming service events
You can create notifications about incoming Kaspersky CyberTrace service events by configuring alert rules.
To create notifications about service events from Kaspersky CyberTrace in Splunk:
- On the Search and Reporting app for Splunk menu, select the Search tab.
- In the search box, specify a condition for creating alerts. For example:
sourcetype="kl_cybertrace_events" alert="KL_ALERT_ServiceStopped"This condition defines the request for searching alert events that are generated when Feed Service is stopped.
- Click the Search button () to make sure that the specified request is performed correctly.
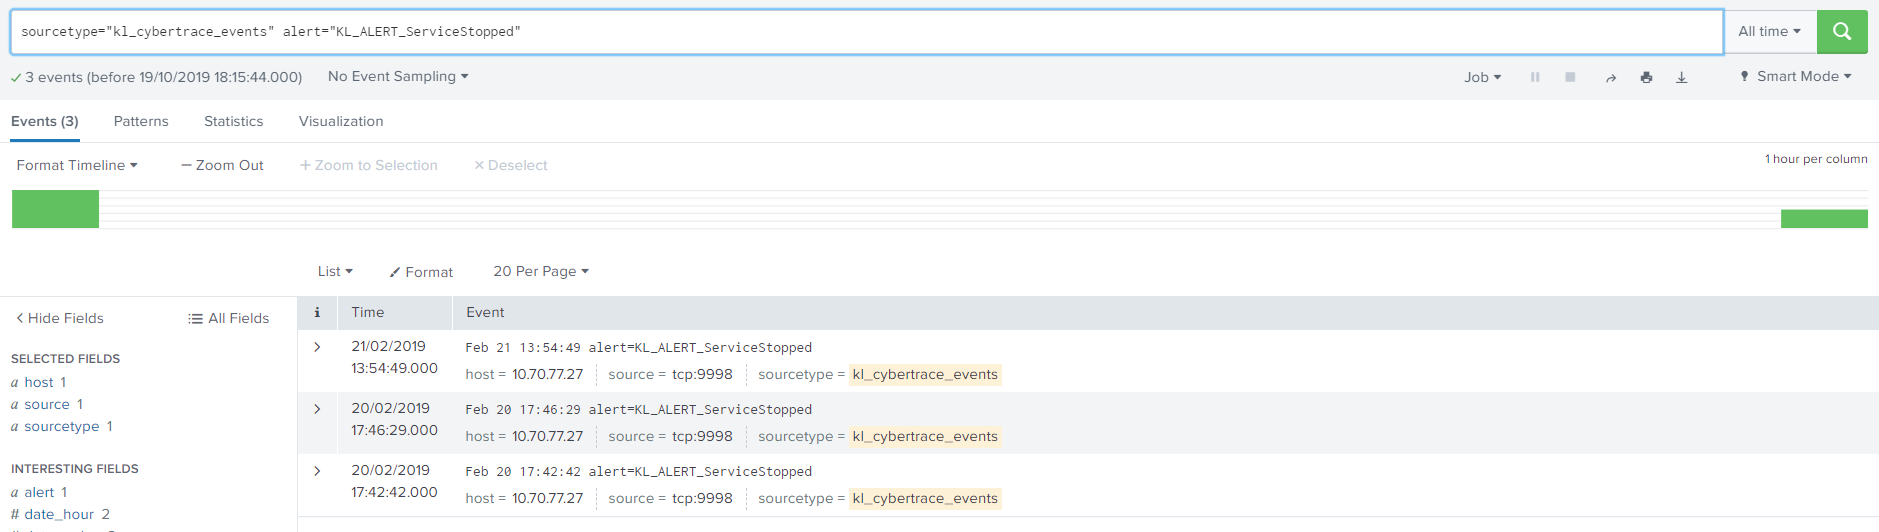
KL_ALERT_ServiceStopped events
- Click Save as and select Alert.
Saving alert
The Save As Alert window opens.
- In the Save As Alert window, specify the following settings:
- In the Title field, specify the name of the alert.
You can specify any title.
- In the Description field, specify the alert description.
You can specify any description.
- In the Alert type field select the one of the following:
- Scheduled—If you want to check events for matching the specified conditions regularly.
- Real-time—If you want to check events for matching the specified conditions in real time.
- In the Trigger field, specify For each results.
- Select the Throttle check box and then, if necessary, specify the amount of time during which Splunk will not send new alerts if the rule is triggered.
- In the Trigger Actions field, specify the way in which Splunk notifies when an alert is triggered.
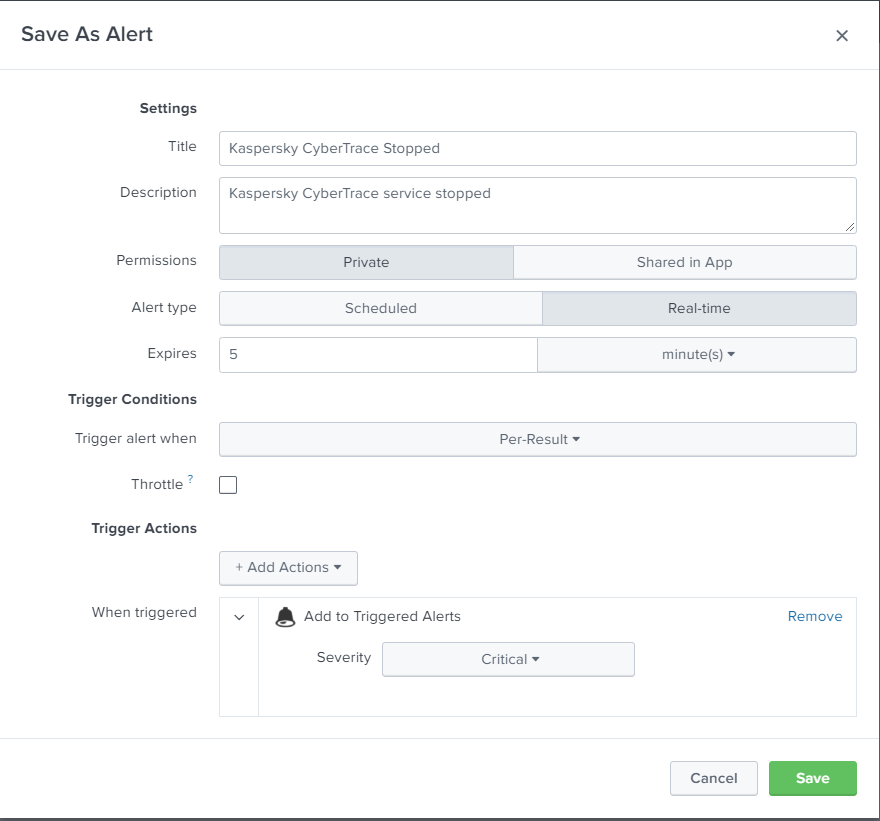
The Save As Alert window
- In the Title field, specify the name of the alert.
- Click Save.
The rule will now appear in Splunk.
About Kaspersky Threat Feed App
Kaspersky Threat Feed App is a QRadar application that gives you access to Kaspersky threat intelligence (TI). It provides the following features:
- Search within the feeds database
- Charts that contain information about detections
- Lists of most popular indicators of compromise (IoC) detected by Feed Service
- Information about Feed Service health
This information is displayed in the Service events table. The
KL_ALERT_OutdatedFeedevents are marked with the Outdated feed icon ( ).
). - Last 10 events from Feed Service
Some custom event properties are provided together with Kaspersky Threat Feed App. These event properties are the fields of detection events sent by Feed Service.
Page topUsing Kaspersky Threat Feed App
This section describes how you can use Kaspersky Threat Feed App.
Search for data in feeds
You can search feeds for a file hash, IP address, or URL. For this purpose, in the search box type the data you want to search for, and then press Enter.

Search box
Kaspersky Threat Feed App will display the feed records that contain the data you specified.
Configuring charts
You can configure a chart so that it will display data accumulated during a specified period: 15 minutes, an hour, a day, a week, or a month.
Also, you can turn on or off regular automatic updating of charts.
Filtering by categories
The Detection events by category chart displays only data that relates to categories that are enabled. To disable a category or to enable a disabled category, select it in the list.
Page topUninstalling Kaspersky Threat Feed App
This section describes how to uninstall Kaspersky Threat Feed App.
To uninstall Kaspersky Threat Feed App:
- In QRadar, select Admin > Extensions Management.
- In the Extensions Management form, select the INSTALLED tab.
- Select the
Kaspersky Threat Feed Appitem and click Uninstall.
After Kaspersky Threat Feed App is uninstalled, the Kaspersky Data Feeds tab disappears from QRadar Console. However, the custom event properties that were added during the Threat Feed Service App installation remain. You can remove them manually.
To remove custom event properties manually:
- In QRadar, select the Admin tab and under Data sources, in the Events section, select Custom Event Properties.
The Custom Event Properties window opens.
- Select the custom event properties that you want to remove.
The list of the custom event properties that were added during the installation of Kaspersky Threat Feed App is provided in the section about installing Kaspersky Threat Feed App.
- Click Delete.
If you have created a token for Kaspersky Threat Feed App using Authorized services, you can remove it.
To remove a token for Kaspersky Threat Feed App:
- In QRadar Console, select the Admin tab.
- In the left navigation pane, click System Configuration.
- In the right pane, under User Management click Authorized Services.
The Manage Authorized Services window opens.
- In the displayed list of services, select the service that was created for Kaspersky Threat Feed App.
As an example, in the figure below the service is called "kaspersky app".
- Click the Delete Authorized Service button.
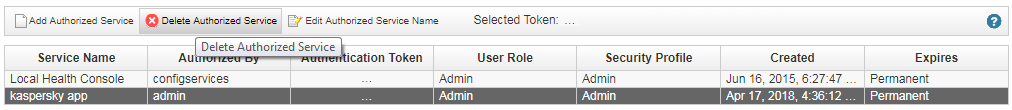
Removing a token for Kaspersky Threat Feed App
Authorized services
Kaspersky Threat Feed App uses the QRadar RESTful API to interact with QRadar. To authenticate API calls to QRadar Console, the QRadar RESTful API uses either authorized services or QRadar users. This section describes how to add an authorized service and receive an authorization token associated with it.
The main difference between using a QRadar user login and password and using a token is the following: when you create a new user, it exists until you explicitly remove it, while a token is usually assigned a period during which it is valid.
To add an authorized service:
- In QRadar Console, select the Admin tab.
- In the left navigation pane, click System Configuration.
- In the right pane, under User Management click Authorized Services.
The Manage Authorized Services window opens.
- Click the Add Authorized Service button.
The Add Authorized Service window opens.
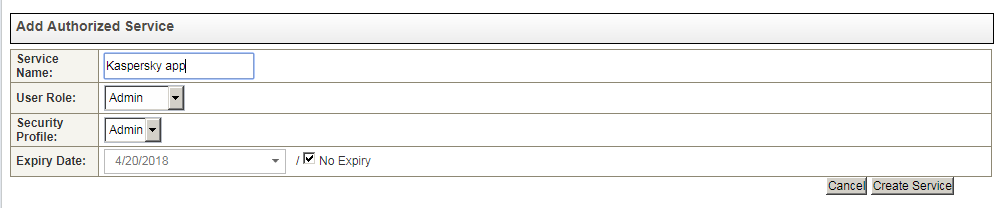
Add Authorized Service window
- In the Service Name field, type a name for this authorized service (for example,
Kaspersky Data Feeds App).The name can be up to 255 characters in length.
- From the User Role drop-down list, select the Admin user role to assign to this authorized service.
The user roles that are assigned to an authorized service determine the functions to which this service can gain access through the QRadar user interface.
- From the Security Profile drop-down list, select the Admin security profile to assign to this authorized service.
The security profile determines the networks and log sources that this service can access through the QRadar user interface.
- In the Expiry Date field, type or select a date of expiration for this service. If a date of expiration is not required, select No Expiry.
- Click Create Service.
A confirmation message appears containing a token field that you must copy into your vendor software to authenticate with QRadar.
More information about authorized services is available at https://www.ibm.com/support/knowledgecenter/SS42VS_7.3.0/com.ibm.qradar.doc/t_qradar_adm_add_auth_serv.html.
After you add an authorized service, QRadar notifies you whether the changes must be deployed.
To deploy the changes:
- In QRadar Console, select the Admin tab.
- Click Deploy Changes.
Working with events in ArcSight
This chapter describes how to work with events in ArcSight.
Dashboards
After the ARB package is imported to ArcSight, the following dashboards become available:
- CyberTrace Detection map
Displays all devices that sent events containing malicious URLs, IP addresses, or hashes. This map displays all feeds that were involved in the detection process.
- CyberTrace match statistics
Detection statistics: how many times a specific feed was involved in the detection process. If a feed has not been involved in the detection process, the dashboard does not display it.
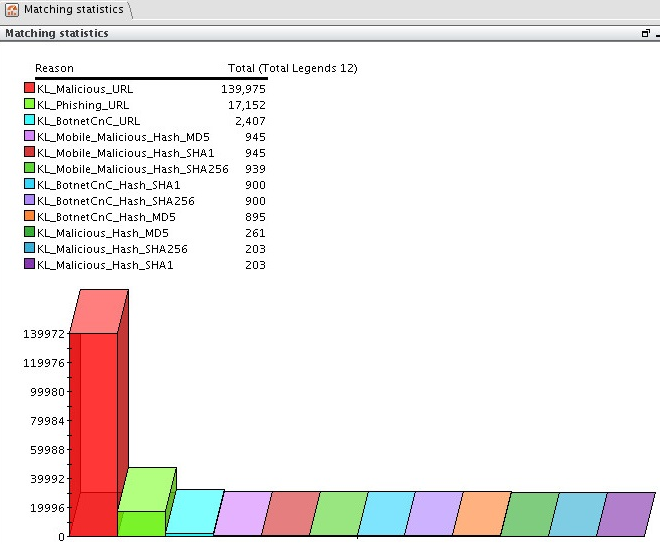
Matching statistics dashboard
- CyberTrace TOP 10 matched indicators
Contains three charts:
- CyberTrace TOP 10 matched IPs
Top 10 detected IP addresses.
- CyberTrace TOP 10 matched URLs
Top 10 detected URLs.
- CyberTrace TOP 10 matched hashes
Top 10 detected hashes.
- CyberTrace TOP 10 matched IPs
The dashboards display data collected during the last 48 hours.
You can enable a disabled dashboard by clicking the Enable Data Monitor split button ( ) and selecting Enable Data Monitor in the drop-down list.
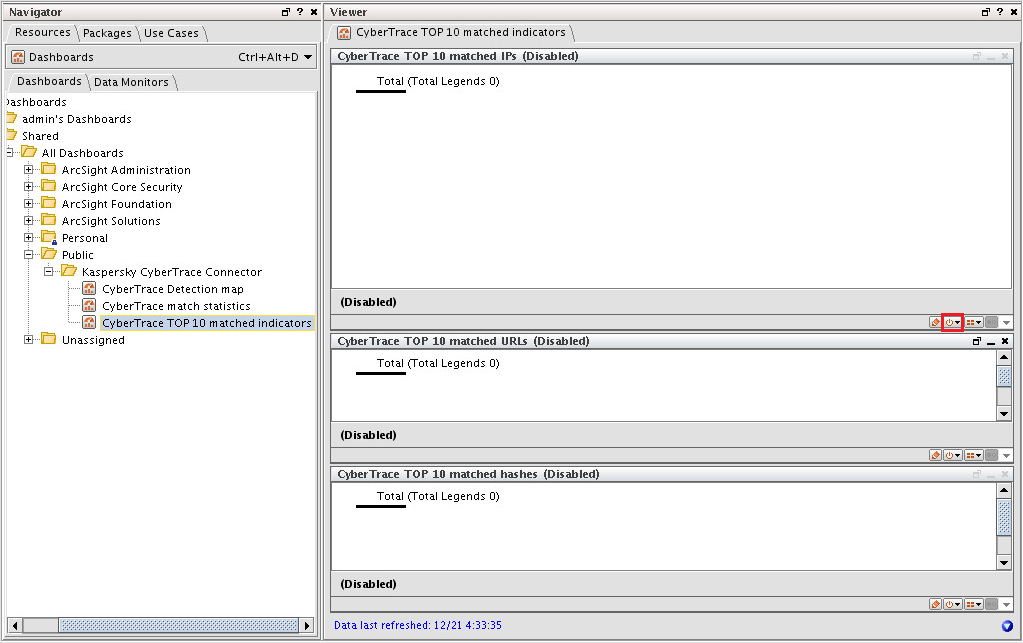
Enable Data Monitor button
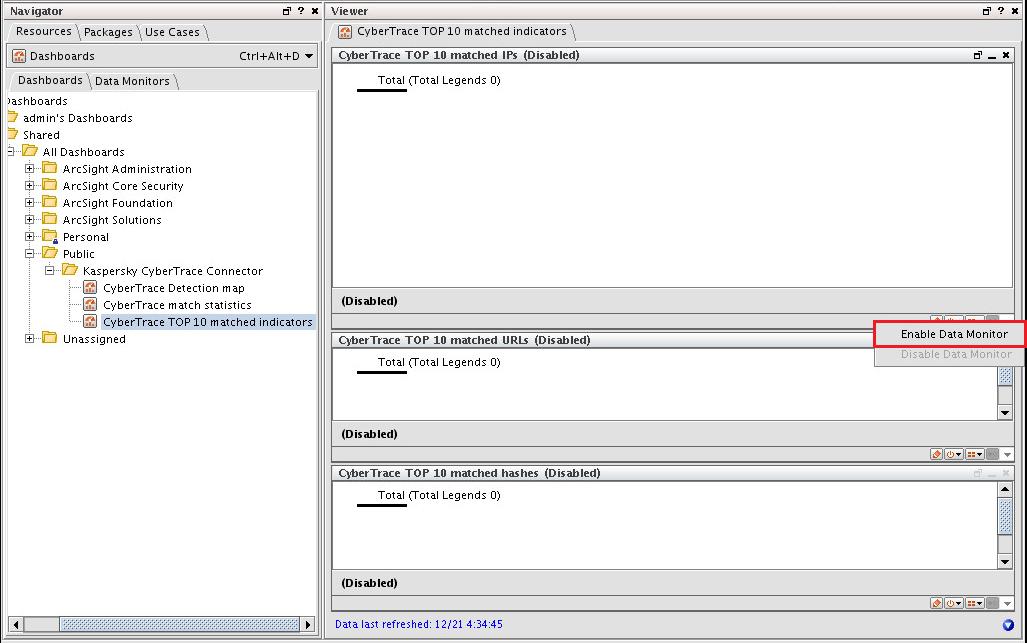
Enabling a dashboard in versions 6.8 and 6.11
The instructions above are relevant for ArcSight ESM versions 6.8 and 6.11. To start using a dashboard in ArcSight ESM version 7.0, select Dashboards and then the Data Monitors tab. In the console tree, select Data Monitors > Shared > All Data Monitors > Public.
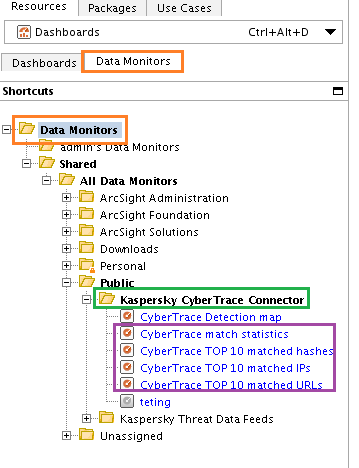
Enabling a dashboard in ArcSight ESM version 7.0
Right-click Kaspersky CyberTrace Connector and select Edit Data Monitor. On the Attributes tab, specify 300 as the Bucket size in Seconds setting and 288 as the Number of Buckets setting.
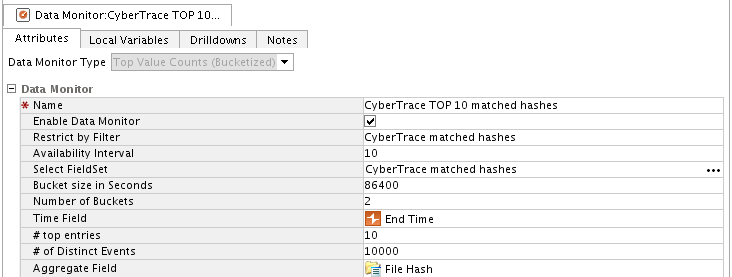
Editing Data Monitor
After performing these actions, data for the last 24 hours will be displayed in the dashboard. Follow the same steps for all monitors except CyberTrace Detection map.
Page topActive Channels
When the ARB package is imported to ArcSight, the following active channels become available:
- CyberTrace alerts
Displays service events from Feed Service in real time.
- The Reason field contains the identifier of the service event.
- The Message field contains additional information about the event (if available).
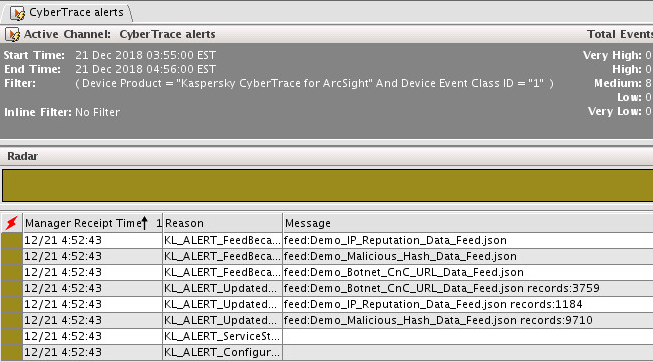
CyberTrace alerts active channel
- CyberTrace all matches
Displays detection events from Feed Service in real time.
- The Reason field contains the category of the detected object.
- The Detected indicator field contains the detected object.
- The Request Url field contains the URL that was detected in the event that was sent from ArcSight to Feed Service.
- The File Hash field contains the hash that was detected in the event that was sent from ArcSight to Feed Service.
- The Source Service Name field contains the name of the device vendor that sent the event to ArcSight.
- The Source Process Name field contains the name of the device that sent the event to ArcSight.
- The Event Outcome field contains the identifier of the original event that arrived in ArcSight and was then sent to Feed Service.
- The Message field contains a brief description of the detection. The description is in the following format: "
CyberTrace detected <name_of_the_feed_involved_in_the_detection_process>". - The Source User Name field contains the name of the user that was active on the endpoint device.
- The Source Address field contains the IPv4 address that identifies the source to which the original event refers in an IP network.
- The Destination Address field contains the destination IPv4 address that was detected in the event sent from ArcSight to Feed Service.
- The Device Action field contains the action taken by the device as specified in the original event.
- The Popularity, Threat Score, Threat, and other fields are taken from the feed that was involved in the detection process.
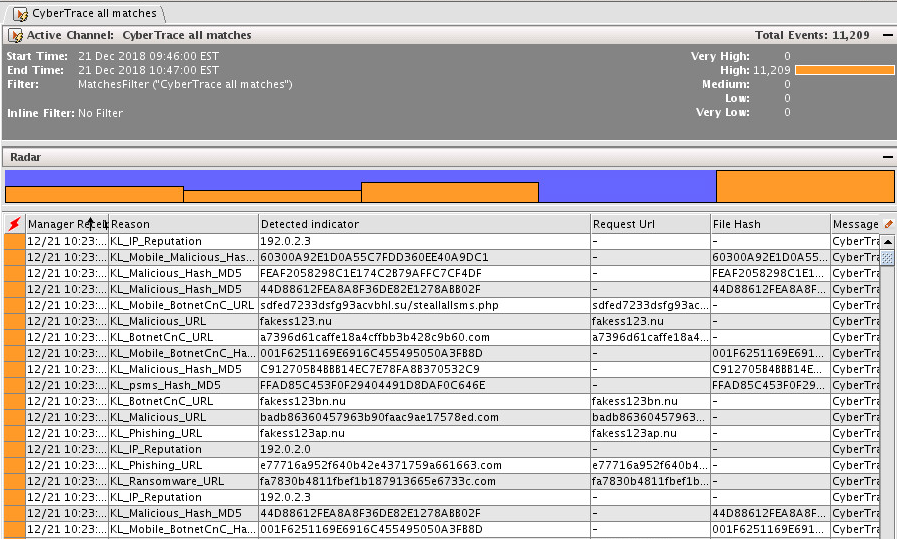
CyberTrace all matches active channel
- CyberTrace hash matches
Displays hash detection events from Feed Service in real time.
- CyberTrace URL matches
Displays URL detection events from Feed Service in real time.
- CyberTrace IP matches
Displays IP detection events from Feed Service in real time.
Filtering events to forward from ArcSight
This section describes how ArcSight filters the events to be forwarded to Feed Service.
Filter imported from the ARB package
After the ARB package is imported, ArcSight contains the CyberTrace forwarding events filter used for filtering events to be forwarded to Feed Service.
The original CyberTrace forwarding events filter selects those events containing an IP address in the Destination Address field, a URL in the Request URL field, or a hash in the fileHash field that are sent by a device of one of the following vendors:
- Cisco
- Microsoft
- Juniper Networks
- Trend Micro
- McAfee
- Imperva
- CheckPoint
- Blue Coat
- Apache
- Fortinet
- Sourcefire
- F5 Networks
- FireEye
- Palo Alto Networks
- Squid
- CyberTrace Verification Kit (for the verification test)
Additionally, the events selected by the original CyberTrace forwarding events filter must meet one of the following conditions:
- The
Source AddressorSource Host Namefield of an event is not empty and the value of theDestination Addressfield is not subnets192.168.0.0/16,172.16.0.0/12, or10.0.0.0/8. - The
Destination AddressorDestination Host Namefield of an event is not empty and the value of theSource Addressfield is not subnets192.168.0.0/16,172.16.0.0/12, or10.0.0.0/8. - The
Request URLfield of an event contains a URL. - The
fileHashfield of an event contains a hash.
The use of the original CyberTrace forwarding events filter can significantly diminish the performance of ArcSight ESM. To reduce the load on the ArcSight ESM computer, edit the filter so that it will send fewer events or will make fewer checks. For example, you can remove from the filter those vendors whose events do not arrive in ArcSight or that need not be checked by Feed Service.
Checking an existing filter
You may want to check whether the desired events are selected by an existing filter.
To check whether the desired events are selected by an existing filter:
- Create an active channel with the filter.
Right-click the filter node in the Filters tree and select Create Channel with Filter.
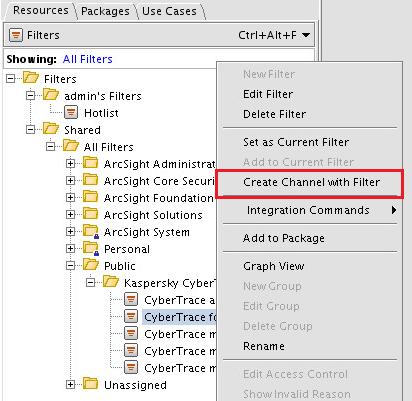
Creating a channel
- Optionally, set the time interval for events to be displayed.
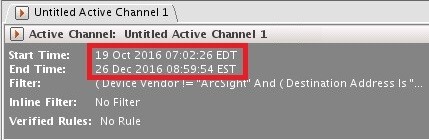
Setting the time interval
- Optionally, in the Inline Filter field, set an additional filter to narrow the output result.
For example, you can set the device vendor, device product, or both, for events to be displayed.
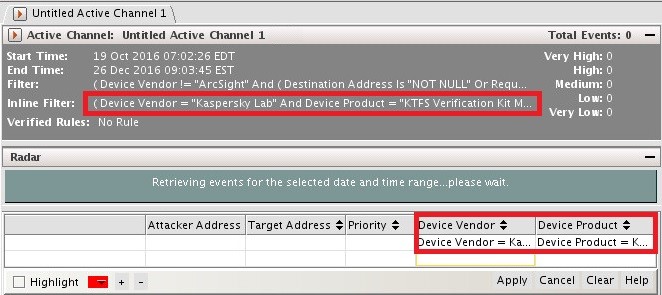
Setting the inline filter
- Make sure that the events you want selected (and that meet the added condition) are displayed in the created active channel.
Editing an existing filter
You may want to change an existing filter. For example, if no events from a specific device vendor are displayed in the active channel, you can add the device vendor to a condition in the filter that filters device vendors.
To add a device vendor to the filter:
- Open the filter.
- Select the Filter tab.
The filter conditions will be displayed, nested in the Event conditions tree item.
- Edit a Device Vendor condition and add to it the device vendor whose events must be sent to Feed Service.
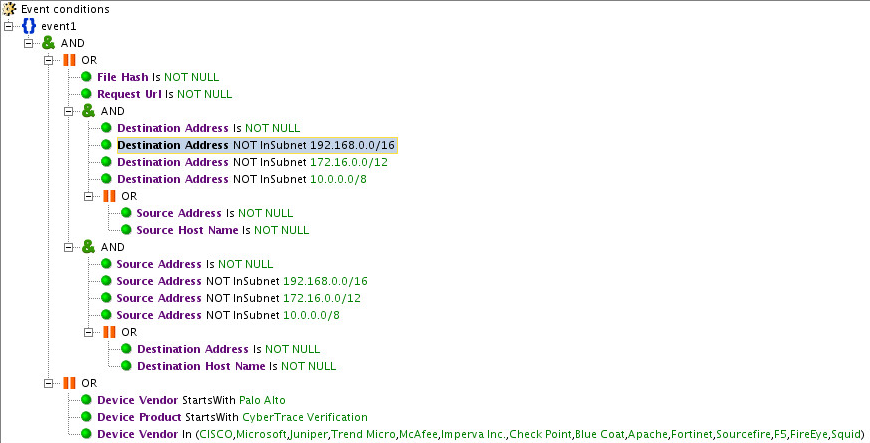
Filter conditions
Browsing event information in ArcSight
You can browse the information contained in an event in order to select fields for filtering or for adding to output events.
To browse event information in ArcSight,
In an active channel, double-click an event that will be forwarded to Feed Service.
ArcSight Console will display the Event Inspector tab, which will contain the event data.
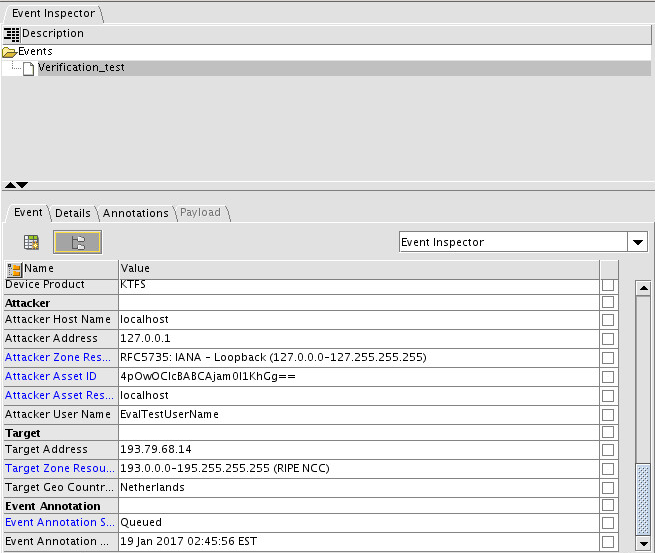
Event Inspector tab
Note that ArcSight and Feed Service operate events in CEF format, but ArcSight Console displays the event field names in human-readable form. The table below shows the correspondence between some of the field names in these two sets.
Field names in CEF format and in ArcSight Console
Field name in CEF |
Field name in ArcSight Console |
dst |
Destination Address |
dvc |
Device Address |
msg |
Message |
shost |
Source Host Name |
Creating notifications about incoming service events
You can create notifications about incoming Kaspersky CyberTrace service events by configuring alert rules.
To create notifications about service events from Kaspersky CyberTrace in ArcSight ESM:
- Run ArcSight Console.
- In the Navigator pane, select Rules in the drop-down-list.
- In the tree view, select the Rules > Shared > All Rules > Public directory.
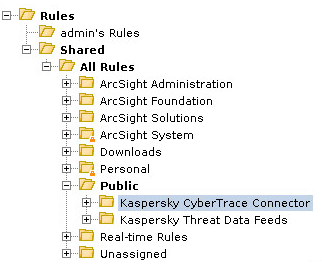
The Rules tree view
- Right-click the filter node in the Kaspersky CyberTrace Connector tree and select New Rule > Standard Rule.
- In the Inspect > Edit pane, specify the following settings:
- In the Name field of the Attributes tab, specify the name of the rule.
You can specify any name.
- On the Conditions tab, specify the following conditions:
Device Product = Kaspersky CyberTrace for ArcSightReason = %ServiceEventCode%Where
%ServiceEventCode%is a code of a service event that is used for generating notifications.
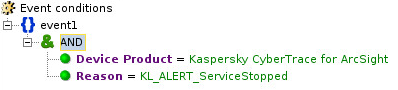
Event conditions
- Right-click the Actions tab, choose On Every Event and then select the following:
- Activate Trigger
- Add
This setting must contain the action that will be performed when a service event that is specified on the Conditions tab is received. For example, Send Notification.
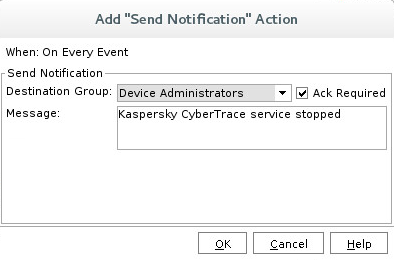
Adding actions
- In the Name field of the Attributes tab, specify the name of the rule.
- Click Apply.
Working with events in RSA NetWitness
This section contains instructions for working with Feed Service events in RSA NetWitness.
Browsing Feed Service events
This section describes how you can browse in RSA NetWitness the events sent from Feed Service.
To display in RSA NetWitness those events that are sent from Feed Service:
- On the RSA NetWitness menu, select Investigation > Navigate.
The Investigate window opens.
- On the Services tab, select the Concentrator that stores events from Feed Service (or the Log Decoder to which Feed Service sends events) and click the Navigate button.
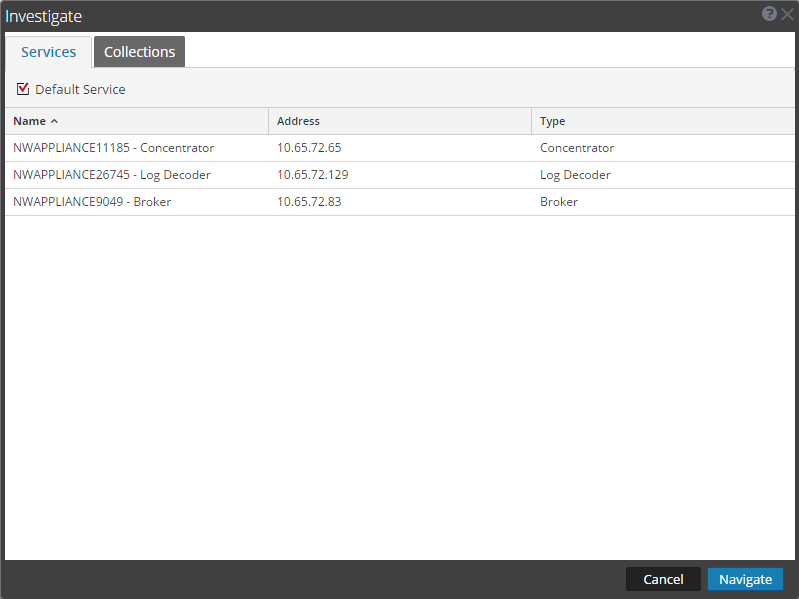
Investigate window
- On the Navigate toolbar, select Query.
Query toolbar button
A window for creating a query opens (the Create window).
- Select Advanced and specify the following query:
device.type='cybertrace'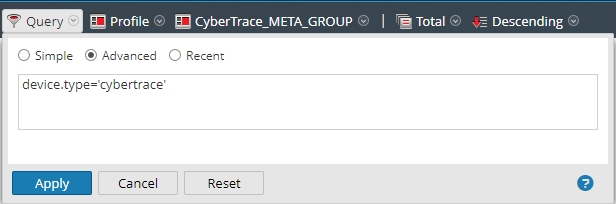
Specifying device type
- Click OK.
The Navigate view will display the events from Feed Service.
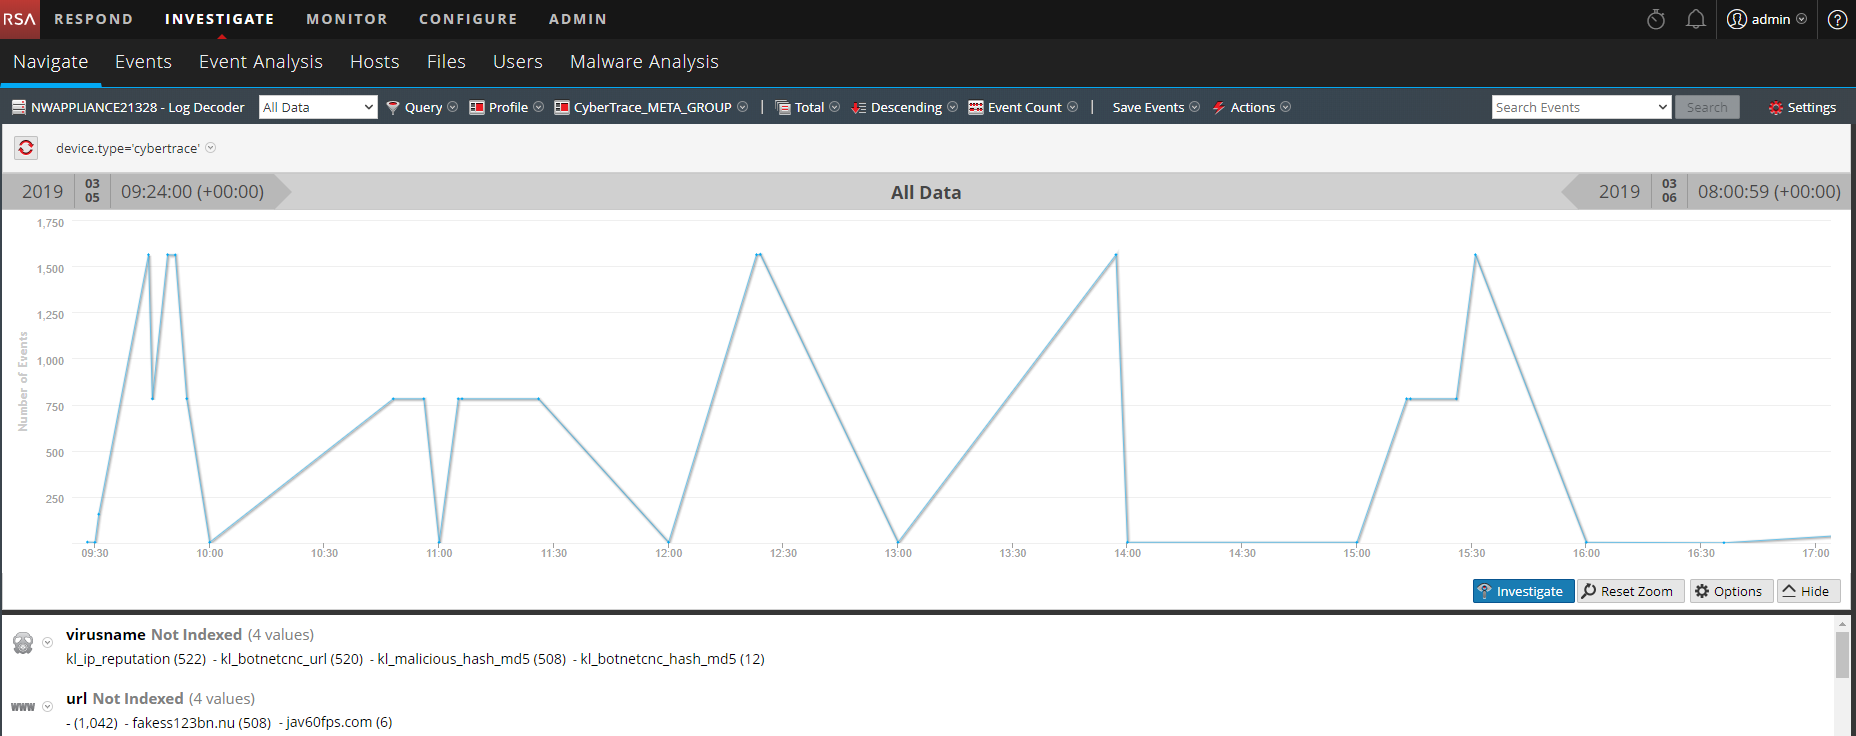
Displaying events from Feed Service
Page topCreating and viewing reports
This section explains how to create and view reports in RSA NetWitness. To learn how to import an existing report to RSA NetWitness, see the section about importing a preconfigured report to RSA NetWitness.
To create a new report in RSA NetWitness:
- On the RSA NetWitness menu, select Dashboard > Reports. (In RSA NetWitness 11, you select Monitor > Reports.)
The Manage tab is displayed.
- Select a rule on the basis of which you will create a report (for example,
CyberTrace Detect Botnet). - For the selected rule, click the Settings split button () and then select Create Report.
- In the Use Rule window, select the New Report option and then click the Select button.
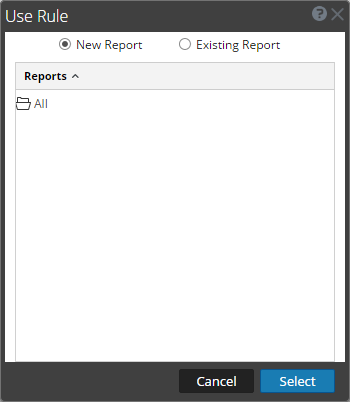
Use Rule window
- On the New Report tab, select the way that you want the data to be displayed.
For the
CyberTrace Detect Botnetrule, you can display data in tabular form only. - Click the Schedule button.
The Schedule Report form appears.
- In the Schedule Report form, specify the following data:
- Schedule name
- Data source (database from the NetWitness DB drop-down list)
- Time when the report must be generated
- Period during which the data to be displayed is collected
- Actions to be performed with the report (for example, to send it by email).
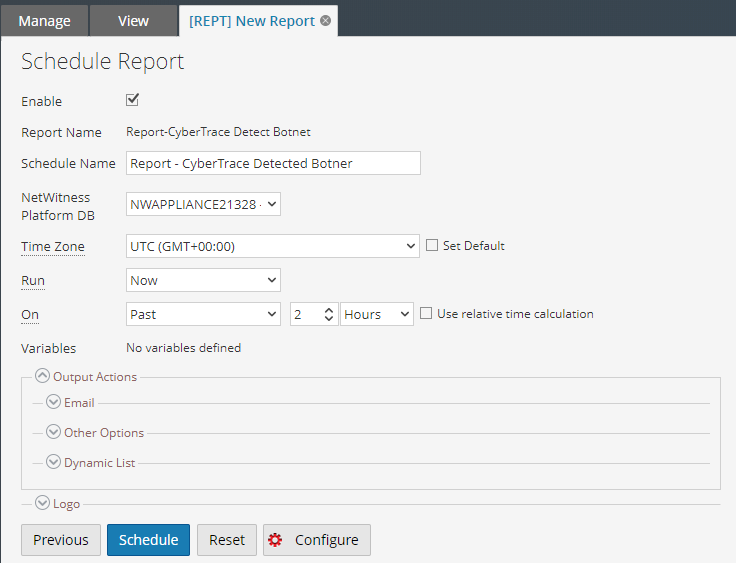
Schedule Report form
- Click Schedule.
Viewing a report
To view a created report:
- On the RSA NetWitness menu, select Dashboard > Reports. (In RSA NetWitness 11, you select Monitor > Reports.)
The Manage tab is displayed.
The Manage tab
- Click Reports.
The Reports view is displayed.
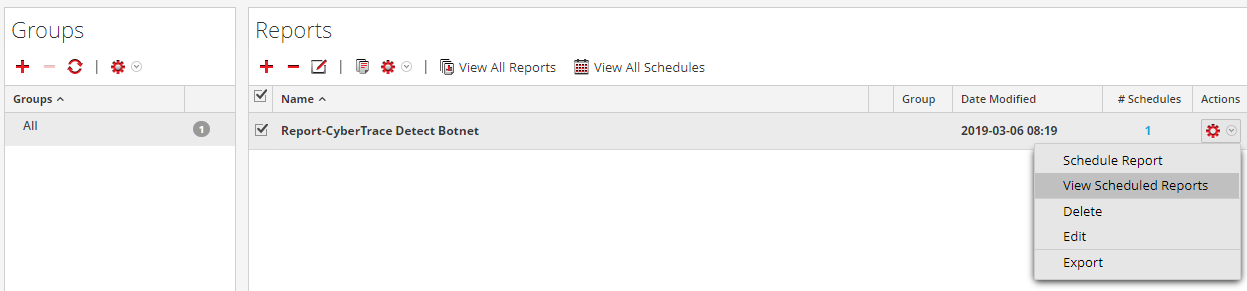
Reports view
- In the Reports pane, pause the mouse over a report, click the Settings split button (), and select View Scheduled Reports.
- Select your schedule report and click View.
Creating and viewing alerts
This section describes how you can create alerts in RSA NetWitness.
To create a new alert in RSA NetWitness:
- On the RSA NetWitness menu, select Dashboard > Reports. (In RSA NetWitness 11, you select Monitor > Reports.)
The Manage tab is displayed.
- Select the rule on the basis of which you will create a report (for example,
CyberTrace Detect Botnet). - For the selected rule, click the Settings split button () and then select Create Alert.
- In the Create/Modify Alert form, specify the following data:
- Data source
- Description of the alert
- Severity of the alert
- Notification type (for example, you can send notifications by email)
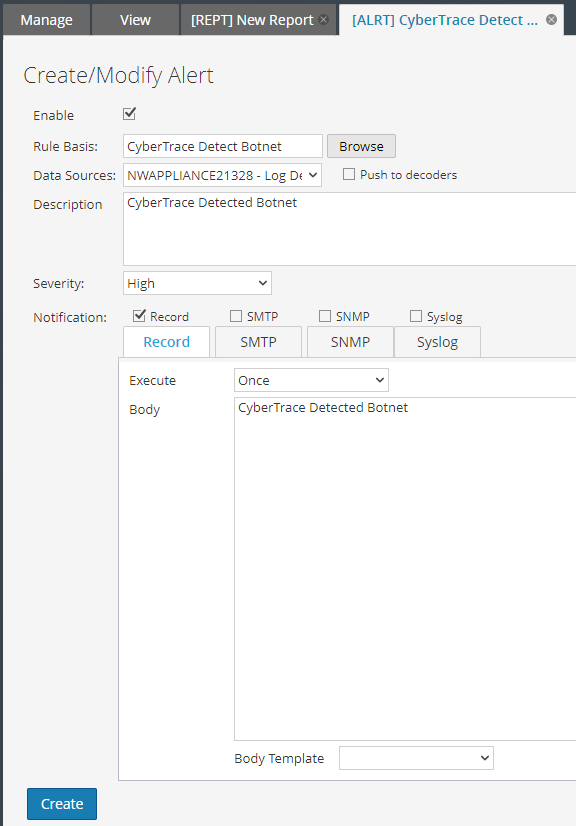
Create/Modify Alert form
- Click the Create button.
Viewing alerts
To view an alert:
- On the RSA NetWitness menu, select Dashboard > Reports. (In RSA NetWitness 11, you select Monitor > Reports.)
The Manage tab is displayed.
- Click Alerts.
The Alert view is displayed.
- On the Alert toolbar, click View Alerts.
The View Alerts view tab is displayed.
Creating a dashboard
This section describes how you can create a dashboard in RSA NetWitness by using the Feed Service rules.
To create a dashboard in RSA NetWitness:
- On the RSA NetWitness menu, select Dashboard > Reports. (In RSA NetWitness 11, select Monitor > Reports.)
- Select the rule that you will use to create a report (for example, the
CyberTrace Top 10 URLsreport). - For the selected rule, click the Settings split button (), and then select the Create Chart action.
The Build Chart window opens.
- Specify the following data:
- Chart name
- Data source
Specify the data source that issues Feed Service events.
- Update period
- Data limit
For example, for charts containing TOP 10 objects, specify
10.
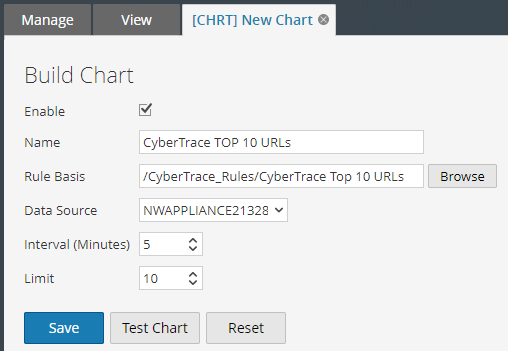
Build Chart window
- Click Save.
- Activate the Dashboard form. (In RSA NetWitness 11, select Monitor > Overview instead.)
- The action performed in this step depends on the RSA NetWitness version.
- In RSA NetWitness 10, click the New split button (
 ), and then select Add Dashlet.
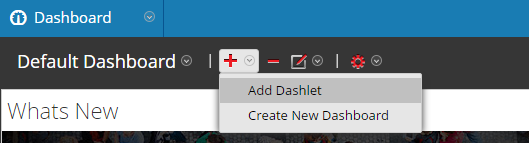
Adding a dashlet window
- In RSA NetWitness 11, do the following:
- Click the Add Row split button, and then select the type of new row that you want.
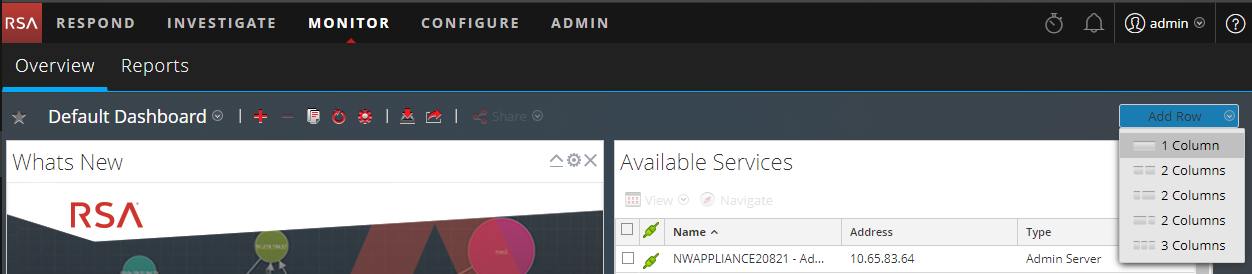
Adding a row
- In the cell that appears, click the Add Dashlet button (
 ).
).In the figure below, the cell is shown enclosed in a dotted line.
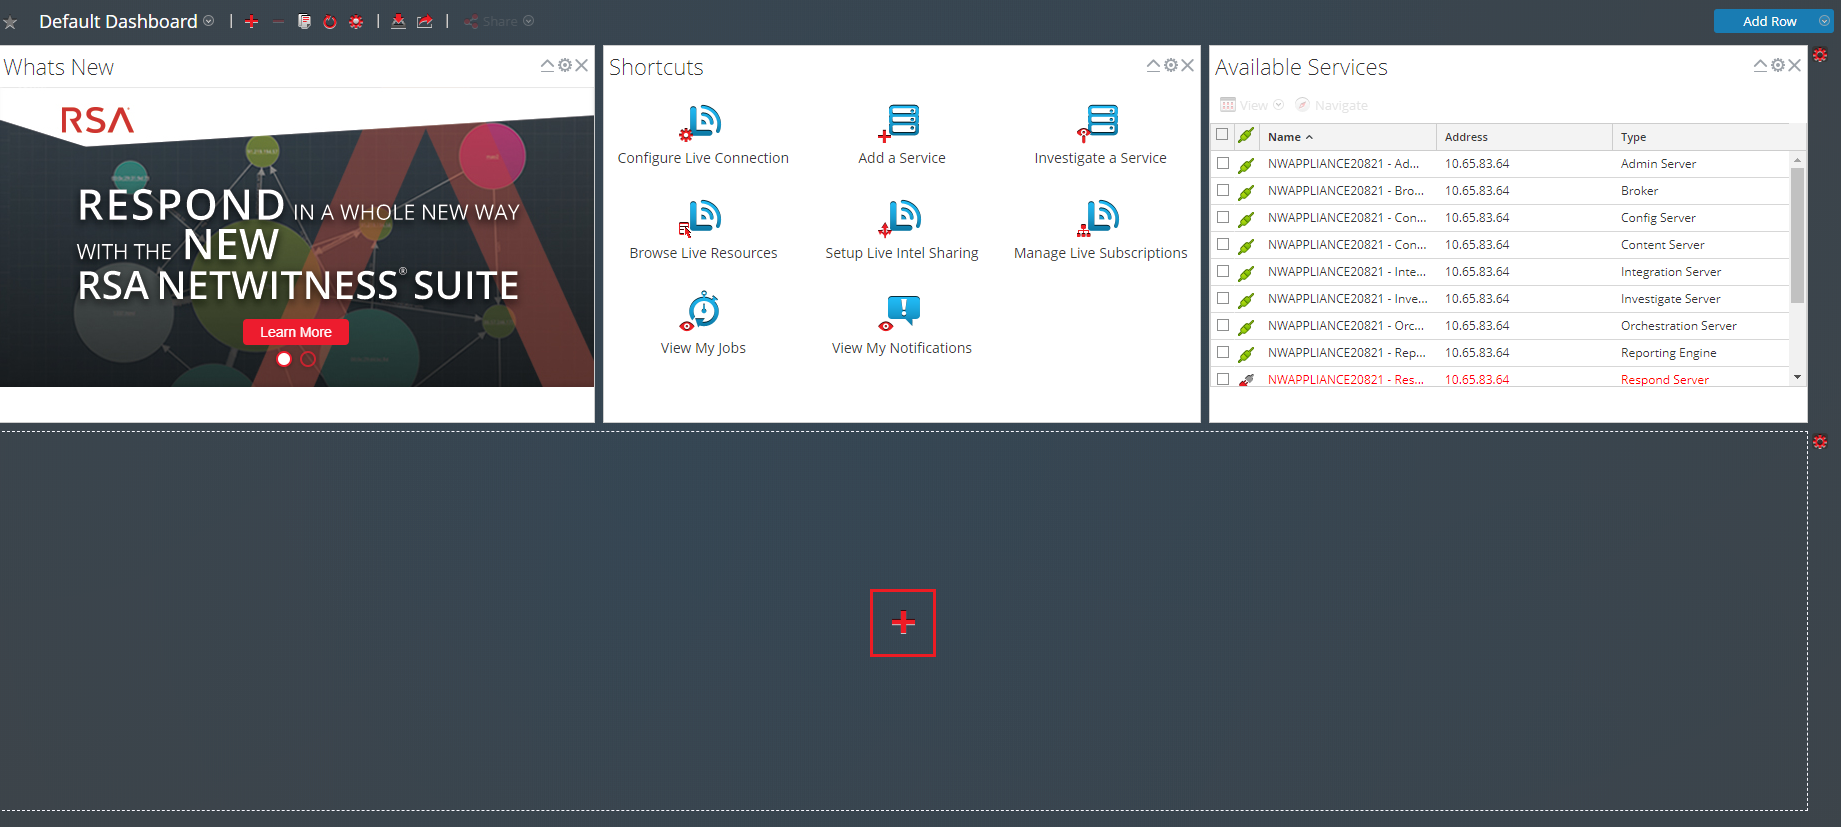
Adding a dashlet
The Add a Dashlet window opens.
- In RSA NetWitness 10, click the New split button (
- Specify the following information:
- The
Reports Realtime Chartas the dashlet type - The chart to display (in this case, it is
CyberTrace Top 10 URLs) - Dashlet name
- Chart type (in this case, it is a column)
- Period up to the present during which the data to be displayed is prepared
- Dashlet update period
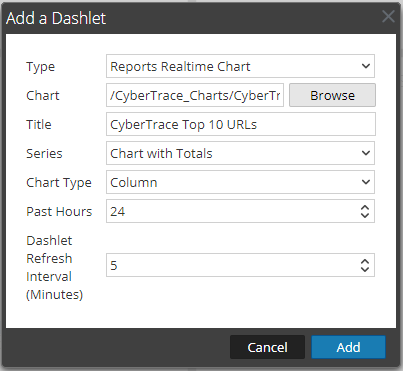
Add a Dashlet window
- The
- Click the Add button.
Creating notifications about incoming service events
You can create notifications about incoming Kaspersky CyberTrace service events by configuring alert rules.
To create notifications about service events from Kaspersky CyberTrace in RSA NetWitness:
- On the RSA NetWitness menu, select the Monitor > Reports and then select Manage > Rules.
Manage > Rules form
- In the Groups section, select CyberTrace_Rules.
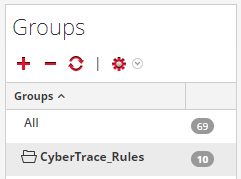
CyberTrace rules
- In the Rules section, click the Add split button (
 ). In the drop-down list, select NetWitness Platform DB.
The Build Rule window opens.
- In the Build Rule window, specify the following settings:
- In the Name field, specify the name of the rule.
You can specify any name.
- In the Summarize field, specify the value different from
None, if you want to agregate events. - In the Select field, specify the fields that contain values are used in notifications.
In service events, Kaspersky CyberTrace uses the msg and action fields.
- In the Where field, specify the notification conditions. For example:
device.type='cybertrace' && action contains 'KL_ALERT'This condition contains all Kaspersky CyberTrace service events.
- If necessary, fill in the rest fields as you choose.
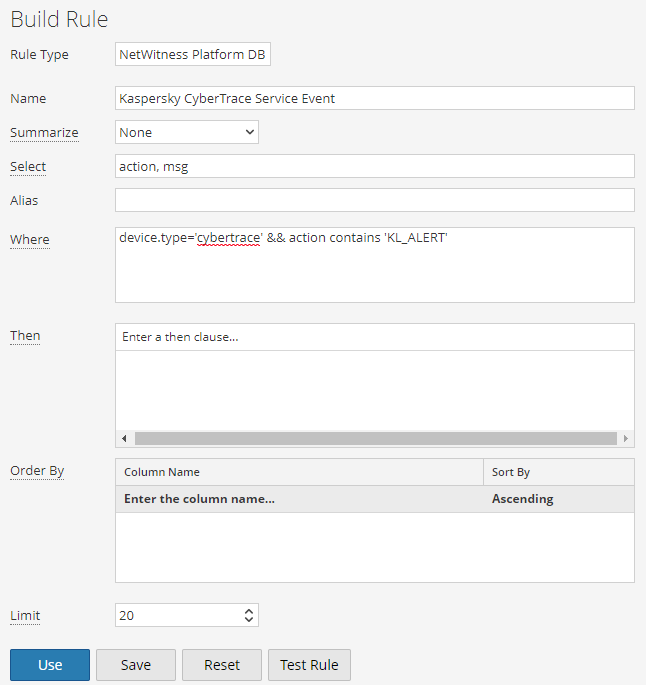
The Build Rule window
- In the Name field, specify the name of the rule.
- Click the Test Rule button to make sure that checking the specified rules is performed correctly.
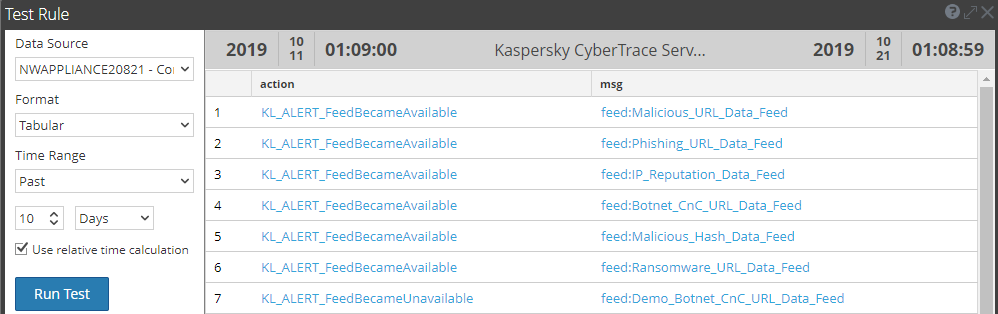
The Test Rule window
- Click Save to save the rule.
- Click Use, and in the window that opens select Alert and then Select.
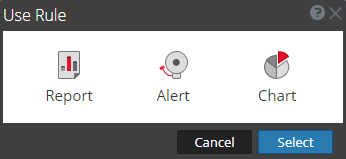
The Use Rule window
The Create/Modify Alert window opens.
- In the Create/Modify Alert window, specify the following settings:
- In the Data Source field, select an event source with Kaspersky CyberTrace events.
- In the Description field, specify the alert description.
You can specify any description.
- In the Severity field, specify the severity of the alert.
- In the Notification field, specify the following settings:
- The way that RSA NetWitness will send notify you about alerts.
- The body of the alert.
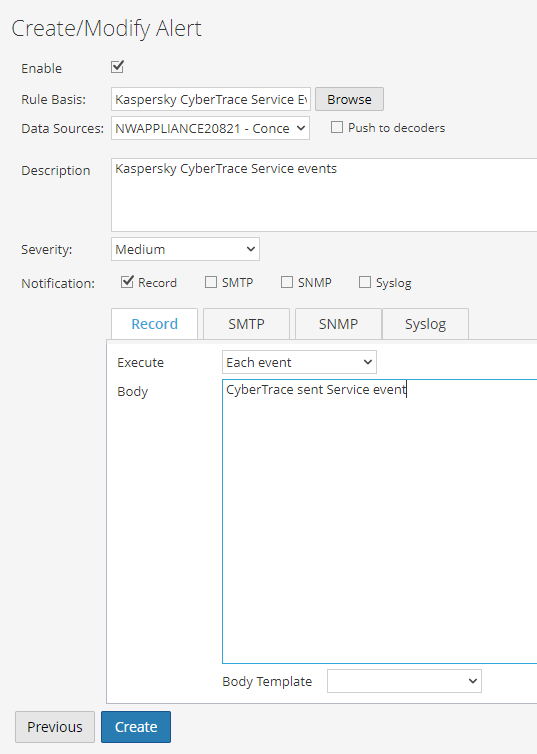
The Create/Modify Alert window
- Click Create to save the rule.
The rule will now be added to the Alert list of the Manage > Alerts tab.
- To browse all alerts that comply with the created rule, click the View Alerts button (
 ).
).
About the Kaspersky CyberTrace dashboard
This section describes the Kaspersky CyberTrace dashboard. This dashboard appears in RSA NetWitness after the Kaspersky+CyberTrace.cfg file is imported.
The Kaspersky CyberTrace dashboard contains the following dashlets:
- Dashlet with detection statistics for the previous 24 hours
- Top 10 URLs, Top 10 IP addresses, and Top 10 Hashes dashlets during the last 24 hours
- Dashlet with service events from Feed Service during the last 24 hours
Specify the data source for this dashlet by clicking the Settings split button (
), and then selecting Service. - The IP addresses of the devices that issued the events that Feed Service transformed into detection events during the last 24 hours
Specify the data source for this dashlet by clicking the Settings split button (), and then selecting Service.
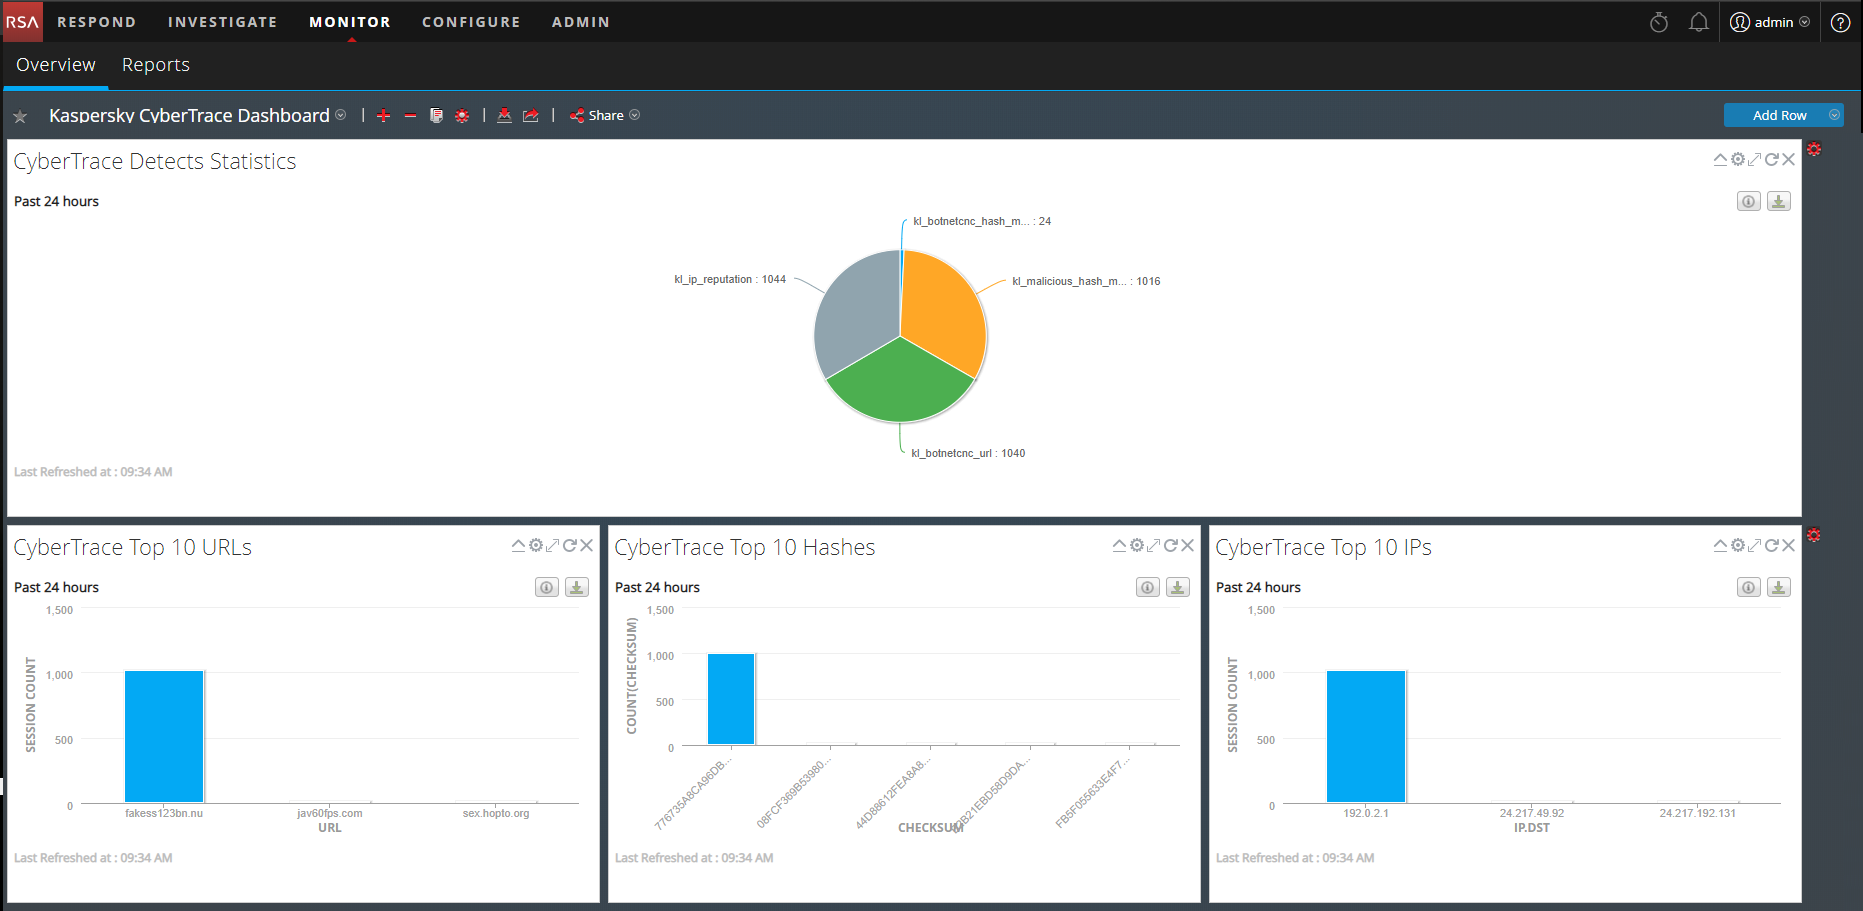
Kaspersky CyberTrace dashboard
Page topLog Scanner Guide
The Log Scanner utility is a command-line application that allows you to send data to Feed Service for checking against feeds. You can check hashes, IP addresses, or URLs one by one or in batch mode, that is, by sending Feed Service files that contain data to check.
This chapter explains how to use the Log Scanner utility.
Command-line options
In Linux, the Log Scanner utility is launched from the command line as follows:
./log_scanner [-h|--help] [-r|--report] [-c|--config] [[-p|--path]|[-s|--hash]|[-u|--url]|[-i|--ip]] [value]
In Windows, the Log Scanner utility is launched from the command line as follows:
log_scanner.exe [-h|--help] [-r|--report] [-c|--config] [[-p|--path]|[-s|--hash]|[-u|--url]|[-i|--ip]] [value]
The following table explains the command-line options.
Command-line options of Log Scanner
Option |
Description |
|
Prints the usage message to the screen. If this option is specified, all other options are ignored. |
|
If this option is specified, Feed Service will return the response to Log Scanner in the same socket in which the request was sent, and Log Scanner will save the result in a text file. The output file is named If a URL, IP address, or hash is found in Kaspersky Threat Data Feeds, its category and context information is written to the output. After the entire input is processed, the following information is written to the output:
If this option is specified, make sure that the value of the |
|
Path to the configuration file. It can be either an absolute or a relative path. A relative path is calculated relative to the directory from which you run Log Scanner. By default, Log Scanner uses the log_scanner.conf configuration file that is placed in the directory from which you run Log Scanner. |
|
Path to a directory or text file that contains URLs, IP addresses, and hashes to check against Kaspersky Threat Data Feeds. It can be an absolute or a relative path. A relative path is calculated relative to the directory that contains the Log Scanner binary file. If the path to a directory is specified, all files contained in it and all its all-level subdirectories are processed. Each line of each processed file is sent to Feed Service as the data to be checked. No further formatting is applied. Feed Service will parse the lines by using the regular expressions set in its configuration file. You can specify several paths; in this case, use the
|
|
Hashes to be checked against Kaspersky Threat Data Feeds. They can be MD5 hashes, SHA1 hashes, or SHA256 hashes; Log Scanner determines the type of a hash on the basis of its length. If several hashes are specified, they must be separated by space symbols. For example:
|
|
IP addresses to be checked against Kaspersky Threat Data Feeds. If several IP addresses are specified, they must be separated by space symbols. For example:
|
|
URLs to be checked against Kaspersky Threat Data Feeds. If several URLs are specified, they must be separated by space symbols. For example:
Do not use the |
If you specify none of the -p, -s, -u, or -i options, and specify only the value to check, this value will be treated as the path to the file or directory to be scanned.
The Log Scanner utility uses the current locale of the operating system.
Page topExamples of usage scenarios
This section contains examples of using Log Scanner in some situations.
Checking several log files
All log files that you pass for scanning must be in UTF-8 encoding. If your log files have a different encoding, make sure to convert them to UTF-8.
If you have feeds that are not compiled and a directory containing log files, you can check the log files by performing the following procedure.
To check several log files:
- In the Feed Service configuration file kl_feed_service.conf specify the feeds to be used, normalizing rules to process events in the log files, and regular expressions to parse events.
- Start Feed Service:
systemctl start cybertrace.service(in LInux)%service_dir%\bin\kl_control.bat start(in Windows) - Run the Log Scanner utility and specify the directory that contains log files. For example:
./log_scanner -r –p ../logs(in Linux)log_scanner.exe -r –p ..\logs(in Windows) - Stop Feed Service by running the following command:
systemctl stop cybertrace.service%service_dir%\bin\kl_control.bat stop(in Windows)
After Log Scanner finishes its work, the directory specified by the OutputDir element of the log_scanner.conf configuration file will contain a report about the URLs and hashes detected by Feed Service.
Checking several URLs and hashes
If you have to check several URLs and hashes, perform the following procedure.
To check several URLs and hashes:
- Start Feed Service by running the following command:
systemctl start cybertrace.service(in LInux)%service_dir%\bin\kl_control.bat start(in Windows) - Run Log Scanner and specify the hashes to be checked. For example:
./log_scanner -r -s A72C5B99F2706B00718279C9533A3648 -s 6AA0321FA9D82D652AB53882D7CF9E592B4439B8(in LInux)log_scanner.exe -r -s A72C5B99F2706B00718279C9533A3648 -s 6AA0321FA9D82D652AB53882D7CF9E592B4439B8(in Windows) - Run Log Scanner and specify the URLs to be checked. For example:
./log_scanner -r –u test.mav.example.com?bad_url=1 -u test.phishing.example.com/psh/test?p=1&p=2(in LInux)log_scanner.exe -r –u test.mav.example.com?bad_url=1 -u test.phishing.example.com/psh/test?p=1&p=2(in Windows) - Stop Feed Service by running the following command:
systemctl stop cybertrace.service(in LInux)%service_dir%\bin\kl_control.bat stop(in Windows)
After Log Scanner finishes its work, the directory specified by the OutputDir element of the log_scanner.conf configuration file will contain a report about the URLs detected by Feed Service and a report about the detected hashes.
Configuration file (Log Scanner)
The Log Scanner configuration file is an XML file that contains parameters described in the table below. If this file is not present in the directory or some parameters are not present in the file, the default values are used for the missing parameters.
Configuration file parameters
Parameter |
Description |
|
Affects the Log Scanner output to the console. If the value contained in the |
|
Maximum number of threads that Log Scanner can use when processing input data. By default, up to 8 threads are used. |
|
Directory that will contain the output file. It can be either an absolute or a relative path. A relative path is calculated relative to the directory that contains the Log Scanner binary file. If the |
|
The utility sends requests to Feed Service in the format specified in the
|
|
Specifies the IP address and port (or the Windows-named pipe, or UNIX socket) to which Log Scanner will send the received data.
|
|
Number of seconds that Log Scanner waits for the socket or pipe specified in the If the value of this parameter is The maximum value of this parameter that you can set is By default, the timeout is 15 seconds. |
Configuration file example
<Settings> <Verbose>0</Verbose> <ThreadsCount>8</ThreadsCount> <OutputDir>../log_scanner_reports</OutputDir> <Pattern>ip=%IP% md5=%MD5% sha1=%SHA1% sha256=%SHA256% url=%URL%</Pattern> <Connection>127.0.0.1:9999</Connection> <SocketTimeout>15</SocketTimeout> </Settings> |
Recommendations on using Log Scanner
We recommend that you use Feed Service together with Log Scanner in the following cases:
- You have to check some log files and save the check result to a file.
It can be useful while investigating information security incidents, when the SIEM solution you use is unavailable, or if you do not use any SIEM solution.
- You have to check some log files and send the check results to the SIEM solution used.
Configuring Feed Service and Log Scanner
Feed Service and Log Scanner must interact correctly, so their corresponding parameters must be set according to each other as follows:
- The port set in the
Settings > Connectionelement of the Log Scanner configuration file must accord with the port specified in theInputSettings > ConnectionStringelement of the Feed Service configuration file. - The number of threads specified in the
Settings > ThreadsCountelement of the Log Scanner configuration file must not be greater than that specified in theServiceSettings > ScannersCountelement of the Feed Service configuration file. If Feed Service runs in watchdog mode, the number of threads specified in theSettings > ThreadsCountelement of the Log Scanner configuration file must be less than that specified in theServiceSettings > ScannersCountelement of the Feed Service configuration file. - The data sent by Log Scanner to Feed Service—either lines of log files or strings created on the basis of the
Settings > Patternelement of the Log Scanner configuration file—must be parseable by regular expressions specified in theConfiguration > InputSettings > RegExpselement of the Feed Service configuration file.
Configuration files examples
The following is an excerpt from a sample Feed Service configuration file.
<Configuration> <InputSettings> <RegExps> <Source id="default"> <!--You can use them in the OutputSettings->EventFormat string with the pattern %REGEXPNAME%--> ... <RE_MD5>md5=(.*?)(?:$|\s)</RE_MD5> <RE_SHA1>sha1=(.*?)(?:$|\s)</RE_SHA1> <RE_SHA256>sha256=(.*?)(?:$|\s)</RE_SHA256> <RE_URL>url=(.*?)(?:$|\s)</RE_URL> <RE_IP>ip=(.*?)(?:$|\s)</RE_IP> </Source> </RegExps> <ConnectionString>127.0.0.1:9999</ConnectionString> <!-- <ip>:<port>. Threat Feed Service listens for <ip>:<port>. <port> must be available --> </InputSettings>
<Feeds per_scan_detect_limit="10000">...</Feeds>
<OutputSettings> ... <FinishedEventFormat>LookupFinished</FinishedEventFormat> </OutputSettings>
<ServiceSettings> ... <ScannersCount>9</ScannersCount> <!-- 1 tcp connection = 1 scanner --> </ServiceSettings> </Configuration> |
The following is an excerpt from a Log Scanner configuration file that corresponds to the Feed Service configuration file provided above.
<Settings> ... <ThreadsCount>8</ThreadsCount> <Pattern>ip=%IP% md5=%MD5% sha1=%SHA1% sha256=%SHA256% url=%URL%</Pattern> <Connection>127.0.0.1:9999</Connection> </Settings> |
When using these configuration files, Log Scanner sends the requests to the IP address 127.0.0.1 and port 9999, and Feed Service listens on port 9999 for data to check. Both Log Scanner and Feed Service use up to 8 threads for transferring and processing data, and one thread is used by the watchdog module (in LInux) or watchdog service (in Windows). If correct URLs, IP addresses, and hashes are sent to Feed Service for checking, they will be successfully parsed by using the regular expressions specified in the Feed Service configuration file.
Managing check results
After data is checked by Feed Service, you can either send the check results to event target software or save them to a file:
- For sending check results to event target software, set the correct value of the
"OutputSettings>ConnectionString"element of the Feed Service configuration file. - For saving check results to a file, pass the
-roption when running Log Scanner from the command line as follows:./log_scanner -r -p file_to_check(in Linux)log_scanner.exe -r -p file_to_check(in Windows)The value of the
enableattribute of theOutputSettings > FinishedEventFormatelement in the Feed Service configuration file must not befalse.
Report example
The report content depends on the value of the OutputSettings > EventFormat element of the Feed Service configuration file.
The following is an example of a report sent by Feed Service to Log Scanner.
- KL_Data_Feed_Service_v1 LEEF:1.0|Kaspersky Lab|SIEM Service|1.0|KL_Malicious_URL|url=malicious_domain_21.com/folder/load.php?| IP=91.202.63.117, 196.254.10.200, 194.190.253.19, 185.56.137.11, 178.62.5.157, 173.194.222.211, 159.253.145.183, 87.250.250.135, 82.145.209.252, 74.125.205.211 first_seen=11.01.2016 07:17 geo=ru, ua, kz, by, de, ro, az, cz, uz, md id=9491494 last_seen=14.01.2016 13:36 mask=malicious_domain_21.com/folder/load.php?* popularity=5 type=21 Total number of objects sent to KTFS: 1 Total number of detects received from KTFS: 1 Total scan time: 00:00:01.032 |
Administrator guides
This chapter provides information about using the Kaspersky CyberTrace web interface, command-line tools, and applications for SIEM solutions.
Managing Kaspersky CyberTrace Web
This section describes how Administrator users can manage Kaspersky CyberTrace from the web user interface (web interface).
All web interface pages described in this section are available only for user accounts that have the Administrator role. Users with Analyst role cannot access these pages.
Working with default credentials
This section explains how to work with default credentials and passwords for other users.
Default credentials
After Kaspersky CyberTrace is installed, the following default credentials are set for Kaspersky CyberTrace Web:
- User name:
admin - Password:
CyberTrace!1
To avoid possible security risks, change this password as soon as possible. For more information, see Logging in to Kaspersky CyberTrace Web.
Resetting the password for the default user
Use the kl_access_util utility to reset the credentials for the default user (admin).
Changing passwords for other users
To create user accounts and change passwords for other users, use the User Settings page.
Page topService settings
This section explains how to manage different service settings that are available when you select the General tenant or a particular settings tenant in the drop-down list with all available tenants in the upper-left area of the window.
Service settings (General tenant)
You can manage the general service settings in the CyberTrace web user interface by selecting the Settings tab, and then the Service tab. Make sure that the General item is selected from the drop-down list that has all available tenants, in the upper-left area of the window.
The Service tab allows you to edit settings stored in the kl_feed_util.conf and kl_feed_service_log.conf configuration files. You can perform the following actions by clicking the following links below the tab:
- Restart Feed Service
- Export the configuration file
You can export the kl_feed_service.conf and kl_feed_util.conf configuration files to a directory that you choose.
- Run self-test
Verifies that the Kaspersky Threat Data Feeds that you use work correctly.
Please make sure you run the self-test before editing any filtering rules on the Settings > Feeds tab, in the Filtering rules for feeds section.
If the verification test (self-test) yields incorrect results (that is, if a feed that is expected to produce detections produces none), see possible solutions for this problem in the general troubleshooting section. If the problem persists, contact your technical account manager (TAM).
- Reset statistics
Clears the Dashboard of all the detection statistics. When you select the General tenant, Kaspersky CyberTrace clears the detection statistics for all tenants.
It is recommended to perform this operation after successfully integrating CyberTrace with a SIEM solution: this way, the dashboard will not display any detection events generated during the verification test and will only contain real detection events, if there are any.
The Settings tab displays the Feed Service status, which can be one of the following:
- Feed Service is running
- Feed Service is starting
- Feed Service has stopped
- Feed Service is updating feeds
This status specifies that indicators are loading into the database and indexing. Until all indicators processed, the Indicators tab may contain partially outdated information, and a search for data that is being updated may not be performed correctly. However, the process of matching incoming events is performed based on the actual data and the Kaspersky CyberTrace Web page with detailed information about indicators displays up-to-date data.
Connection settings
In the Connection settings section of the Service tab, you can specify the following settings:
- IP address and port (on Linux, it can be also a UNIX socket) that Feed Service listens on for incoming events
These settings are stored in the
InputSettings > ConnectionStringelement of the kl_feed_service.conf file. - IP address and port (on Linux, it can also be a UNIX socket) to which Feed Service sends detection events and alert events
These settings are stored in the
OutputSettings > ConnectionStringelement of the kl_feed_service.conf file. - IP address or hostname, and port (on Linux, it can also be a UNIX socket) to which Feed Service sends alert events that inform the event target software of the state of the service
These settings are stored in the
OutputSettings > AlertConnectionStringelement of the kl_feed_service.conf file.You can enable or disable this setting by using Kaspersky CyberTrace Web. When this setting is enabled, Kaspersky CyberTrace does not send alert events to the IP address and port that are stored in the
OutputSettings > ConnectionStringelement of the kl_feed_service.conf file. - IP address or hostname of the proxy server for updating feeds
This setting is stored in the
Hostelement of the kl_feed_util.conf file. - Port of the proxy server for updating feeds
This setting is stored in the
Portelement of the kl_feed_util.conf file.The preset value is
0. If you do not want to use a proxy server, leave this value unchanged. - Proxy user name
This setting is stored encrypted in the
Userelement of the kl_feed_util.conf file. - Proxy password
This setting is stored encrypted in the
Passwordelement of the kl_feed_util.conf file.
External address of the web interface
In the Web interface section of the Service tab, you can specify the IP address or hostname to be used in Kaspersky CyberTrace events.
This setting is stored in the ResourcesIP element of the kl_feed_service.conf file.
The preset value is 127.0.0.1.
Using a proxy server
To configure CyberTrace to use a proxy server:
Specify proxy settings in the IP address or hostname, Port, User name, and Password fields.
To configure CyberTrace not to use a proxy server:
- Enter
0in the Port text field. - Clear the IP address or hostname, User name, and Password text fields.
About the disk space notification
When Kaspersky CyberTrace updates feeds, it checks the amount of remaining disk space. If the remaining disk space is low, Kaspersky CyberTrace displays a notification. The notification states how many MB of disk space is still available for the indicator database.
In addition, Kaspersky CyberTrace sends a KL_ALERT_FreeSpaceEnds event.
Page topService settings (custom tenant)
You can manage the service settings for a particular settings tenant in the CyberTrace web user interface by selecting the Settings tab, and then the Service tab. Make sure that a tenant for which you want to display service settings is selected from the drop-down list that has all available tenants, in the upper-left area of the window.
The Service tab allows you to do the following:
- Edit settings stored in the kl_feed_util.conf and kl_feed_service_log.conf configuration files.
- Reset statistics by clicking the Reset statistics link below the tab.
This action clears the Dashboard of all the detection statistics related to this tenant.
We recommend performing this operation after successfully integrating CyberTrace with a SIEM solution. This means the dashboard will not display any detection events generated during the verification test and will only contain real detection events, if there are any.
Connection settings
In the Connection settings section of the Service tab, you can specify the following settings:
- IP address and port (on Linux, it can be also a UNIX socket) that Feed Service listens on for incoming events
These settings are stored in the
InputSettings > ConnectionStringelement of the kl_feed_service.conf file. - IP address and port (on Linux, it can also be a UNIX socket) to which Feed Service sends detection events and alert events
These settings are stored in the
OutputSettings > ConnectionStringelement of the kl_feed_service.conf file.
Feeds settings
You can manage the settings of feeds in the Kaspersky CyberTrace web user interface by selecting the Settings tab, and then the Feeds tab. When you change the settings, you will be asked whether to update the feeds. Depending on the item selected in the drop-down list with all available tenants in the upper-left area of the window, the changes will affect either the general feeds settings (if General is selected) or the feeds settings for a specific tenant (if a specific tenant is selected).
For all tenants, Kaspersky CyberTrace displays only the feeds that are enabled in the General tenant.
For the General tenant, the form allows you to:
- Import a certificate for Kaspersky Threat Data Feeds
- Specify the feeds update period
- Enable and disable feeds
- Select available fields for a feed
- Add actionable fields to a feed
- Specify filtering rules for a feed
- Truncate a feed
- Launch a feeds update manually
- Add custom or third-party feeds
- Configure a custom or third-party feed
- Manage false positives
For a specific tenant, the form allows you to:
Feed tabs
Feeds are listed on the following tabs:
- Kaspersky
This tab contains Kaspersky Threat Data Feeds.
- <Vendor name>
Custom and third-party threat data feeds are grouped into tabs by vendor.
If no vendor name is provided for a feed, it is listed on the Custom feeds tab.
If there are no custom and third-party feeds, these tabs are not displayed.
- OSINT
This tab contains OSINT feeds.
- Internal TI
This tab contains the Internal TI supplier, with indicators added to the database by users.
About the feed update notifications
If any feeds have become available or unavailable with your certificate during an update, a window opens and lists all newly available and unavailable feeds.
In each list of feeds:
- If a currently used feed becomes unavailable, the toggle button remains On but a warning appears next to the feed. The warning states that this feed is no longer supported by your certificate and will not be updated anymore. You can either continue using the last available copy of the unsupported feed, or set the toggle button to Off and stop using the feed.
- For all feeds that become available, the toggle button becomes enabled.
By default, the toggle button next to all newly available feeds is set to Off. You have to manually set it to On for the feeds that you want to start using.
Importing a certificate for Kaspersky Threat Data Feeds
This section explains how to import a certificate for Kaspersky Threat Data Feeds. Make sure that the General tenant is selected from the drop-down list that has all available tenants, in the upper-left area of the window.
About the feeds certificate
Kaspersky CyberTrace downloads and updates Kaspersky Threat Data Feeds if they are available with the current certificate.
Importing a feeds certificate for Kaspersky Threat Data Feeds
To import a new feeds certificate for Kaspersky Threat Data Feeds:
- Navigate to the Settings page.
- Open the Feeds tab.
- In the Feeds update period section, select the Import certificate link.
The Import certificate window opens.
- In the Import certificate window, select the Browse link.
- In the opened browser window, select the certificate file in the .pem format and open it.
- In the Import certificate window, click the Save button.
After you import a new certificate, Feed Service checks for and displays all the feeds that are available with it.
Page topSpecifying the feeds update period
This section explains what is feeds update period and how to change it. Make sure that the General tenant is selected from the drop-down list that has all available tenants, in the upper-left area of the window.
About the feeds update period
The feeds update period specifies how often Kaspersky CyberTrace updates all enabled feeds. The default update frequency is 30 minutes. The date and time of the last feeds update is displayed.
Feeds can be rolled back after an update if Kaspersky CyberTrace fails to upload new indicators into the Matching engine (for more information, see the description of the FeedsRollbackEnabled parameter in ServiceSettings).
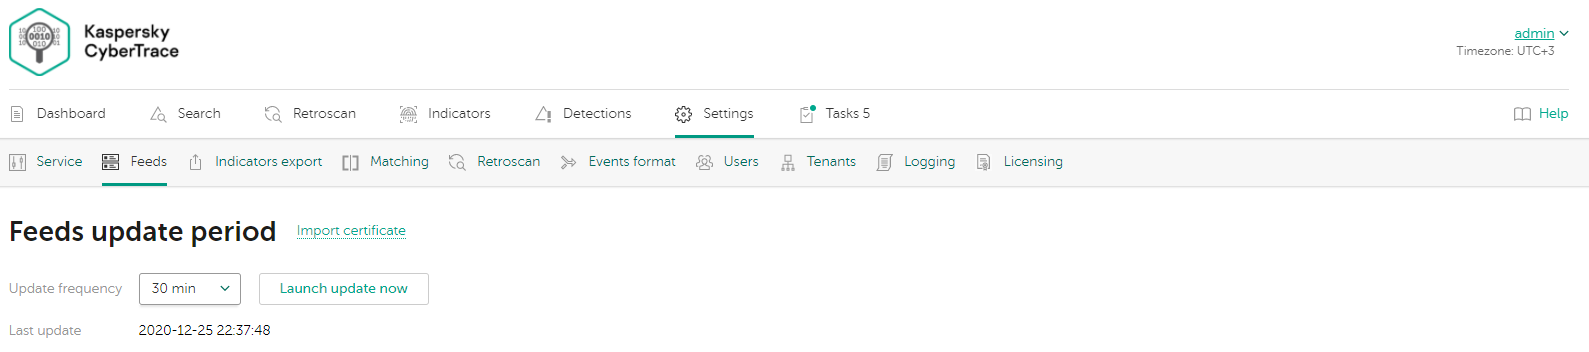
Feeds update period section
Specifying the feeds update period
To specify the feeds update period:
- Navigate to the Settings page.
- Open the Feeds tab.
- In the Feeds update period section, select a value in the Update frequency drop-down list.
- Scroll to the bottom of the Feeds tab and click the Save button.
Enabling and disabling feeds
This section describes how to enable and disable feeds.
When you enable a feed, it is automatically added and enabled in all tenants. When you disable a feed, it is automatically removed from all tenants.
Enabling and disabling feeds
You can enable or disable feeds, except for the InternalTI supplier on the Internal TI tab, by using the Feed is off or Feed is on toggle button. For the InternalTI supplier on the Internal TI tab, you can only specify actionable fileds.
If you disable a feed, its indicators will not be removed from the indicator database. These indicators will not be displayed on the Indicators tab, but will be taken into consideration regarding the limit on the number of indicators. To avoid that, you must remove the indicators manually before disabling the feed.
When only demo feeds are used, there is a notification at the top of the Feeds tab. Use the Request access to all feeds link in that notification to send your request by email. Alternatively, you can use the Request Kaspersky Threat Intelligence form to subscribe to Kaspersky Threat Intelligence Portal and get commercial feeds, which have a higher level of protection.
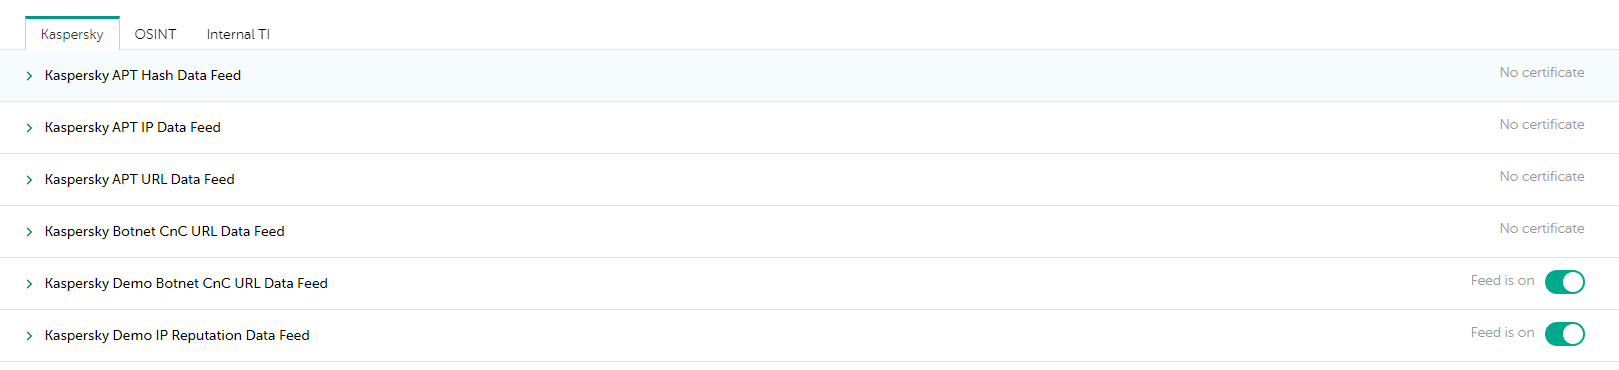
Enabling or disabling a feed
Page topSelecting available fields for a feed
This section explains how to specify which fields must be included in a feed. Make sure that the General tenant is selected from the drop-down list that has all available tenants, in the upper-left area of the window.
About the available fields
Available fields for a feed define which fields from an original feed Kaspersky CyberTrace must include in the resulting feed. For example, if you specify that all but one of the fields in a feed must be ignored, the resulting feed will have only one field for each record.
A feed must have at least one available field that is used for matching. This field must contains IPs, hashes, or URLs.
In the original feed files, some records can have extra fields or can lack some fields; one record can have less or more fields than another record.
If a record has an extra field and this field is selected for a feed, the record will have this field in the resulting feed. If a record has an extra field and this field is not selected for a feed, the record will not have this field in the resulting feed.
If a record lacks a field and this field is selected for a feed, the record will not have this field. If a record lacks a field and this field is not selected for a feed, the record will not have this field.
If you want to exclude records with missing fields from the output, you must create filtering rules for all required fields. You can specify criteria for field values. For more information about filtering rules, see Specifying filtering rules for a feed.
Selecting available fields for a feed
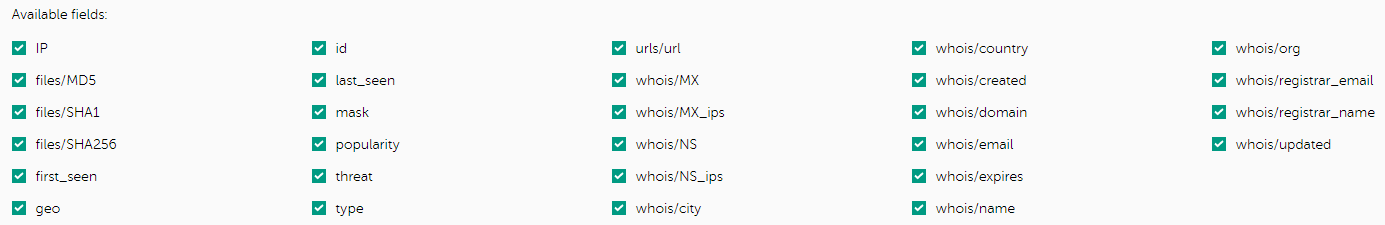
Selecting available feed fields
To select available fields for a feed:
- Navigate to the Settings page.
- Open the Feeds tab.
- In the Filtering rules for feeds section select the tab that contains the feed you need to configure.
You cannot include or exclude available fields for the Internal TI supplier.
- Locate the feed that you want to configure, and then expand its section.
- In the settings section for the individual feed, locate the Available fields section.
- Select the fields that you want to include and remove the selection for fields that you want to exclude.
- Scroll to the bottom of the Feeds tab, and then click the Save button.
Adding actionable fields to a feed
This section explains how to add extra fields to the outgoing events sent by Kaspersky CyberTrace. These settings are applied to the tenant that is selected in the drop-down list with all available tenants, in the upper-left area of the window.
About the actionable fields
Actionable fields are extra fields that you can insert into outgoing events apart from the context of feed records. You can use actionable fields to extract specific information from the context and pass it in separate fields.
Adding actionable fields
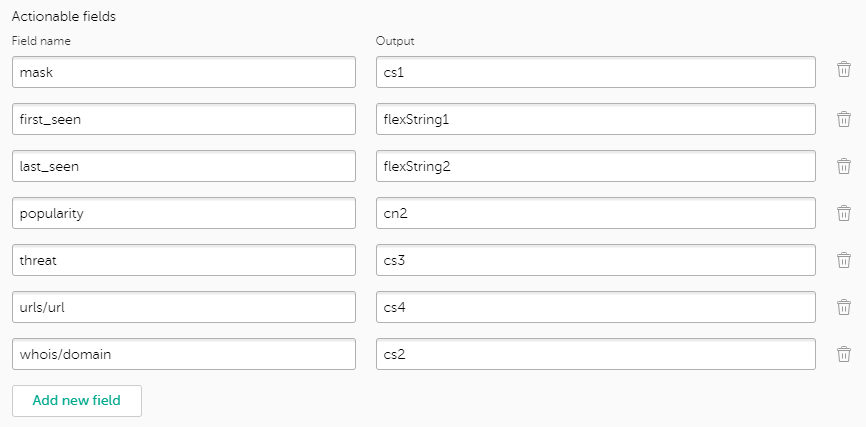
Managing actionable fields
To add actionable fields for a feed:
- Navigate to the Settings page.
- Open the Feeds tab.
- In the Filtering rules for feeds section select the tab that contains the feed you need to configure.
- Locate a feed that you want to configure, and then expand its section.
- In the settings section for the individual feed, locate the Actionable fields section.
- Click the Add new field button to add a new actionable field.
- In the Field name text box, specify the name of a field in the original feed.
If a feed record contains several equally named fields, and their name is mentioned in the actionable fields list, the outgoing event will contain all of the values delimited by a semicolon in one field.
- In the Output text box, specify the name of the field, as it will be inserted into outgoing events.
If the Output text box is empty, the field name in the outgoing event will be the same as the field name specified in the feed.
- Scroll to the bottom of the Feeds tab, and then click the Save button.
Specifying filtering rules for a feed
This section explains what filtering rules are and how to configure them. Make sure that the General tenant is selected from the drop-down list that has all available tenants, in the upper-left area of the window.
About the filtering rules
Filtering rules are criteria for a feed and they let you exclude specific records from a feed.
Kaspersky CyberTrace uses filtering rules to filter the downloaded feed files during the update.The filtering rules that you specify are applied to feeds after they are updated, not to the current feeds.
Only those records that match all the specified criteria are included in the output file. If a filtering criterion is specified for a field and the field is missing from a record, this record will not be included in the output file.
Specifying filtering rules for a feed

Filtering rules section
To specify a filtering rule for a feed:
- Navigate to the Settings page.
- Open the Feeds tab.
- In the Filtering rules for feeds section, select the tab that contains the feed you need to configure.
You cannot specify filtering rules for the InternalTI supplier.
- Locate the feed that you want to configure, and then expand its section.
- In the settings section for the individual feed, locate the Filtering rules section.
- Click the Add new rule button.
- In the Field name drop-down list, select the name of one of the fields available for the feed.
Each field in a feed can have only one filtering rule associated with it. You cannot have two filtering rules specified for one field.
- In the Condition drop-down list, select the filtering condition.
For the list of possible filtering conditions, see section "Possible filtering conditions" below.
- In the Value text box, specify a filtering criterion for the field.
For more information on how to define specific filtering criteria, see subsections "Defining filtering criteria for numeric values", "Defining filtering criteria for strings", and "Defining filtering criteria for dates" below.
- Scroll to the bottom of the Feeds tab, and then click the Save button.
Possible filtering conditions
The table below lists filtering conditions that can be applied to feeds:
Possible filtering conditions
Filtering condition |
Description |
Match an exact value |
The field in a feed is exactly equal to the specified value. To apply this condition, select value is equal to in the Condition drop-down list, and then specify a single value in the Value text box. |
Match at least one of several possible values |
The field in a feed must contain one or more of the specified values. To apply this condition, select value is one of (separated by a new line) in the Condition drop-down list, and then specify several values in the Value text box. Do not specify empty values. Each new value must be separated by a new line. |
Belonging to a range of numeric values |
The field in a feed must contain the value in the specified range. To apply this condition, select value is in range (inclusive) in the Condition drop-down list, and then specify a range of values in the Value text boxes. Notice that the range boundaries are included. The values must be integers. |
Belonging to a range of numeric values that are equal to or greater than the specified value |
The field in a feed must contain a value that is equal to or greater than the specified value. To apply this condition, select value is more than (inclusive) in the Condition drop-down list, and then specify a single value in the Value text box. The value must be integer. |
Belonging to a range of numeric values that are equal to or less than the specified value |
The field in a feed must contain a value that is equal to or less than the specified value. To apply this condition, select value is less than (inclusive) in the Condition drop-down list, and then specify a single value in the Value text box. The value must be integer. |
Belonging to a range of dates |
The field in a feed must contain a date in the specified range. To apply this condition, select date is in range (inclusive) in the Condition drop-down list, and then specify a range of dates in the Value text boxes.
|
Belonging to a range of dates that are equal to or greater than the specified value |
The field in a feed must contain a date that is equal to or greater than the specified value. To apply this condition, select date is more than (inclusive) in the Condition drop-down list, and then specify a date in the Value text box.
|
Belonging to a range of dates that are equal to or less than the specified value |
The field in a feed must contain a date that is equal to or less than the specified value. To apply this condition, select date is less than (inclusive) in the Condition drop-down list, and then specify a date in the Value text box.
|
Match a non-empty value |
The field in a feed must contain any non-empty value. To apply this condition, select value is non-empty in the Condition drop-down list. |
Truncating a feed
This section explains how to limit a feed to a certain maximum number of records. Make sure that the General tenant is selected from the drop-down list that has all available tenants, in the upper-left area of the window.
About the maximum number of records in a feed
By default, Kaspersky CyberTrace imports all records that match the filtering criteria for a feed. This behavior can be changed. You can set the maximum number of records that must be imported. Kaspersky CyberTrace will import the records in the order they are arranged in the original feed up to the specified maximum of records.
Truncating a feed
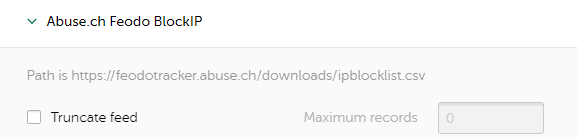
Managing the number of records in a feed
To specify the maximum number of records in a feed:
- Navigate to the Settings page.
- Open the Feeds tab.
- In the Filtering rules for feeds section, select the tab that contains the feed you need to configure.
You cannot specify the maximum number of records for the Internal TI supplier.
- Locate a feed that you want to configure, and then expand its section.
- In the settings section for the individual feed, select the Truncate feed check box.
- In the Maximum records text box, specify the maximum number of records for a feed.
- Scroll to the bottom of the Feeds tab, and then click the Save button.
Launching a feeds update manually
This section explains how to launch a feed update manually. Make sure that the General tenant is selected from the drop-down list that has all available tenants, in the upper-left area of the window.
About the manual feed updates
Kaspersky CyberTrace updates all enabled feeds automatically with a configured feeds update period. In addition, you can perform a manual feeds update at any time.
If another user has started an update, you will not be able to launch an update until the feeds are updated.
Launching a manual feeds update
To specify the feeds update period:
- Navigate to the Settings page.
- Open the Feeds tab.
- In the Feeds update period section, click the Launch update now button.
About custom, third-party, and Kaspersky feeds
This section describes the feeds available in Kaspersky CyberTrace.
About Kaspersky feeds
For more information about Kaspersky Threat Data Feeds, see About Kaspersky Threat Data Feeds.
About custom and third-party feeds
Custom and third-party feeds are feeds that you can add to Kaspersky CyberTrace.
The addition or deletion of third-party feeds, or turning on the use of OSINT feeds, can be disabled due to restrictions imposed by the licensing level. In this case, the form for adding a custom or third-party feed can be disabled.
Encoding of custom and third-party feeds
All custom or third-party feeds that you add to Kaspersky CyberTrace must be in UTF-8 encoding. If your custom or third-party feeds have a different encoding, make sure to convert them to UTF-8. You can add custom feeds that contain subnet masks of Class C networks. These feeds can be used in the matching process, by marking the feed field as IP.
Certificates and demo feeds
Kaspersky CyberTrace downloads and updates Kaspersky Threat Data Feeds that are available with the current certificate. With the default certificate, only demo feeds are available.
If you use demo feeds, a notification pops up when you select the Settings > Feeds tab. This notification states that you use Kaspersky demo feeds and provides information on how to purchase commercial feeds that have a higher level of protection. The Request access to all feeds link in the notification redirects you to the Request Kaspersky Threat Intelligence form, where you can subscribe to Kaspersky Threat Intelligence Portal and get commercial feeds.
Page topAdding a custom or third-party feed
This section explains how to add a custom or third-party feed and change its settings. Make sure that the General tenant is selected from the drop-down list that has all available tenants, in the upper-left area of the window.
You can add feeds through only one field of the URL or DOMAIN type. That is, if you mark one field in a feed as URL or DOMAIN, do not mark another field in the feed as URL or DOMAIN. The URL and DOMAIN types are counted as the same field type.
When you add a feed, it is automatically added and enabled in all settings tenants.
Adding a custom feed
To add a feed:
- In the Filtering rules for feeds section, click Add custom feed.
The Custom feed window opens:
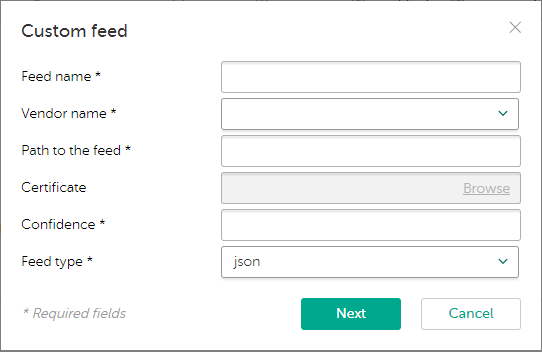
Adding a custom or third-party feed
- For any custom or third-party feed, specify the following information:
- Feed name
In the feed name, you can use Latin letters, numbers, underscores, and hyphens. The name must differ from other feed names that are already used.
Do not use FalsePositive or InternalTI as the feed name, since they are reserved for the built-in supplier names of Kaspersky CyberTrace.
Do not use the
@character in the feed name if basic authentication is used, and the username or password contains@. - Vendor name
From the drop-down list, select the name of the feed vendor or add a new one.
- Path to the feed
You can specify the path in one of the following forms:
- Full path on the computer where Kaspersky CyberTrace is installed
- Network path
The specified network path is available for the active user account, while Feed Service and Feed Utility run under the LocalService account. Therefore, if you need to download custom and third-party feeds from a network directory, give the LocalService user account access to this network directory.
The network directory must be mapped.
You can only specify the network path in Windows.
- HTTP(S) address
Starting from Kaspersky CyberTrace version 4.0, you can download Kaspersky Threat Data Feeds from https://wlinfo.kaspersky.com which were not added at the moment of the product release.
- FTP address
- Certificate
Path to the certificate that gives access to the feed. The full path must be specified.
You can only specify the certificate path if the feed will be downloaded over an HTTPS connection.
If you download Kaspersky Threat Data Feeds from https://wlinfo.kaspersky.com, the field contains the preset value
Kaspersky Lab certificate. You cannot change this value. - Feed type
This type can be one of the following:
- json
If a feed in JSON format contains a field with a subnet mask value, Kaspersky CyberTrace discloses data only if it is a first-level field. If this field is nested, Kaspersky CyberTrace cannot disclose data.
If you download Kaspersky Threat Data Feeds from https://wlinfo.kaspersky.com, JSON format is used. You cannot change this value.
- stix
Kaspersky CyberTrace currently supports STIX versions 1.0 and 1.1.
- csv
- xml
- misp
- json
- Confidence
The level of confidence of the feed. This field cannot be empty. The range of possible values is from 1 to 100.
The preset values are
100for feeds from Kaspersky,50for OSINT feeds,50for third-party feeds. You can change these values.Level of confidence is provided in the
Feeds > Feed > confidenceattribute of the Feed Service configuration file. - Authentication type
The authentication type can be Basic or None.
The basic authentication scheme is available if the path to the feed is an HTTP(S) or FTP address. For this type of authentication, enter the following settings:
- User name
This field cannot be empty.
- Password
Authentication type is provided in the
Settings > Feeds > Feedparameter of the Feed Utility configuration file. - User name
- Feed name
- For a STIX feed, also specify the following information:
- Get from a TAXII server
If this check box is selected, the STIX feed must be downloaded from the TAXII server.
When a STIX feed is downloaded from the TAXII server, Kaspersky CyberTrace parses this feed and counts the number of indicators.
- Collection name
The name of the collection that must be downloaded from the TAXII server. Note that you can specify only one collection name at a time.
Kaspersky CyberTrace does not support TAXII feeds that have information about the reputation of one object. IBM feeds like xfe.ipr and xfe.url are not supported.
- Get from a TAXII server
- For CSV and XML feeds, specify the following information:
- For a CSV feed, specify a delimiter. After that, the rule will be appllied immediately, and the columns will be split. By default, a semicolon (;) is used as a delimiter.
- For an XML feed, specify the root element. This allows you to use the names of feed elements relative to the root element. Which element to specify as the root depends on the level of nesting in a given feed.
In the following example, the root element is
root:<root><url>http</url><ip>1</ip></root><root><url>https</url><ip>2</ip></root>In the following example, the root element is
root/element*:<root><element1><url>http</url><ip>1</ip></element1></root><root><element2><url>https</url><ip>2</ip></element2></root>You cannot use wildcard characters (the asterisk (
*) or question mark (?)) to specify the path, only the root element.
After you specify a custom or third-party feed and the settings for it, the feed is fully loaded and a part of it is displayed so that you can choose the fields of the feed to be used in the matching process (see section "Configuring feed fields to be used for matching (CSV, JSON, XML feeds)" below).
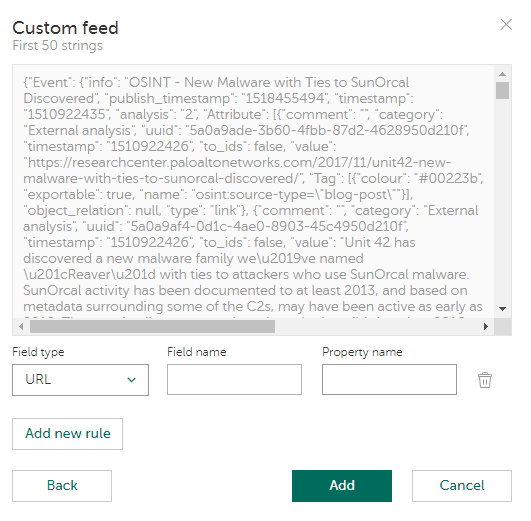
Selecting feed fields for matching
This is relevant for feeds in the following formats: CSV, JSON, XML. After a STIX or MISP feed is added, Kaspersky CyberTrace fully loads it for use.
In some cases (when a STIX feed is too large or the TAXII server used for downloading the feed is too slow, or both), it may take Kaspersky CyberTrace up to an hour to load a STIX feed.
Configuring feed fields to be used for matching (CSV, JSON, XML feeds)
To choose feed fields to be used for matching, specify the following information for each field:
- Field type
One of the following values can be used as the field type:
- URL
- MD5
- SHA1
- SHA256
- IP
- DOMAIN
- CONTEXT
Note that there must be at least one field with a type other than CONTEXT. Such fields are used for matching. When such a field is involved in the detection process, a detection event is generated with the
%FEEDNAME%_%FIELDTYPE%category, where%FEEDNAME%is the feed name and%FIELDTYPE%is the field type.A feed can have one field of the CONTEXT type, at most one field of the URL or DOMAIN type, and several fields of other types. The URL and DOMAIN types are considered the same field type.
- Field name
This name will be referred to in the matching process.
In the field name, you can use Latin letters, numbers, underscores, and hyphens. The name must contain at least one Latin letter.
- Reference to the data in the feed:
- For a CSV feed, specify the column number.
- For a JSON feed, specify the property name.
For JSON feeds, the name of the property is case-sensitive. Specify property names in the same case as they are in a JSON feed.
To specify a nested field, use a slash (
/): for example,mainField/subField. - For an XML feed, specify the element.
Specify the full path to the element relative to the root element. You cannot use wildcard characters (the asterisk (
*) or question mark (?)) to specify the path, only the root element. The path is case sensitive.In the following example, if you specified
root/element*as the root element, then the full path to the elements relative to the root element isurlandip, notroot/element1/urlorroot/element2/ip:
<root>
<element1>
<url>http</url>
<ip>1</ip>
</element1>
</root>
<root>
<element2>
<url>https</url>
<ip>2</ip>
</element2>
</root>
When adding a custom or third-party feed, feeds updating can be performed. In this case, you will see a notification about it, and a new feed will not be added. We recommend that you wait awhile and then try again to add a feed.
Page topConfiguring a custom or third-party feed
This section explains how to configure a custom or a third-party feed. Make sure that the General tenant is selected from the drop-down list that has all available tenants, in the upper-left area of the window.
Changing the settings of a custom or third-party feed
To change the settings of a custom or third-party feed:
- In the Filtering rules for feeds section, select the tab that contains the feed you need to configure.
You cannot change the settings for the Internal TI supplier.
- Click the name of the feed that you want to modify, and then click Edit.

Editing a custom or third-party feed
- In the Edit custom feed window that opens, make any necessary changes.
- Click Save.
You can change all the settings of a custom or third-party feed, except the feed type. For example, you cannot change a CSV feed to JSON.
Adding new fields to a custom or third-party feed
If a new field or fields have been added to your custom or third-party feed being used, and you want Kaspersky CyberTrace to start using these new fields, do the following:
- For a CSV, JSON, or XML feed, follow the procedure outlined in subsection "Changing the settings of a custom or third-party feed" above, to open the Edit custom feed window. Then add each new field by clicking the Add new rule button and specifying the values described above in "Step 2. Choosing feed fields to be used for matching".
If you do not specify any new fields for a feed, the feed will contain them, but they will not be displayed in the Available fields subsection and will not be used in the matching process.
- For a STIX feed, in the Filtering rules for feeds section, click the feed name and, in the Available fields subsection, select any new field or fields that must be used by CyberTrace, and then click Save.
For more information, see section Specifying filtering rules for a feed.
Deleting a custom or third-party feed
To delete a custom or third-party feed:
- In the Filtering rules for feeds section, select the tab that contains the feed you need to delete.
You cannot delete the Internal TI supplier.
- Click the name of the feed that you want to delete, and then click Delete.
Managing false positives
This section explains how to manage the False Positives supplier on the Feeds tab. Make sure that the General tenant is selected from the drop-down list that has all available tenants, in the upper-left area of the window.
You can access the false positives list by clicking the Manage False Positives button in the Filtering rules for feeds section.
Managing the false positives list
To access the false positives list, click the Manage False Positives button.
The False Positives window opens:
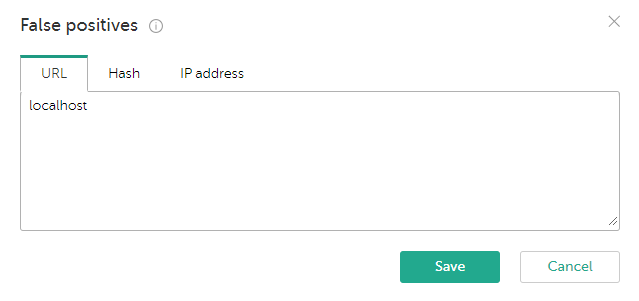
False Positives list
You can edit the false positives list of indicators as follows:
- Select the URL, Hash, or IP address tab to manage the group you want.
On the URL tab, you can specify a URL containing a wildcard symbol
*(for example,example.com/testpage/*, which will match URLs such asexample.com/testpage/test1andexample.com/testpage/test/long_url).Starting from Kaspersky CyberTrace version 4.0, the
*symbol in the URL is not used as a wildcard. The*just means the "asterisk."Kaspersky CyberTrace will apply normalization rules to any URL that you add on the URL tab and which is not yet contained in the indicator database. Thus, the representation of these URLs may change. For example, if you add a URL that contains a port, this port value will be removed. For instructions on how Kaspersky CyberTrace normalizes a URL, see subsection "URL normalization rules" below.
- Every indicator must be on a separate line in the text box.
The false positives list is checked only after all events from a thread have been matched against all the suppliers. The main purpose of the false positives list is to enable Kaspersky CyberTrace to ignore detections for trusted indicators. If any feed produces a detection, but a given indicator is found in the false positives list, Kaspersky CyberTrace does not generate a detection event. In this case, on the Dashboard tab, in the Supplier statistics table, the value in the False positives column corresponding to the supplier that produced the detection is incremented by one. The values in the False positives column show how many false detections were produced by each supplier. For more information about the Dashboard, see section "Kaspersky CyberTrace Dashboard".
URL normalization rules
Any URLs added to the false positives list on the URL tab will be normalized according to the following URL normalization rules:
- Remove dot segments ("
." and "..") according to the algorithm described in RFC 3986, section 5.2.4 Remove Dot Segments (https://www.ietf.org/rfc/rfc3986.txt):http://www.example.com/../a/b/../c/./d.html => http://www.example.com/a/c/d.html - Remove the protocol:
http://example.com => example.com - Convert internationalized domain names according to the Punycode algorithm described in RFC 3492 (https://www.ietf.org/rfc/rfc3492.txt):
тест.рф => xn--e1aybc.xn--p1ai - Remove the
wwwprefix:www.example.com => example.com - Remove repeated slashes:
example.com//dir/test.html => example.com/dir/test.html - Remove the trailing slash at the end of the URL:
example.com/ => example.com - Remove the authorization information:
login:password@example.com => example.com - Remove the port number:
example.com:80/index => example.com/index - Remove the
#fragmentreference:example.com#fragment => example.com - Remove dots at the end of the host name:
example.com./index.html => example.com/index.html - Convert percent-encoded symbols to UTF-8 according to RFC 3986 (https://www.ietf.org/rfc/rfc3986.txt) and RFC 2279 (https://www.ietf.org/rfc/rfc2279.txt).
- Convert all characters to lower case:
EXAMPLE.COM => example.com - Convert the IP address (if any) leading to the requested host to dot-decimal notation:
0112.0175.0117.0150 => 74.125.79.104
Matching process settings
You can manage the matching process settings by selecting the Settings tab and then the Matching tab.
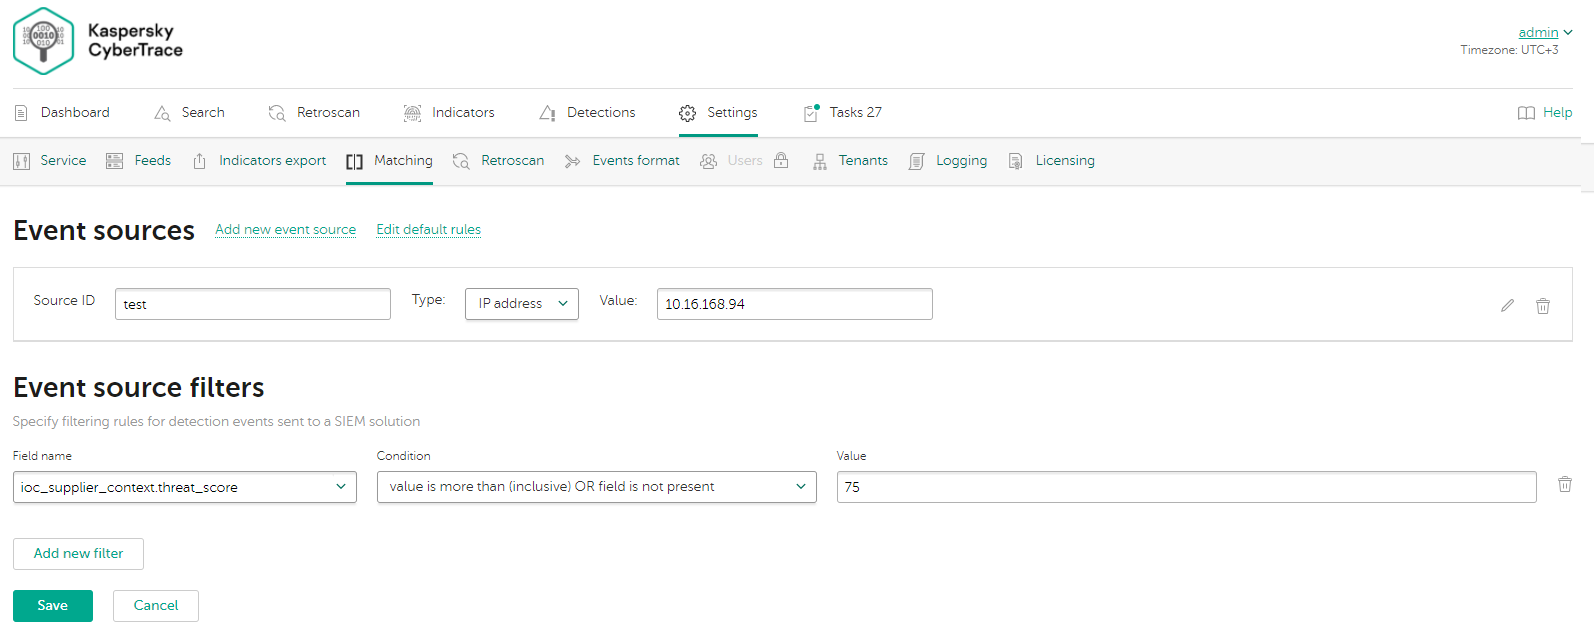
Event sources
In Kaspersky CyberTrace, regular expressions and event normalizing rules are grouped by event source. Regular expressions and event normalizing rules that are not related to a specific event source are grouped under the default event source. Each event source must have at least one regular expression. You can add or remove event sources other than default or edit their properties.
The Event sources page displays all event sources defined in the Feed Service configuration file, except the default event source. You can edit the following properties of the displayed event sources directly in the Event sources page:
- Source ID
The name of the event source. It must be unique among the event source names used. In the name the following symbols are allowed: Latin letters, numbers, a hyphen (
-), and a period (.). - IP address or Host name or Regular expression
The IP address of a device that issues events for which you want to add parsing rules. The host name of a device that issues events. The regular expression that will match the source in the events received by Kaspersky CyberTrace.
The value in the Host name box must be the same as the value in the
HOSTNAMEfield of the incoming syslog messages from this event source.The value in the Regular expression box must be optimized. For more information on how to optimize regular expressions, see the "Optimization of regular expressions" subsection of the "About regular expressions" section.
To edit the event normalizing rules and regular expressions defined for a displayed event source, select the corresponding Properties link. For the default event source, you must select the Edit default rules link. In both cases, the form for editing event source properties opens (see subsection "Form for editing event source properties" below).
For more information on event sources and regular expressions used for parsing events that are issued by various devices, see section "About regular expressions".
Adding event sources
To add an event source:
- Select the Add new event source link.
The Add New Event Source Wizard starts.
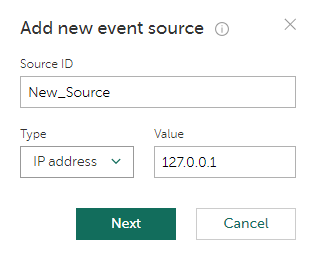
Adding a new event source (step 1)
- Specify the name and the IP address or host name or the regular expression of a new event source.
- Click Next.
If the data entered at the previous step is correct, the form for specifying regular expressions and event normalizing rules opens (see subsection "Form for editing event source properties" below).
Kaspersky CyberTrace will attempt to obtain data from received events by using the default regular expressions. We recommend that you keep collecting events for at least five seconds.
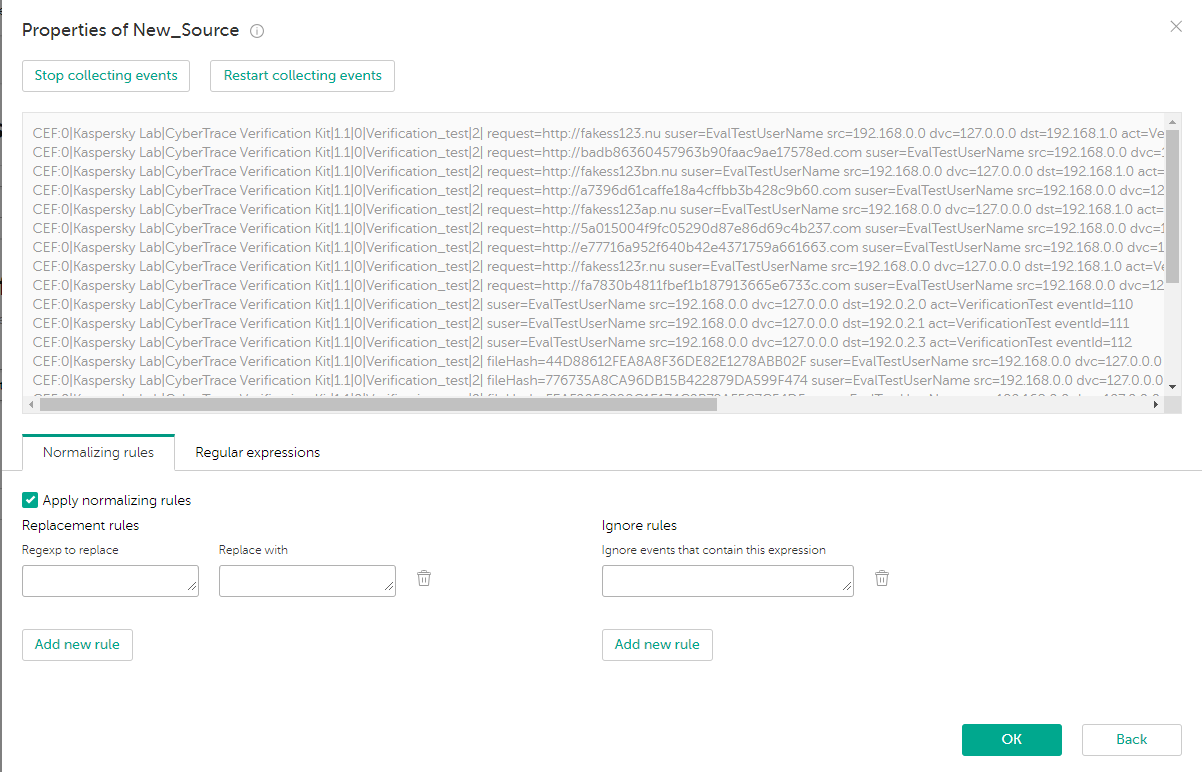
Specifying the event source properties
- Specify the event source properties and click OK.
If the entered event source properties are correct, a new event source is created.
Form for editing event source properties
The form for editing event source properties has an upper area and the lower area. The upper area displays events and highlights substrings that are extracted by a selected regular expression. The lower area has two tabs: the Normalizing rules tab and the Regular expressions tab.
When the form for editing event source properties opens, it starts collecting events that are issued by the event source. These events are processed according to the normalizing rules and the result is displayed in the upper area of the form.
If you have specified the host name of the event source, but the HOSTNAME field of incoming events cannot be extracted, no event is displayed. To fix this problem, either specify the IP address or regular expression of the event source, or change the format of events.
You can pause (or resume), or restart collecting the arriving events in real time. If you restart collecting the incoming events, the text box for displaying events is cleared. This text box can contain up to 50 lines. If more data arrives, older data is removed.
Specifying event normalizing rules
In the lower area of the form for editing event source properties, select the Normalizing rules tab to add, remove, or edit normalizing rules that will be applied to incoming events that meet the conditions of the event source. You can specify which character sequences must be replaced with others (replacing rules) and which character sequences must be used for identifying events to ignore (ignoring rules). If you clear the Apply normalizing rules check box, all the controls for specifying normalizing rules will be disabled, and no normalizing rule will be saved for the event source being edited.
Do not specify the newline character (\n) in replacing rules. Use the InputSettings > EventDelimiter element of the Feed Service configuration file to separate compound incoming events into individual events.
For an event source that is being created, initially the form under the Normalizing rules tab is filled with the normalizing rules specified for the default event source.
Specifying regular expressions
In the lower area of the form for editing event source properties, select the Regular expressions tab to add, remove, or edit regular expressions that will be applied to incoming events that meet the conditions of the event source. For an event source that is being created, initially the form under the Regular expressions tab is filled with the regular expressions that are specified for the default event source and that extract at least some data from the events that are displayed.
Regular expressions have the following properties:
- Indicator type
The type of data to be extracted from an event. You can set one of the following indicator types:
- URL
- MD5
- SHA1
- SHA256
- HASH
- IP
- DOMAIN
- CONTEXT
- Regular expression name
The regular expression name must be unique among the names of the regular expressions that relate to the same event source.
- Regular expression itself
The regular expression used for extracting the required value from an event. For more information on regular expressions, see section "About regular expressions".
- Extract all check box
If this check box is cleared, the regular expression will extract only the first matched value. If this check box is selected, the regular expression will extract all of the matched values.
- Concatenation rules
You can specify how to concatenate different parts of extracted data to a single value. For information about concatenation of extracted data, see section "About regular expressions", subsection "Compound values".
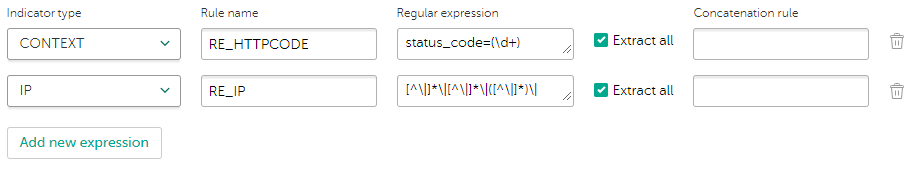
Setting regular expressions and their properties
You can highlight values that match the regular expressions that you specified for the event source. Click inside the text box that contains the regular expression that you want to highlight.
Specifying event filters
You can specify filtering rules for detection events sent to a SIEM solution from Kaspersky CyberTrace. Kaspersky CyberTrace will send detection events only if the flag for sending detection events to the SIEM solution (the ioc_supplier_send_match event attribute from the indicator database) is set to true and all fields of a feed record that matched the indicator meet the filtering criteria. Note that if the detected indicator does not have the attribute specified in the filtering rule, this indicator is considered to meet the filter. However, all detection events will be included in statistics and displayed on the Dashboard and Detections tabs.
To specify filters for detection events:
- In the Field name drop-down list, select the value corresponds to the indicator attribute name from the indicator database to which filtering rules are applied.
To learn more about possible values for
%FIELD_NAME%, see section "Working with indicators". - In the Condition drop-down list, select a filtering condition.
For the list of possible filtering conditions, see section "About filtering criteria for sending events to SIEM".
- In the Value text box, specify a filtering value.
- Click the Add new filter button if you want to add new event filter.
If necessary, you can edit or delete any filtering rules.
Page topAdding normalizing rules
This section explains how to add normalizing rules to an event source.
About normalizing rules
Normalizing rules are used for transforming events. After Kaspersky CyberTrace applies normalizing rules to an incoming event, the event is processed using regular expressions.
There are two types of normalizing rules:
- Replacing rules
Rules for replacing one character sequence with another.
- Ignoring rules
Rules for ignoring events that contain a character sequence.
If the replacing rules and ignoring rules are set, replacing rules are applied first and ignoring rules are applied second.
In the specified regular expressions, the asterisk (*) and question mark (?) are not treated as wildcard characters.
Adding normalizing rules
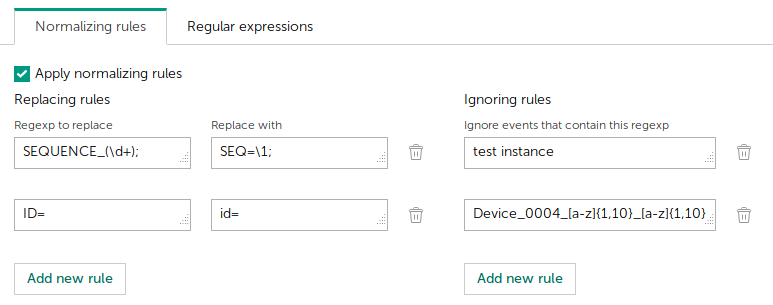
Adding normalizing rules
To add a normalizing rule:
- Navigate to the Settings page.
- Open the Matching tab.
- Locate an event source that must use the new normalizing rule. Click
 to open source properties.
The window with the properties of the selected event source opens.
- Locate the Normalizing rules tab.
- Select the Apply normalizing rules check box.
- If normalizing rules are already specified for the event source, add a new entry. Click Add new rule to add extra text boxes for new rule parameters.
- Specify rule parameters:
- For a replacing rule, specify a regular expression in the Regexp to replace text box and a replacement in the Replace with text box.
- For an ignoring rule, specify a regular expression in the Ignore events that contain this expression text box.
- Click the OK button.
About regular expressions
This section describes regular expressions and provides information about using them.
About regular expressions
Regular expressions are used to parse incoming events processed by normalizing rules. They extract information to be checked in feeds and to be used in outgoing events.
The preset regular expressions correspond to the format of the events used in the verification test.
After the verification test is performed, you may have to add some new regular expressions or change existing ones for use with specific event source software. For examples of regular expressions to be used for parsing events issued by popular devices, see section "Regular expressions for popular devices".
We recommend that you set regular expressions for extracting data such as the IP address and port of the event source, and of the event target, user name, and date. Use these regular expressions to define the format of the outgoing events.
About regular expression names
You can use any name for a regular expression except the following ones:
SourceIdMatchedIndicatorRecordContextCategoryActionableFieldsConfidenceIndicatorInfo
Compound values
The concatenate attribute is used to set a rule for creating a compound value from data extracted from an event. A rule refers to groups of extracted data by using #N symbols, where N is the number of a group (starting from 1). If a backslash (\) precedes the hash symbol (#), the latter is not used in the number of a group; instead, the # is treated merely as a number sign.
The following example event is parsed:
url_1=http://domain test_event url_2=/page/mypage test
The regular expressions used and the results of parsing of the example event are provided in the table below.
Examples of applying regular expressions
Regular expression |
Result of parsing |
|
http://domain/page/mypage |
|
/page/mypagehttp://domain |
|
/page/mypage_/_http://domain |
If no concatenation rule is set or the value of the concatenate attribute is empty, and the regular expression contains more than one group, the values of the groups are concatenated in the order in which they appear in the regular expression.
If the concatenate attribute contains more groups than the regular expression contains, the extra groups will be ignored and will be substituted with the corresponding #N text.
Event being parsed: url_1=http://domain test_event url_2=/page/my_page test Regular expression used: <RE_URL concatenate="#1#2#3">url_1=(.*?)\stest_event\surl_2=(.*?)\stest</RE_URL> Result of parsing: http://domain/page/my_page#3 |
Multiple matching
When parsing an event by using a regular expression, it is possible to extract all values that match the regular expression. For this purpose, set the value of the extract attribute to "all". If this value is set to "first" or the attribute is not specified, only the first value that matches the regular expression will be extracted.
For every matched value a separate detection event is generated. If the detection process does not affect a certain event field, the value of this field in the output event is set to a hyphen (-).
Event being parsed: ip1=12.12.12.12 ip2=23.23.23.23 hash1=abc hash2=cde user1=N1 user2=N2 Configuration file elements: <RegExps> <Source id="default"> <RE_IP extract="all">...</RE_IP> <RE_HASH extract="all">...</RE_HASH> <RE_USER extract="first">...</RE_USER> </Source> </RegExps> <EventFormat>ip=%RE_IP% hash=%RE_HASH% user=%RE_USER% %FeedContext%</EventFormat> Available feed records: IP = 12.12.12.12 IP = 23.23.23.23 hash = cde Detection events generated: ip=12.12.12.12 hash=- user= N1 <context for 12.12.12.12> ip=23.23.23.23 hash=- user= N1 <context for 23.23.23.23> ip=- hash=cde user=N1 <context for cde> |
Specifying characters by their hexadecimal code
Feed Service uses regular expressions that conform to PCRE syntax. This syntax allows specifying a character by its code in several ways.
Feed Service does not support specifying a character in \x{hhh..} format. Instead, specify a character by its code in the following way: \uhhhh, where hhhh is the hexadecimal code of the character. For example, you cannot use a ([\x{00a1}-\x{ffff}]) expression, but you can use a ([\u00a1-\uffff]) expression.
Optimization of regular expressions
You can optimize regular expressions to prevent backtracking that interfere with matching a string.
To optimize regular expressions, use the following rules:
- Use possessive quantifiers
(++, *+). - If possible, use non-matching group
(?:)with outer brackets. - Try to use alternation as little as possible and find matches at the end of the string. The alternation operator has the lowest precedence of all regular expression operators.
- Use the anchors
(^, $)that match the starting and the ending position within the string. - Use an atomic group. Atomic groups automatically discard all backtracking positions remembered by any tokens inside the group. The syntax is
(?> ...). - In long regular expressions, try to avoid exponentially increasing the amount of backtracking. An example such as
(qwerty.*)*is not recommended.
About filtering criteria for sending events to SIEM
You can specify filtering rules for detection events by using Kaspersky CyberTrace. Each filtering rule is set in the Matching > Event source filters section. The indicator attribute name is set from the indicator database, and filtering conditions and filtering values are specified in the Field name drop-down list, the Condition drop-down list, and the Value text box, respectively. Note that if the detected indicator does not have the attribute specified in the filtering rule, this indicator is considered as meeting the filtering criteria.
Kaspersky CyberTrace will send detection events only if the flag for sending detection events to the SIEM solution (the ioc_supplier_send_match_event attribute from the indicator database) is set to true and all fields of a feed record that matched the indicator meet the filtering criteria.
The table below lists filtering conditions that can be applied to detection events:
Possible filtering conditions
Filtering condition |
Description |
Equal to a specific value |
The indicator attribute is equal to the specified value. To apply this condition, select value is equal to OR field is not present in the Condition drop-down list, and then specify a single value in the Value text box. |
Equal to at least one of several values |
The indicator attribute must contain one or more of the specified values. To apply this condition, select value is one of (separated by a new line) OR field is not present in the Condition drop-down list, and then specify several values in the Value text box. Do not specify empty values. Each new value must be separated from the previous value by a new line. |
Belonging to a range of numeric values |
The indicator attribute must contain a value in the specified range. To apply this condition, select value is in range (inclusive) OR field is not present in the Condition drop-down list, and then specify a range of values in the Value text boxes. Notice that the range boundaries are included. The values must be integers. |
Belonging to a range of numeric values that are greater than or equal to the specified value |
The indicator attribute must contain a value that is greater than or equal to the specified value. To apply this condition, select value is more than (inclusive) OR field is not present in the Condition drop-down list, and then specify a single value in the Value text box. The value must be an integer. |
Belonging to a range of numeric values that are less than or equal to the specified value |
The indicator attribute must contain a value that is less than or equal to the specified value. To apply this condition, select value is less than (inclusive) OR field is not present in the Condition drop-down list, and then specify a single value in the Value text box. The value must be an integer. |
Belonging to a range of dates |
The indicator attribute must contain a date in the specified range. To apply this condition, select date is in range (inclusive) OR field is not present in the Condition drop-down list, and then specify a range of dates in the Value text boxes. You can use a In addition, you can choose an arbitrary number of days or one of the following preset values for boundaries as the relative values to
|
Belonging to a range of dates that are greater than or equal to the specified value |
The indicator attribute must contain a date that is equal to or greater than the specified value. To apply this condition, select date is more than (inclusive) OR field is not present in the Condition drop-down list, and then specify a date in the Value text box. You can use a In addition, you can choose one of the following preset values for the boundary (this value is relative to
|
Belonging to a range of dates that are less than or equal to the specified value |
The indicator attribute must contain a date that is less than or equal to the specified value. To apply this condition, select date is less than (inclusive) OR field is not present in the Condition drop-down list, and then specify a date in the Value text box. You can use a In addition, you can choose one of the following preset values for the boundary (this value is relative to
|
Equal to a non-empty value |
The indicator attribute must contain any non-empty value. To apply this condition, select value is non-empty in the Condition drop-down list. |
Configuring event sources with custom regular expressions
This section explains how to use the web interface to add and configure event sources with custom regular expressions.
Kaspersky CyberTrace sends information about a detection to a SIEM as a single event. To reduce dwell time, all context information that is required for triage and investigation should be included into this event. This can be accomplished by configuring event sources and custom regular expressions.
Repeat the steps below for every unique source of events that you have.
To configure an event source with custom regular expressions:
- Create an event source as described in section "Matching process settings".
- In addition to regular expressions for indicators (
URL,IP,MD5and other indicator types), add regular expressions ofCONTEXTtype. Regular expressions ofCONTEXTtype must match any information that will be relevant for the response, such as event identifiers, request identifiers, and time stamps. This context information will also help to search for raw events in the SIEM software, if required. - We recommend replacing universal regular expressions for indicators with the ones that match the event source event format. Regular expressions for many popular devices are described in section "Regular expressions for popular devices".
- Add all
CONTEXTregular expressions to the Detection events format field. To do so, specify the names of all regular expressions in the detection events format by using the%RegexpName%pattern.
Example
The event source for this example is a McAfee Web Gateway source.
The event source with custom regular expressions is configured as follows:
- Create a new event source.
This event source sends logs through the SIEM software, so adding this event source by IP is not possible because all such event sources will have the IP address of the SIEM software. Instead, specify a regular expression that will identify this event source based on the data contained in the events. For example, the expression can match a device name or a device version that are contained in the events. Note that If your event source sends the events directly to Kaspersky CyberTrace, specify such source by its IP instead.
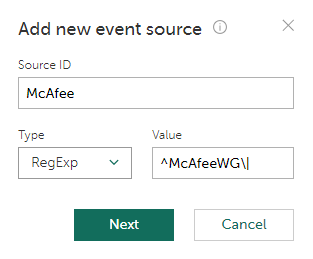
Creating a new event source
- Start collecting events and receive several sample events.
Only those events that matched the regular expression specified in the previous step will be displayed.
For example, events with the following data were received:
McAfeeWG|time_stamp=[01/Jan/2015:02:12:31 +0800]|auth_user=jsmith|src_ip=10.10.69.1|server_ip=192.0.2.1|host=www.example.com|url_port=80|status_code=301|bytes_from_client=279|bytes_to_client=1149|categories=Business, Software/Hardware|rep_level=Minimal Risk|method=GET|url=http://www.example.com/|media_type=text/html|application_name=|user_agent=Mozilla/5.0 (compatible; MSIE 10.0; Windows NT 6.2; WOW64; Trident/6.0)|block_res=0|block_reason=|virus_name=|hash=|filename=|filesize=753|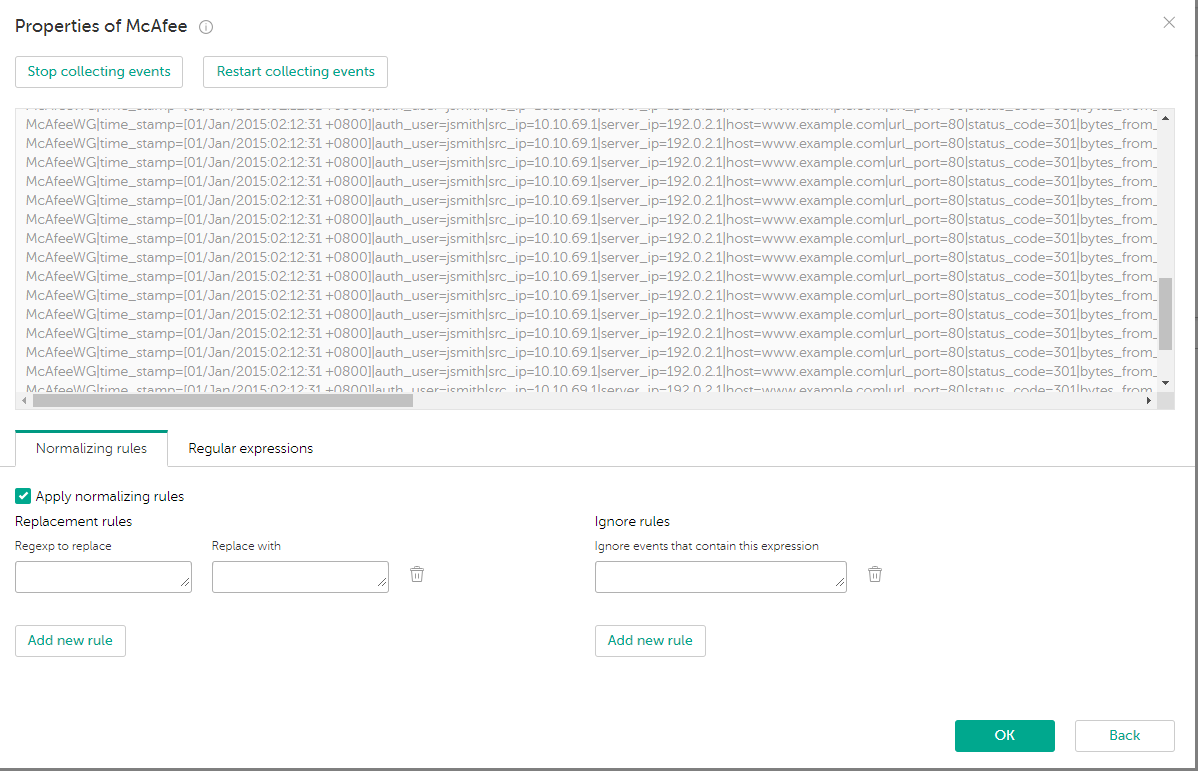
Collecting events
- Stop collecting events. Regular expressions for URL and IP will be specified automatically. Replace these expressions with custom ones. Then add regular expressions of
CONTEXTtype.To match the user name contained in the events, add an expression named
RE_USERNAME. Specify the following value for the expression:auth_user\=(.*?)(?:\|)To match the source IP address, add an expression named
RE_SRCIP. Specify the following value for the expression:src_ip\=(.*?)(?:\|)To match the URL, add an expression named
RE_URL. Specify the following value for the expression:url\=(.*?)(?:\|)To match the HTTP status code, add an expression named
RE_HTTPCODE. Specify the following value for the expression:status_code=(\d+)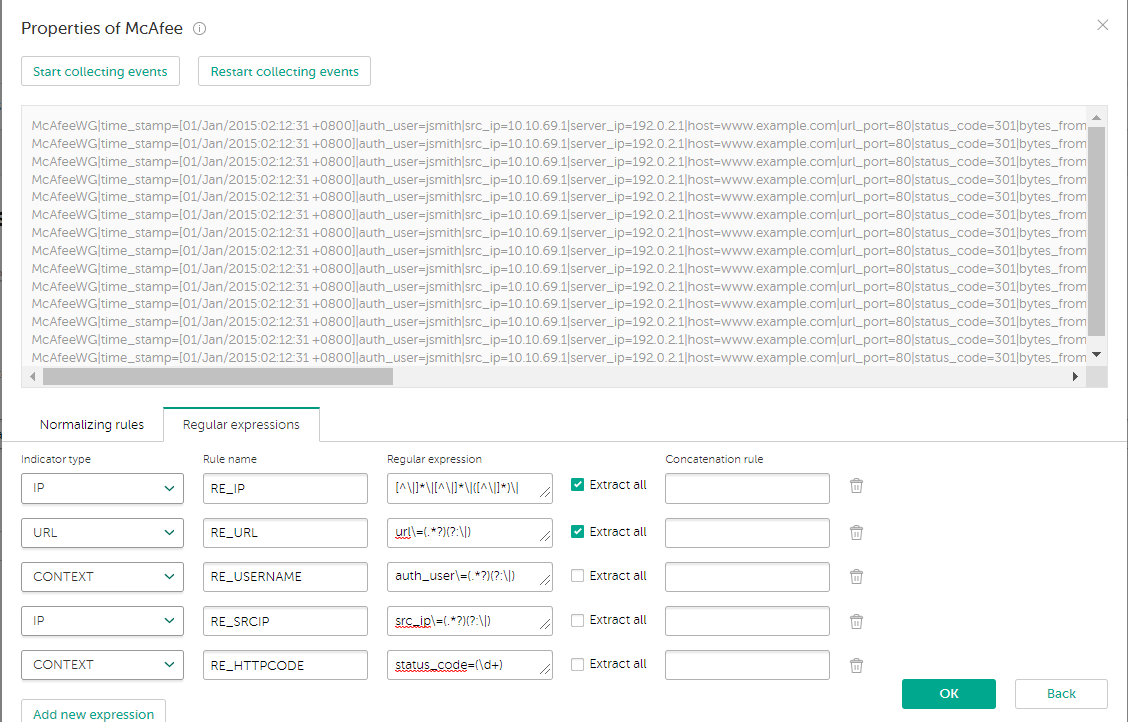
Specifying custom regular expressions
- Specify an event output format that contains these regular expressions:
eventName=%Category% matchedIndicator=%MatchedIndicator% url=%RE_URL% src=%RE_SRCIP% ip=%RE_IP% http_code=%RE_HTTPCODE% usrName=%RE_USERNAME% %RecordContext%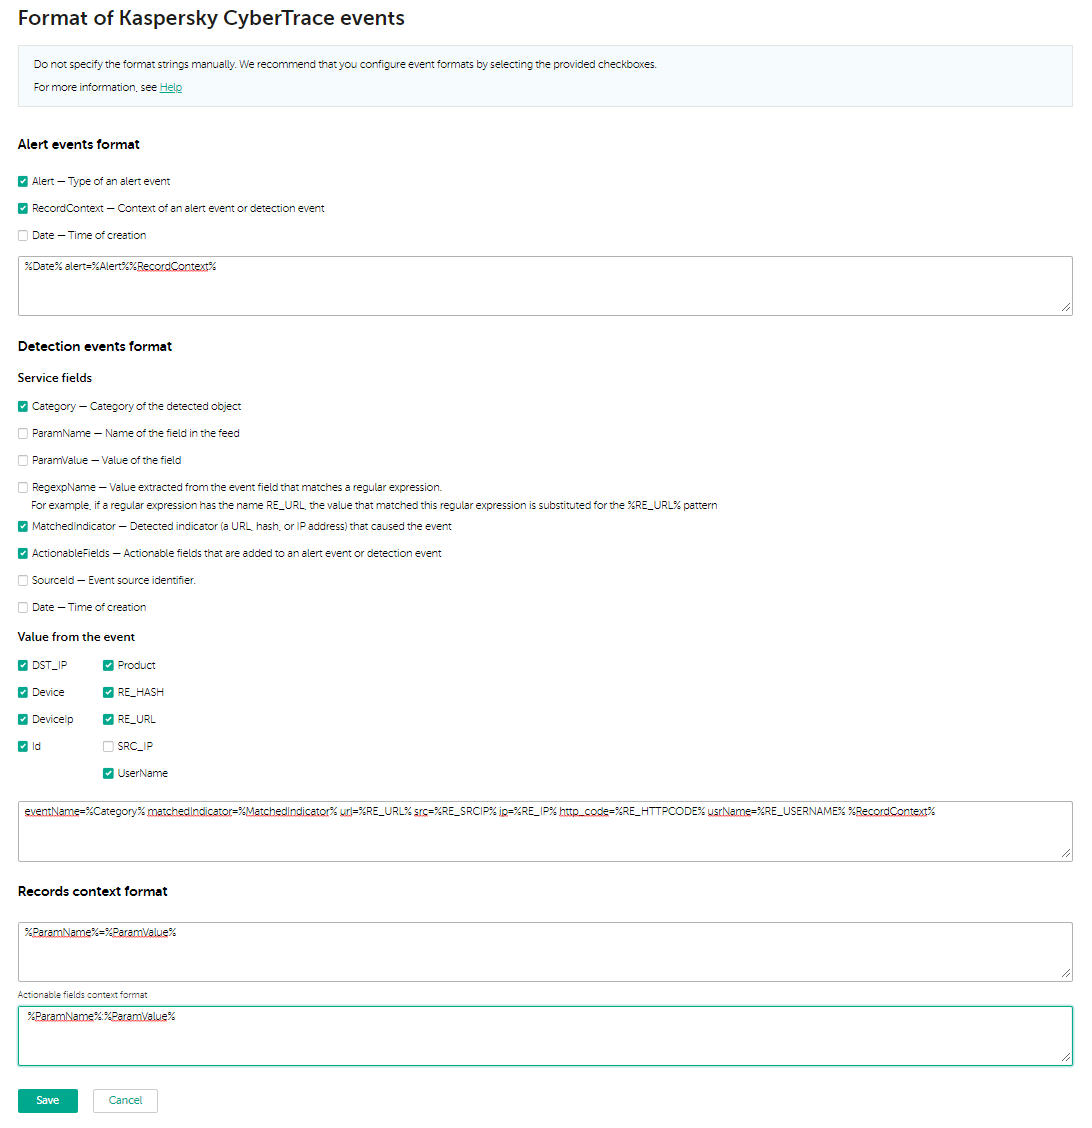
Specifying the output format of events
After the steps above are done, the detected events will contain the context fields. For example, an event from Kaspersky CyberTrace can have the following information:
device=McAfee eventName=KL_IP_Reputation matchedIndicator=192.0.2.1 url=- src=10.10.69.1 ip=192.0.2.1 http_code=301 category=test usrName=jsmith first_seen=01.01.2017 00:00 ip=192.0.2.1 ip_geo=ru last_seen=20.11.2019 10:02 popularity=1 threat_score=75
Page topRegular expressions for popular devices
This section provides regular expressions that are to be used for parsing events issued by popular devices.
Devices of different versions can issue events of different format, so it may be that you must use other regular expressions than those provided in this section.
FireEye devices
The events from FireEye devices require the following regular expressions:
- Events in CEF format
Field
Regular expression
URL1
filePath=([^\s]*?)\sURL2
cs5=([^\s]*?)\sMD5
fileHash=([^\s]*?)\sSrcIp
src=([^\s]*?)\sDstIp
dst=([^\s]*?)\s - Events in CSV format
Field
Regular expression
URL1
cnchost=([^,]*?),URL2
objurl=([^,]*?),MD5
fileHash=([^,]*?),SrcIp
src=([^,]*?),DstIp
dst=([^,]*?),
Blue Coat SG devices
The events from Blue Coat SG devices require the following regular expressions:
- SYSLOG events
Field
Regular expression
URL
OBSERVED\s"(?:.*?)"\s(.*?)\sURL2
http\s(.*?)\s\d+\s(.*?)\s
Websense devices
The events from Websense devices require the following regular expressions:
- CEF events
Field
Regular expression
URL
request\=(.*?)(?:\s|$)IP address
dst\=(\d{1,3}\.\d{1,3}\.\d{1,3}\.\d{1,3})(?:\s|$) - LEEF events
Field
Regular expression
URL
url\=(.*?)(?:\s|$)IP address
dst\=(\d{1,3}\.\d{1,3}\.\d{1,3}\.\d{1,3})(?:\s|$) - key-value pairs
Field
Regular expression
URL
url\=(.*?)(?:\s|$)IP address
dst_ip\=(\d{1,3}\.\d{1,3}\.\d{1,3}\.\d{1,3})(?:\s|$)Squid devices
The events from Squid devices require the following regular expressions:
Field |
Regular expression |
URL |
|
McAfee Web Gateway devices
The events from McAfee Web Gateway devices require the following regular expressions:
- Standard events
Field
Regular expression
URL
url\=(.*?)(?:\|)IP address
server_ip\=(\d{1,3}\.\d{1,3}\.\d{1,3}\.\d{1,3})(?:\|) - CEF events
Field
Regular expression
URL
request\=(.*?)(?:\s|$)IP address
dst\=(\d{1,3}\.\d{1,3}\.\d{1,3}\.\d{1,3})(?:\s|$) - SYSLOG events
Field
Regular expression
URL
(?:GET|POST)\s(.*?)(?:\s)
Check Point URL Filtering devices
The events from Check Point URL Filtering devices require the following regular expressions:
- SYSLOG events
Field
Regular expression
IP address
(?:dst)\s(\d{1,3}\.\d{1,3}\.\d{1,3}\.\d{1,3})
Juniper Networks SRX devices
The events from Juniper Networks SRX devices require the following regular expressions:
- SYSLOG events
Field
Regular expression
IP address
(?:\sdestination-address)\="(\d{1,3}\.\d{1,3}\.\d{1,3}\.\d{1,3})"\s
Check Point Firewall devices
The events from Check Point Firewall devices require the following regular expressions:
- SYSLOG events
Field
Regular expression
IP address
dst\:(\d{1,3}\.\d{1,3}\.\d{1,3}\.\d{1,3})
Palo Alto Networks devices
The events from Palo Alto Networks devices require the following regular expressions:
- LEEF events
Field
Regular expression
IP address
dst\=(\d{1,3}\.\d{1,3}\.\d{1,3}\.\d{1,3})(?:\s|$) - SYSLOG events
Field
Regular expression
IP address
(?:dst.*?)(\d{1,3}\.\d{1,3}\.\d{1,3}\.\d{1,3}) - CEF events
Field
Regular expression
IP address
dst\=(\d{1,3}\.\d{1,3}\.\d{1,3}\.\d{1,3})(?:\s|$)
Fortinet FortiGate devices
The events from Fortinet FortiGate devices require the following regular expressions:
- SYSLOG events
Field
Regular expression
IP address
(?:dst.*?)(\d{1,3}\.\d{1,3}\.\d{1,3}\.\d{1,3})
Cisco IPS devices
The events from Cisco IPS devices require the following regular expressions:
Field |
Regular expression |
IP address |
|
Snort devices
The events from Snort devices require the following regular expressions:
- UNIFIED2 events
Field
Regular expression
IP address
(?:destination.*?)(\d{1,3}\.\d{1,3}\.\d{1,3}\.\d{1,3}) - CSV events
Field
Regular expression
IP address
(?:.*?,.*?,.*?,.*?,)(\d{1,3}\.\d{1,3}\.\d{1,3}\.\d{1,3})
Alternatively, you can use the following regular expressions for parsing events of all types:
Field |
Regular expression |
IP address |
|
Cisco IronPort devices
The events from Cisco IronPort devices require the following regular expressions:
- SYSLOG events
Field
Regular expression
URL
(?:GET|POST)\s(.*?)\sIP address
(?:NONE|DIRECT|DEFAULT_PARENT)\/(\d{1,3}\.\d{1,3}\.\d{1,3}\.\d{1,3})
Event format settings
You can manage the settings for formats of events in the CyberTrace web user interface by selecting the Settings tab and then the Events format tab. Depending on the item selected in the drop-down list with all available tenants in the upper-left area of the window, you edit either the general event format settings (if General is selected) or the event format settings for a particular settings tenant (if a particular settings tenant is selected).

Kaspersky CyberTrace events formats
On the Events format tab, you can specify the formats of detection events, alert events, record context, and actionable fields context.
We do not recommend changing the format of events format manually. Select the check boxes with the patterns that you want to use in outgoing events and Kaspersky CyberTrace will update the format automatically.
Some event sources may require that you change the event format, depending on your integration. For more information, see the section "Setting event formats for specific event sources" below.
For more information about formats and patterns that you can specify, see About event formats and patterns.
This tab has the following text fields:
- Alert events format—Specify the format for outgoing events that inform the event target software of the state of Feed Service.
- Detection events format—Specify the format for outgoing detection events.
This section consists of two subsections:
- Service fields
Values of these fields are patterns generated by Kaspersky CyberTrace.
Select the check boxes with the patterns that you want to use in outgoing detection events. Kaspersky CyberTrace will update the format automatically.
- Value from the event
Values of these fields are extracted from the incoming events with regular expressions defined for the event source.
Select the check boxes with the patterns that you want to use in outgoing detection events. Kaspersky CyberTrace will update the format automatically.
- Service fields
- Records context format—Specify the format in which the names and values of the feed fields are inserted into outgoing events.
- Actionable fields context format—Specify the format in which the names and values of the actionable feed fields are inserted into outgoing events.
Setting event formats for specific SIEM solutions
The correct format of alert and detection events depends on your SIEM solution. If you change the format of events in CyberTrace, you may also need to update your integration with the SIEM solution.
For ArcSight:
- You may need to update the event formats and actionable fields.
For more information, see Step 3. Configuring CyberTrace for interaction with ArcSight.
For Qradar:
- You may need to add parsing for new fields.
For more information, see Step 5. Retrieving custom event properties.
For RSA NetWitness:
- You may need to specify how new fields are parsed.
For more information, see Step 2. Sending events from Feed Service to RSA NetWitness and RSA NetWitness troubleshooting.
For LogRhythm:
- You may need to specify how new fields are parsed.
For more information, see Adding Kaspersky CyberTrace events.
Specifying the format of detection and alert events
Kaspersky CyberTrace allows you to specify the format of detection and alert events by selecting the needed patterns.
To specify the format of detection events:
- Select the patterns that must appear in detection events.
- Click the Save button at the bottom of the page.
To specify the format of alert events:
- Select the patterns that must appear in alert events.
- Click the Save button at the bottom of the page.
You can specify the format of alert events if the General tenant is selected in the drop-down list with all available tenants, in the upper-left area of the window.
Page topAbout event format patterns
You can use formats and patterns to include specific information into the events generated by Kaspersky CyberTrace.
Formats are strings that determine the format of an event or pattern. Patterns are special wildcards that you can use when specifying formats. A pattern is replaced by actual data when an event is generated.
About alert and detection events
You can specify formats for two types of events generated by Kaspersky CyberTrace:
- Detection events
These are outgoing events that hold information about detected matches with indicators.
For more information about the format of detection events, see "Detection events format" below.
- Alert events
These are outgoing events that inform the event target software about the state of Feed Service.
For more information about the format of alert events, see "Alert events format" below.
Record context format
The %RecordContext% format specifies how context fields must be added to an event. You can specify a format for this pattern in the Records context format field.
You can use the following patterns in the %RecordContext% format:
- %ParamName%
The name of the field in the feed.
- %ParamValue%
The value of the field.
The %RecordContext% format is used in the formats of detection and alert events:
- Detection events
The %RecordContext% pattern determines the format of the context fields passed in a detection event.
For example, if %RecordContext% is
%ParamName%=%ParamValue%, then for a feed with the"Ip"and"Geo"fields, the following string can be produced (note the space symbol between the data of the two fields):"Ip=192.0.2.100 Geo=ru,br,ua,cz,us". - Alert events
The %RecordContext% pattern determines the format of the context fields passed in an alert event.
For more information about information contained in alert fields, see Alert events sent by Kaspersky CyberTrace.
The fields are specific for each type of alert event. For example, if %RecordContext% is
%ParamName%=%ParamValue%, and a feed is updated, the following string can be produced:"feed=Phishing_URL_Data_Feed.json records=200473".
Actionable field context format
The %ActionableFields% format specifies how actionable fields must be added to an event. You can set a separate format for this pattern in the Actionable fields context format field.
You can use the following patterns in the %ActionableFields% format:
- %ParamName%
The name of the actionable field.
- %ParamValue%
The value of the actionable field.
The %ActionableFields% format is used in the format of detection events:
The %ActionableFields% pattern determines the format of the actionable fields passed in a detection event.
For example, if %ActionableFields% is %ParamName%:%ParamValue%, and the cn1 and cn2 fields are specified for the feed, then the following string can be produced: "cn1:Example Device cn2:Example Environment".
Alert events format
You can specify this format in the Alert events format field.
You can use the following patterns in this format:
- %Alert%
The type of the event.
- %Date%
Current date and time in the
Mon DD HH:MM:SSformat. - %RecordContext%
Context of the event, as described in the "Record context format" section above.
The following is an example of the alert events format:
%Date% alert=%Alert%%RecordContext% |
If a feed update event is generated, the example above produces the following event:
Apr 16 09:05:41 alert=KL_ALERT_UpdatedFeed feed=Phishing_URL_Data_Feed.json records=200473 |
Detection events format
You can specify this format in the Detection events format field.
You can use the following patterns in this format:
- %Category%
Category of the detected object.
- Regular expression name
This pattern is a name of the regular expression. It is substituted by a value extracted from the event field that matches a regular expression. For example, if a regular expression has the name
RE_URL, the pattern for it is%RE_URL%, and the generated event holds the value that matched this regular expression. - %MatchedIndicator%
Detected indicator (a URL, hash, or IP address) that caused the event.
- %SourceId%
Event source identifier. This is the name that you specified for the event source on the Matching tab.
The identifier of the preconfigured event source is
Default. - %Confidence%
The level of confidence. This value is taken from the indicator confidence value of a feed that contains matched indicators from the detection event.
- %IndicatorInfo%
The link to the Kaspersky CyberTrace Web page that contains information about the detected indicator.
- %ActionableFields%
Actionable fields, as described in the "Actionable field context format" section above.
- %RecordContext%
Context of the event, as described in the "Record context format section" above.
The following is an example of the OutputSettings > EventFormat element:
%Date% event_name=%Category% source=%SourceId% matchedIndicator=%MatchedIndicator% url=%RE_URL% ip=%RE_IP% md5=%RE_MD5% sha1=%RE_SHA1% sha256=%RE_SHA256% usrName=%RE_USERNAME% indicatorInfo=%IndicatorInfo% confidence=%Confidence%%RecordContext% |
The example above produces the following events:
Apr 16 09:05:41 eventName=KL_Malicious_Hash_MD5 source=ExampleSource matchedIndicator=C912705B4BBB14EC7E78FA8B370532C9 url=- src=192.0.2.4 ip=192.0.2.23 md5=C912705B4BBB14EC7E78FA8B370532C9 sha1=- sha256=- usrName=ExampleUser indicatorInfo=https://127.0.0.1/indicators?value=C912705B4BBB14EC7E78FA8B370532C9 confidence=100 MD5=C912705B4BBB14EC7E78FA8B370532C9 SHA1=8CBB395D31A711D683B1E36842AE851D5D000BAD SHA256=F6E62E9B3AF38A6BF331922B624844AAEB2D3658C4F0A54FA4651EAA6441C933 file_size=2989 first_seen=10.07.2016 23:53 last_seen=13.04.2020 08:08 popularity=1 threat=HEUR:Trojan.Win32.Generic |
Patterns for ArcSight
Feed Service sends service events in the CEF format. The event formats for ArcSight must comply with the requirements of the CEF format.
For detection events, specify the following format:
|
In addition to the general patterns, the detection events format for ArcSight uses the following regular expression patterns referenced by regular expression names:
%DST_IP%—Destination IP address.%DeviceIp%—IP address of the endpoint device where the event occurred.%RE_HASH%—Hash contained in the event.%RE_URL%—URL contained in the event.%Device%—Device vendor.%Product%—Device name.%UserName%—Name of the user that was active on the endpoint device.%Id%—Event identifier.
For alert events, specify the following format:
|
In the format above, 4 (or another value from 1 to 10) is the level (severity) of the alert events from Kaspersky CyberTrace.
Patterns for RSA NetWitness
The values of the detection and alert event formats must correspond to the event formats set in the v20_cybertracemsg.xml file. If you change the formats, edit the v20_cybertracemsg.xml file accordingly.
The following is an example of the detection events format:
|
In addition to the general patterns, the detection events format for RSA Net Witness uses the following regular expression patterns referenced by regular expression names:
%RE_URL%—URL contained in the event.%RE_HASH%—Hash contained in the event.%DST_IP%—Destination IP address.%SRC_IP%—Source IP address.%DeviceIp%—IP address of the endpoint device where the event occurred.%Device%—Device vendor.%DeviceAction%—Action taken by the device.%UserName%—Name of the user that was active on the endpoint device.
Alert events sent by Kaspersky CyberTrace
This section describes alert events that can be generated by Kaspersky CyberTrace.
KL_ALERT_ConfigurationUpdated
This event is generated if Feed Service has reloaded the configuration file.
This event has no context fields.
KL_ALERT_FeedBecameAvailable
This event is generated if a feed that can be used with the current certificate has become available.
This event has the following field:
- feed
Feed name.
KL_ALERT_FeedBecameUnavailable
This event is generated if a feed that is being used with the current certificate has become unavailable.
This event has the following context field:
- feed
Feed name.
KL_ALERT_OutdatedFeed
This event is generated if a feed has not been updated during the specified period.
This event has the following context field:
- feed
Feed name.
KL_ALERT_ServiceUnavailable
This event is generated when the watchdog module has detected that Feed Service has crashed or frozen.
This event has no context fields.
KL_ALERT_ServiceStopped
This event is generated when Feed Service is stopped successfully.
This event has no context fields.
KL_ALERT_ServiceStarted
This event is generated when Feed Service is started successfully.
This event has no context fields.
KL_ALERT_UpdatedFeed
This event is generated when a feed is updated and loaded by Feed Service. This means that new indicators from the feed can be used in the matching process. Please note that these indicators may be added to the database later, as they are loaded asynchronously.
This event has the following context fields:
- feed
Feed name.
- records
The number of records loaded from the feed.
KL_ALERT_FailedToUpdateFeed
This event is generated when Feed Service fails to load a new feed (for example, due to the limitation on the number of indicators that are imposed by the license key) and continues using an old feed.
This event has the following context fields:
- feed
Feed name.
- error
Error message from Feed Utility or the text "
Error while applying feed <FeedName>".
KL_ALERT_LicenseExpires
This event is generated to inform you that the license key that is being used will expire in less than 30 days.
This event has the following context fields:
- license_name
Name of the license key.
- expiration_date
Expiration date of the license key.
KL_ALERT_LicenseExpired
This event is generated when a current license key has expired.
This event has the following context fields:
- license_name
Name of the license key.
- expiration_date
Expiration date of the license key.
KL_ALERT_EPSLimitExceeded
This event is generated when the limit on the number of processed events per second (EPS) imposed by the licensed key or licensing level has been exceeded.
This event has the following context fields:
- current_eps
Actual number of EPS that arrive in Feed Service.
- license_limit_eps
Limit on the number of EPS that is imposed by the license key or licensing level.
KL_ALERT_EPSHardLimit
This event is generated when Feed Service limits the number of events processed per second to the maximum number of events for the current license key or licensing level. The limit applies regardless of the number of incoming events.
- license_limit_eps
Limit on the number of EPS that is imposed by the license key or licensing level.
KL_ALERT_LicenseChanged
This event is generated when Kaspersky CyberTrace starts to use another license key or licensing level.
This event has the following context fields:
- license_name
Name of the license key.
If no license key is used, this context field is not included.
- expiration_date
Expiration date of the license key.
If no license key is used, this context field is not included.
- licensing_level
Licensing level of the key, if a license key is used.
Licensing level, if a license key is not used.
KL_ALERT_RetroScanCompleted
This event is generated when the retrospective scan task succeeded.
This event has the following context fields:
- iocs_rescanned
Number of scanned indicators.
- iocs_detected
Number of detected indicators.
- retroscan_report
Link to the result of the retrospective scan.
This field is absent if the value of the iocs_detected field is 0.
KL_ALERT_RetroScanError
This event is generated when the retrospective scan task failed.
This event has the following context field:
- error
Short text error description.
KL_ALERT_RetroScanStorageExceeded
This event is generated when the limit on the size of the saved events has been exceeded.
This event has the following context field:
- storage_size_limit
Limit on the size of the saved events.
KL_ALERT_FreeSpaceEnds
This event is generated when the available disk space becomes low.
This event has the following context field:
- msg
Amount of disk space that is still available for the indicator database.
The message has the following format: "Free space left: %FreeSpace% Mb", where %FreeSpace% is the remaining number of MB available for the indicator database.
KL_ALERT_IndicatorsStoreLimitExceeded
This event is generated when the limit on the size of the saved indicators has been exceeded.
This event has the following context fields:
- current_indicators_count
Current number of indicators.
- license_limit_indicators
Limit on the number of indicators that is imposed by the license key.
KL_ALERT_IndicatorsStoreHardLimit
This event is generated when Kaspersky CyberTrace limits adding and updating of indicators.
This event has the following context fields:
- license_limit_indicators
Limit on the number of indicators that are imposed by the license key.
- msg
Message that new indicators cannot be added to the database due to the limitation on the number of indicators that is imposed by the license key.
User settings
You can manage the user accounts settings by selecting the Settings tab, and then the Users tab.
The Users tab contains the following tabs:
- Local accounts
On this tab, you can add a new user account, and change or delete existing user accounts.
- LDAP
On this tab, you can provide the option to use domain user accounts for authentication in Kaspersky CyberTrace Web.
Working with local accounts
Kaspersky CyberTrace supports multiple users mode. On the Local accounts tab, you can add a new user account, and change or delete existing user accounts.
The form for managing user accounts settings can be disabled due to restrictions imposed by the licensing level. In this case, only the admin account will be available.
To add a new account:
- Click the Add new user button.
The New user window opens.
- Enter the account login in the Login field.
If you are using domain authentication along with local accounts, do not create local accounts with the names defined for existing domain accounts.
- Enter the full name in the Full name field.
You can leave this field blank.
- Set your password in the Password field and repeat it in the Confirm password field.
Your password must be from six to 16 characters long and must contain at least one lowercase letter, one uppercase letter, and one special character.
- Choose your role in the drop-down list:
- Analyst. Analysts have access to all features of Kaspersky CyberTrace, except those reserved for Administrators.
- Administrator. Administrators can manage user accounts and configure Kaspersky CyberTrace.
The default role is Analyst.
Administrators can download logs that may contain data considered private, security-related, or sensitive. In addition, administrators can browse the search results for all users.
- Click OK to create an account.
To edit a user:
- Click the button next to the user that you want to edit.
The Change user window opens.
- Edit one of the fields.
- Click OK.
To delete a user:
- Click the
 button next to the user that you want to delete.
The Delete user window opens.
- Click Delete.
- Click Yes to confirm that you want to delete the selected user.
Configuring LDAP authentication
Kaspersky CyberTrace supports LDAP user authentication to allow logging on as a domain user. This section explains how to configure this type of authentication by using Kaspersky CyberTrace Web.
Kaspersky CyberTrace supports the use of Active Directory only if the domain controller is running Windows. The use of Active Directory with Linux-based domain controllers is possible, but not guaranteed.
The LDAP section allows you to perform the following actions:
- Enable LDAP authentication
- Test the connection to the LDAP server
- Specify connection settings
- Configure accounts filtering
Enabling LDAP authentication
To enable LDAP authentication,
Click the LDAP auth enabled toggle button.
The LDAP server will now be used for user authentication.
When LDAP authentication is enabled, you still can interact with Kaspersky CyberTrace under a local user account.
Testing the connection to the LDAP server
Go through the procedure below to make sure that a connection to the LDAP server is established.
To test the connection to the LDAP server:
- Click the Test connection with LDAP link.
The Test connection with LDAP window opens.
- Specify the following settings:
- User name for test connection
- User password for test connection
- Click Test.
A connection test can be performed only if you specified all the necessary settings for connecting to the server.
Connection settings
In the Connection settings section of the LDAP tab, you can specify the following settings:
- IP address or FQDN (fully qualified domain name) and port of the LDAP server
This setting is stored in the
AuthenticationServer > ConnectionStringelement of the kl_feed_service.conf file. - SSL-secured connection
You can enable the use of a secure connection to the LDAP server by using Kaspersky CyberTrace Web.
This setting is stored in the
useEncryptionattribute of theAuthenticationServer > ConnectionStringelement of the kl_feed_service.conf file - Path to the LDAP database
The path to the database containing user accounts that can access Kaspersky CyberTrace.
Accounts filtering
The Accounts filtering section contains filtering rules for administrator and analyst accounts.
You can configure the following properties:
- Account format
You can select one of two formats:
- User Principal Name
If this option is selected, users must provide a user name that is not an email address when performing authentication (for example user, but not user@domain.com).
- SAM Account Name
If this option is selected, users must provide a user name in the following format when performing authentication: Domain\User.
- User Principal Name
- Administrator accounts filter
The filter for LDAP user accounts that defines which users must be assigned the Administrator role depending on their common name in Active Directory.
If this value is not specified, all users who login using LDAP authentication and pass the analyst account filter will be assigned the Analyst role.
This setting is stored in the
AuthenticationServers > AdministratorAccountsFilterelement of the kl_feed_service.conf file. - Analyst account filter
The filter for LDAP user accounts that defines which users must be assigned the Analyst role depending on their common name in Active Directory.
If this value is not specified, all users who login using LDAP authentication and do not pass the administrator account filter will be assigned the Analyst role.
This setting is stored in the
AuthenticationServers > AnalystAccountsFilterelement of the kl_feed_service.conf file.As an example, in the figure below the filters are configured so that the users who are members of the
Adminsgroup will be assigned the Administrator role, and the users who are members of either theOperatorsor theAnalystsgroup will be assigned the Analyst role.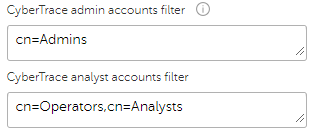
Example of accounts filters
If the AdministratorAccountsFilter and AnalystAccountsFilter elements of the kl_feed_service.conf file contain values, and the user that is trying to log in is not included in any of the specified groups, Kaspersky CyberTrace will return an error and deny access to the web user interface for this user.
Logging settings
You can manage the logging settings in the CyberTrace web user interface by selecting the Settings tab, and then the Logging tab.
Under Logging settings, you can set the following settings:
- Log directory—Directory in which log files are to be stored
- Log level
The following values are possible:
- None
Logging is turned off.
Corresponds to the
nonlog level in the kl_feed_service_log.conf configuration file. - Error
Only errors are logged.
Corresponds to the
errlog level in the kl_feed_service_log.conf configuration file. - Info
Errors and information messages are logged.
Corresponds to the
inflog level in the kl_feed_service_log.conf configuration file. - Debug
All messages are logged
Corresponds to the
anylog level in the kl_feed_service_log.conf configuration file.
- None
- Maximum log size (MB)—In megabytes
- Delete old logs when Feed Service starts—Option of removing log files created by previous sessions
- Write to syslog—Option of whether logging must be performed by the syslog daemon
If this option is selected, all the other settings are ignored.
This option is available only on Linux systems.
For information about the contents of log files, see section "Feed Service logging", subsection "Log file contents".
Page topLicensing settings
You can manage the Kaspersky CyberTrace licensing in the CyberTrace Web by selecting the Settings tab, and then the Licensing tab.
On the Licensing tab, you can view information about license keys and perform the following actions:
- Add a new license key
- Remove a license key
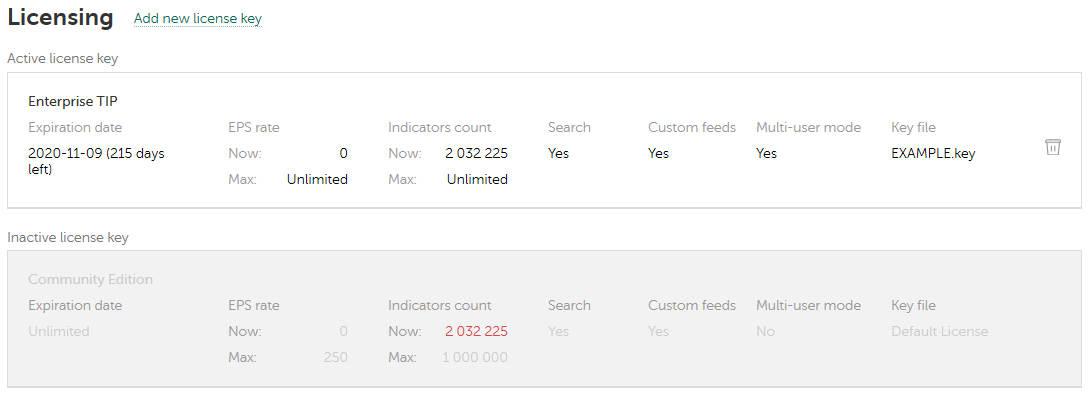
Licensing tab
The Licensing tab contains a list of license keys. The active license key is highlighted, and all inactive keys are unavailable (dimmed).
For each license key, the following information is available:
- Licensing level of the key
- Expiration date of the key
- Limit on the events per second (EPS) number
- The current number of indicators loaded into Kaspersky CyberTrace
This item displays the number of unique indicators for all enabled suppliers. Also note that if an indicator is present in multiple suppliers, duplications of this indicator are discarded from the total number.
- The maximum number of indicators allowed with this licensing level
- Information whether the search feature in CyberTrace Web is available
- Information whether custom feeds can be used
- Information whether multiuser mode is available
- License key file name
About the licensing
This section describes the licensing levels of Kaspersky CyberTrace.
Commercial licensing levels and Community Edition
The Kaspersky CyberTrace licensing policy provides two licensing level types:
- Community Edition
This is a limited licensing level that can be used without a license key. This licensing level does not have an expiration date.
If no license key is installed, the Community Edition licensing level is used.
The Community Edition licensing level has the following limitations:
- Multi-user mode is not available. Kaspersky CyberTrace has a single account with the Administrator role that can perform all operations.
- No more than 250 events per second are processed.
- No more than 1,000,000 records can be loaded from all feeds.
- Commercial licensing levels
These licensing levels are available with a license key and are suited for different enterprise scenarios.
License keys are created by Kaspersky specialists. To obtain a license key, contact your technical account manager (TAM).
Information contained in the license key
A license key is a sequence of bits that you can apply to use a certain licensing level of Kaspersky CyberTrace.
A license key contains the following information:
- Licensing level
- Expiration date
- Limit on events per second (EPS)
- Limit on the total number of indicators that can be loaded from Kaspersky Threat Data Feeds
In addition, a license key lists available features: the Search feature, use of third-party feeds, multi-user mode, multitenancy mode, and IOCs export.
License keys are stored in the %service_dir%/httpsrv/lic directory. You can manage license keys by using the Settings > Licensing tab.
Active and additional license keys
A license key may be active or additional.
An active license key is a license key that is currently used by Kaspersky CyberTrace. Kaspersky CyberTrace cannot have more than one active license key.
An additional license key is a license key that is not currently in use. The additional license key automatically becomes active when the current active license key expires. An additional license key can be added only if an active license key has already been added.
Kaspersky CyberTrace chooses an active license key to use, based on the expiration date of the license key. If there is a single license key that has not expired, this key is used as an active key. If there are several license keys that have not expired, the license key with the nearest expiration date is chosen. If all keys have expired, the Community Edition licensing level is used.
License key expiration notifications
Kaspersky CyberTrace sends alerts and generates events when license keys expire or are about to expire.
If less than 30 days are left until the key expires, Kaspersky CyberTrace displays an alert in CyberTrace Web and generates a KL_ALERT_LicenseExpires event.
After the license key expires, Kaspersky CyberTrace displays an alert in CyberTrace Web and generates a KL_ALERT_LicenseExpired event. Afterward, Kaspersky CyberTrace automatically searches for an additional license key and makes it active. If there are no additional license keys, Kaspersky CyberTrace changes its licensing level to Community Edition, displays an alert in CyberTrace Web, and generates a KL_ALERT_LicenseChanged event.
Licensing and DMZ
Kaspersky CyberTrace does not send any licensing information to Kaspersky. Licensing functionality works in scenarios involving a DMZ.
Page topLimitations imposed by license keys
This section describes limitations that are imposed on the Kaspersky CyberTrace functionality by license keys of different licensing levels.
Limit on events per second (EPS)
For the Community Edition licensing level, Kaspersky CyberTrace processes no more events per second than permitted by the licensing level.
Several commercial licensing levels have EPS limits specified in the licensing key. Kaspersky CyberTrace limits EPS for these licensing levels in two stages.
At the first stage, if the EPS limit is exceeded at any point in time, Kaspersky CyberTrace displays alerts in Kaspersky CyberTrace Web and generates the KL_ALERT_EPSLimitExceeded event. All events above the EPS limit continue to be processed.
At the second stage, if the EPS limit was continuously exceeded for a period of seven days, the limit takes effect. Kaspersky CyberTrace displays alerts in Kaspersky CyberTrace Web and generates the KL_ALERT_EPSHardLimit event. Kaspersky CyberTrace starts to process events within the limit imposed by the license key. After you change the license key or start to process no more events than are specified in the licensing key, this limitation ceases to apply.
Limit on the number of indicators
If the license key or licensing level sets a limit on the total number of indicators, Kaspersky CyberTrace reads, in total, no more records from all the feeds than are permitted by the license key or licensing level.
For the Community Edition licensing level, if the number of indicators exceeds a limit, Kaspersky CyberTrace sends the KL_ALERT_IndicatorsStoreHardLimit service event and then, through its Web UI, displays a notification that there is a limitation on the adding and updating of indicators. When the KL_ALERT_IndicatorsStoreHardLimit event is generated, Kaspersky CyberTrace stops reading new records.
For other licensing levels, if the number of indicators exceeds a limit, Kaspersky CyberTrace sends the KL_ALERT_IndicatorsStoreLimitExceeded service event, and then displays a notification through its Web UI. This notification informs that Kaspersky CyberTrace will set a restriction on the adding and updating of indicators after five days. Then, if the total number of indicators continuously exceed a limit for this period, Kaspersky CyberTrace sends the KL_ALERT_IndicatorsStoreHardLimit service event and displays another notification informing that the limitation has taken effect. When the KL_ALERT_IndicatorsStoreHardLimit event is generated, Kaspersky CyberTrace stops reading new records.
After you change the license key or start to process no more indicators than are specified in the licensing key, this limitation ceases to apply.
Limit on the use of custom feeds
If the license key does not allow the use of custom feeds, only Kaspersky Threat Data Feeds can be used. OSINT feeds cannot be used in this case.
Other limitations
The following features can be disabled by the license key or licensing level:
- Search feature in Kaspersky CyberTrace Web
- Multi-user mode
If multi-user mode is disabled, you can sign in under the
adminaccount only. This user account has the Administrator role.
Adding a license key
You can add an active key or an additional license key to Kaspersky CyberTrace by using Web UI.
To add a license key:
- In Kaspersky CyberTrace Web, select the Settings tab, and then the Licensing tab.
- Click Add new license key.
The Add a license key window opens.
- Click Browse.
Your browser opens a window where you can select a file.
- Select a license key.
License keys are created by Kaspersky specialists. To obtain a license key, contact your technical account manager (TAM).
- Confirm the selection.
- In the Add a license key window, click Add.
Kaspersky CyberTrace will import the selected key. If there is no active key, the imported key will be selected as an active key.
Deleting a license key
You can delete license keys by using Kaspersky CyberTrace Web UI.
To delete a license key:
- In Kaspersky CyberTrace Web, select the Settings tab, and then the Licensing tab.
- Click the Delete icon (
 ) for the license key that you want to delete.
The Delete the license key window opens.
- Click Delete to delete the license key.
Confirmation of the deletion will be displayed.
- Click Close.
Tenants settings
Kaspersky CyberTrace supports a multi-tenant architecture that allows you to manage tenants. A tenant is a client-specific set of configuration parameters. By default, Kaspersky CyberTrace uses a General tenant that provides the overall settings. You can create or edit the Kaspersky CyberTrace tenants in CyberTrace Web by selecting the Settings tab, and then the Tenants tab.
On the Tenants tab, you can view information about the tenants that are used in Kaspersky CyberTrace and perform the following actions:
- Add a new tenant
- Edit a tenant configuration
- Delete a tenant
Adding tenants
To add a tenant:
- Click the Add new tenant link.
The New tenant window opens.
- Specify a name for the new tenant in the Tenant field.
- Specify a description for this tenant in the Description field.
- Select a SIEM.
You can select a SIEM supported by Kaspersky CyberTrace or a custom one (a non-supported SIEM solution).
This SIEM will be used in the tenant for sending events to CyberTrace.
Depending on the selected SIEM, CyberTrace will specify regular expressions, detection events, and service events that are used in integration with this solution.
For the full list of supported SIEMs, see subsection "Supported SIEM solutions" below.
- Specify connection parameters specific for the tenant that Kaspersky CyberTrace will use for incoming events:
- Select what type of connection you want to use.
- In the IP address and Port fields, specify an IP address and port.
- In the UNIX socket field, specify a UNIX socket.
- Specify an IP address and port specific for the tenant that Kaspersky CyberTrace will use for outgoing events.
- Click Save.
Editing a tenant configuration
To edit a tenant configuration:
- Click the Edit button next to the tenant that you want to edit.
- Edit the tenant configuration:
- Tenant name
You cannot change the tenant name for the General tenant.
- Description
- Tenant name
- Click Save.
Deleting tenants
To delete a tenant:
- Click Delete next to the tenant that you want to delete.
- Confirm that you want to delete the tenant.
Supported SIEM solutions
Kaspersky CyberTrace supports integration with several SIEM solutions. Thus, CyberTrace uses a number of preset settings for each SIEM, such as settings for parsing events and event format settings (for detection and service events).
The following SIEM solutions are supported:
- Splunk
- ArcSight ESM
- RSA NetWitness
- IBM QRadar
- LogRhythm
- Kaspersky Unified Monitoring and Analysis Platform
Indicators export settings
You can export information related to the indicators to a CSV file. This report contains data about indicators exported from the indicator database and filtered by specified rules. This section explains how to create an export task that can be published as a report file in the CSV format and how to configure the data that must be included in this report.
The Indicators export tab displays the Indicators export tasks list with existing export tasks and allows you to do the following:
- Add a new export task.
- Manage existing export tasks.
You can perform the following actions with existing export tasks:
- Edit existing export tasks.
- Delete existing export tasks.
- Enable the scheduled task that regularly updates the indicators export task.
- Launch the export task.
Adding a new export task
To create a new export task:
- Click Add task.
The Add indicators export task window opens.
- In the Task properties section, specify the following settings for every field:
- Task name
The name of the export task.
- Maximum records
You can specify the maximum number of indicators that can be included in the report.
The maximum possible value is
50000. - Export every
Update frequency (in hours) for generating a report.
- Delimiter
The delimiter for splitting of fields in the report file. By default, this value is
';'.
- Task name
- In the Limit access to specified credentials section, specify the following information for every field:
- Use authorization to download indicators export
Specify this setting if you want to use authentication for downloading the indicators export.
If this setting is used, specify the credentials:
- User name
User name that must be used when requesting a report.
This user name is intended only for access to a specific report and it is not the same as the Kaspersky CyberTrace user account.
- Password
Password that must be used when requesting a report.
- User name
- Use authorization to download indicators export
- In the Fields to export section, specify filtering rules for the fields that you want to export:
- Field name
Name of the field to which filtering rules are applied and/or that must be exported.
- Condition
Filtering condition that is applied to the field.
- Value
Filtering criteria for the field. This value must meet the requirements described in the "Working with indicators" section.
- Include
Specify this setting if you want to include the field in the report file.
By default, this field must be included in the report file.
- Output name
Name of the output field which must contain the values from the exported field.
In the CSV report file, output fields have the same order that you specify through Kaspersky CyberTrace Web. If you change the position of the export rule to increase or decrease its priority, the new priority level will be retained in the CSV report file.
- Field name
- If necessary, specify the rules for sorting data in the Sort conditions section:
- Field name
Specify the field you want to sort.
- Direction
You can sort your values in ascending or descending order. This order is retained in the CSV report file.
- Field name
- Click Next.
The Export preview window opens. This window displays a table with an example of an indicators export.
- Click Add to apply the specified settings and add this task to the Indicators export tasks list.
If you want to change the setting specified in the previous step, click Back.
If you want to reset all the settings and close the window, click Cancel.
Managing an existing export task
To edit an existing export task:
- In the Indicators export tasks list, locate the task that you need, and then click Edit.
- Change the settings as described in the instructions above.
To delete an existing export task:
In the Indicators export tasks list, locate the task that you need, and then click Delete.
To enable scheduled indicators export:
Click the Enable scheduled export task toggle button.
If this setting is turned off, you cannot access reports that were created earlier.
To launch an export task:
In the Indicators export tasks list, locate the task that you need, and then click Launch export.
After that, the report with the exported indicators becomes available for download at the following address:
https://%CyberTrace_WebAddress%/reports/%iocexport_name%
where %iocexport_name% is the name of the specified export task.
Retrospective scan settings
Kaspersky CyberTrace allows you to save events containing indicators that are not detected, and then perform a retrospective scan of these events. This section explains how to configure Kaspersky CyberTrace for using the retrospective scan.
The Retrospective scanning tab allows you to do the following:
- Enable or disable the retrospective scan.
- View the current size of saved events.
- Remove saved events.
Saved events cannot be removed when the retrospective scan is in progress. If you want to disable the retrospective scan and removed the saved events, you must wait until the current retroscan task is finished.
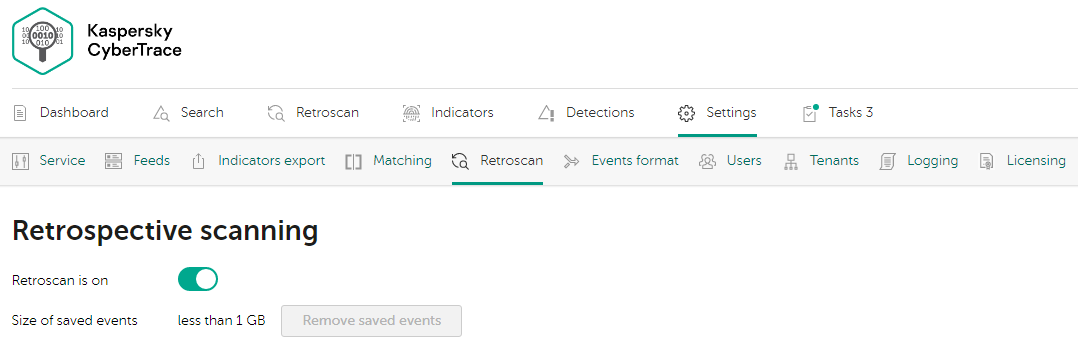
Retrospective scanning tab
- On the General settings tab, manage the following settings:
- Set the frequency of the scheduled retrospective scan task or disable the scan on schedule. If 1 month is selected, retrospective scan starts every 30 days.
- Enable or disable the size limit for events that must be saved for the retrospective scan.
- Set the maximum size of events (in gigabytes) that must be saved for the retrospective scan.
- Set how long (in days) the events used for the retrospective scan must be stored.
- Set how long (in days) the results of the retrospective scan must be stored.
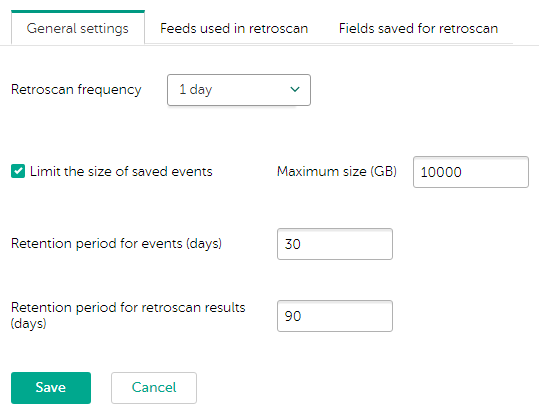
General settings tab
- On the Feeds used in retroscan tab, enable or disable feeds that must be used in the retrospective scan.
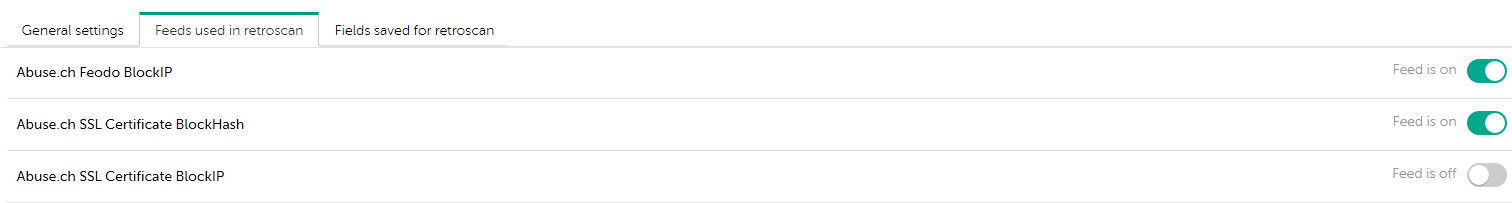
Feeds used in retroscan tab
- On the Fields saved for retroscan tab, configure the following settings:
- Enable or disable saving events related to a specific tenant for use in the retrospective scan.
If you exclude a tenant from the retrospective scan, the regular expressions contained in this tenant become unavailable for selection.
- Select regular expressions contained in a tenant for use in the retrospective scan.
You must select at least one regular expression.
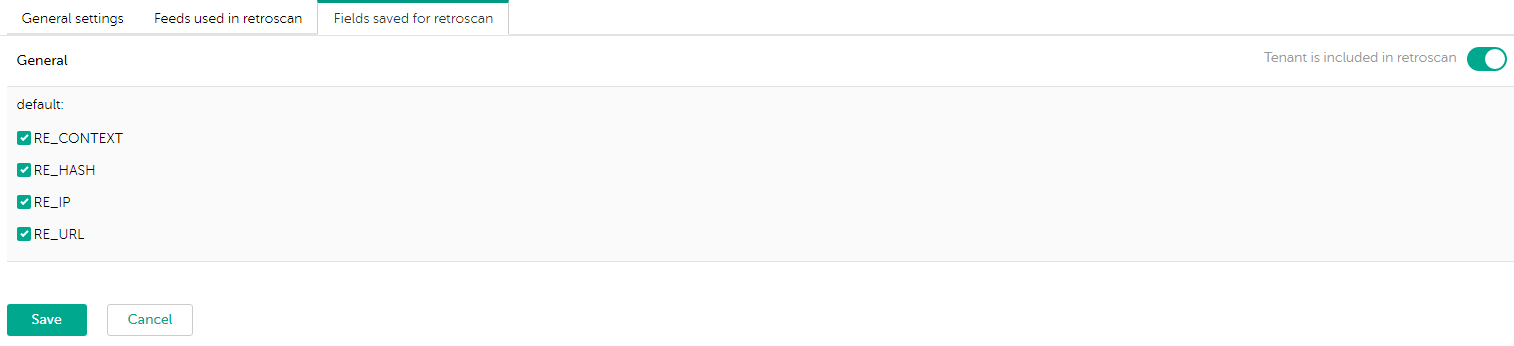
Fields saved for retroscan tab
- Enable or disable saving events related to a specific tenant for use in the retrospective scan.
Feed Service Guide
This section explains how Feed Service works, how to configure it, and how to manage it from the command line or by using a script.
About Feed Service
Feed Service is one of the components of Kaspersky CyberTrace. It runs as a service and works as follows:
- Feed Service listens on a specified port for incoming events.
- Feed Service matches indicators in received events against those in the feeds that are used.
- Feed Service generates events in the specified format that contains detected indicators on the basis of the incoming events and the feed records involved in the detection process.
- Feed Service sends the generated events to the specified address and port.
Managing Feed Service by using systemd (Linux)
You can manage Feed Service by using systemd.
You can use all standard systemd commands to manage Feed Service.
Checking the service status
To check the status of Feed Service, use the following command:
systemctl status cybertrace.service
Starting, stopping, restarting the service
To start Feed Service, use the following command:
systemctl start cybertrace.service
Feed Service begins to receive events only after it has loaded the feeds into memory and has sent the KL_ALERT_ServiceStarted event.
To stop Feed Service, use the following command:
systemctl stop cybertrace.service
To restart Feed Service, use the following command:
systemctl restart cybertrace.service
Adding and removing the service from the list of services loaded on boot
By default, Feed Service is loaded on boot. You can change this behavior with the following commands.
To add Feed Service to the list of services loaded on boot, use the following command:
systemctl enable cybertrace.service
To remove Feed Service from the list of services loaded on boot, use the following command:
systemctl disable cybertrace.service
Managing Feed Service using the script (Windows)
The %service_dir%\bin\kl_control.bat file is a script for managing Feed Service.
Command-line options
The script supports the following command-line options:
start—Starts Feed Service and the watchdog Windows service.The script prints the information about whether this operation succeeded or failed.
Feed Service begins to receive events only after it has loaded the feeds into memory and has sent the KL_ALERT_ServiceStarted event.
stop—Stops Feed Service and the watchdog Windows service.The script prints the information about whether this operation succeeded or failed.
restart—Restarts the services of Kaspersky CyberTrace: stops them and starts them again.The script prints the information about whether this operation succeeded or failed.
status—Prints the information about the status of the services of Kaspersky CyberTrace.reloaddb—Instructs Feed Service to reload the feeds it is using.help—Prints the Help information: how to use the kl_control.bat script.
You can use only one option at a time.
The script can also be launched without parameters. In this case, it prints the list of the available options and their descriptions.
Example
The following command starts Feed Service:
|
Managing Feed Service from the command line (Linux)
You can run the Feed Service binary file from the command line.
We recommend that you use systemd to manage Feed Service. Running Feed Service from the command line is intended for troubleshooting purposes.
The binary file uses the flags described in the following table.
Flags for kl_feed_service
Flag |
Value |
Description |
|
Path to the configuration file |
Path to the configuration file. You can use absolute or relative paths. If a relative path is specified, it is calculated relative to the Feed Service binary file. |
|
|
Runs Feed Service in watchdog mode. |
|
|
Prints the Feed Service version. If flags except |
|
Path to the PID file. |
Path to the PID file. You can use absolute or relative paths. If a relative path is specified, it is calculated relative to the Feed Service binary file. This flag is optional. By default, PID file is created in a directory with the Feed Service binary file. |
|
|
Prints the information about flags that can be used with kl_feed_service. If other flags are specified, they will be ignored. |
Example
The following command runs Feed Service in watchdog mode and specifies serv.conf as the configuration file.
./kl_feed_service -w -c "./serv.conf" |
Managing Feed Service from the command line (Windows)
You can run the Feed Service binary file from the command line.
We recommend managing Feed Service by using the script. Running Feed Service from the command line is intended for troubleshooting purposes.
The binary file uses the flags described in the following table.
Flags for kl_feed_service.exe
Flag |
Description |
|
Adds Feed Service to the list of Windows services. |
|
Removes Feed Service from the list of Windows services. |
|
Starts Feed Service as a Windows service. Note that only Service Control Manager can run kl_feed_service.exe with this flag. If the user tries to run kl_feed_service.exe with this flag, an error occurs. |
|
Prints the Feed Service version and exits. If flags except |
|
Prints the information about flags that can be used with kl_feed_service.exe and exits. |
If no flag is specified, the kl_feed_service.exe program prints the list of available flags to the screen.
Feed Service uses the configuration file that resides in the same folder as the kl_feed_service.exe binary file.
Page topFeed Service configuration reference
This section describes the configuration file of Feed Service.
We recommend that you configure Feed Service by using the Settings > Service tab. Use this section only for configuration that cannot be done from the web interface.
About the configuration file (Feed Service)
Feed Service reads settings from a configuration file.
Editing the configuration file
If the configuration file is absent or does not follow the rules specified in this section, Feed Service does not start and prints an error message.
To avoid potential issues, make a backup copy of the Feed Service configuration file before you make any changes in the file. If Kaspersky CyberTrace does not work properly after you have reconfigured Feed Service, replace the configuration file with its backup copy.
Applying changes made to the configuration file
You have to reload the configuration file or restart Feed Service after you edit the configuration file for the changes to take effect.
You can apply changes made to certain elements of the configuration file by reloading the configuration file but without restarting Feed Service.
These elements include:
InputSettings > RegExpsFeedsOutputSettings > RecordFieldContextFormatOutputSettings > AlertFormatOutputSettings > EventFormat
To reload the configuration file without restarting Feed Service,
Run the script for managing Feed Service with the reloadconfig option.
To apply changes made to other elements of the configuration file, you have to restart Feed Service.
To restart Feed Service,
Run the script for managing Feed Service with the restart option.
Configuration file location (Linux)
In Linux, the configuration file used by Feed Service can be specified in the following ways:
- When Feed Service is started from the command line, the path to a configuration file can be specified as an argument. By default, this path is
../etc/kl_feed_service.conf. - When Feed Service is managed using the script, the path to the configuration file is specified in the script parameters. By default, this path is
%service_dir%/etc/kl_feed_service.conf.
Configuration file location (Windows)
The configuration file used by Feed Service is named kl_feed_service.conf and resides in the same directory as the Feed Service binary file.
Case sensitivity
All the names used in the configuration file (for example, pattern names or feed fields) are case-sensitive.
Using special characters
To use special characters (for example, an ampersand or angle brackets) in regular expressions and other parameters, enclose the text of the elements in a CDATA section.
The following example uses braces around parameters:
<RecordFieldContextFormat><![CDATA[{%ParamName%=%ParamValue%}]]></RecordFieldContextFormat> |
EULA
Specifies whether the terms of the End User License Agreement (EULA) were accepted by a user.
Attributes
This element has no attributes.
Possible values
This element has the following possible values.
EULA element possible values
Value |
Description |
|---|---|
|
The terms of the End User License Agreement (EULA) were accepted by a user. |
|
The terms of the End User License Agreement (EULA) were not accepted by a user. In this case, Kaspersky CyberTrace cannot be used. |
Example
The following is an example of a EULA element.
<EULA>accepted</EULA> |
IndicatorDatabaseSettings
Defines the indicator database settings.
Path
IndicatorDatabaseSettings
Attributes
This element has no attributes.
Nested elements
This element is a container for the following nested elements:
- ConnectionString
Specifies the IP address and port that will be used for accessing the indicator database.
For more information about this element, see the "IndicatorDatabaseSettings > ConnectionString" section below.
IndicatorDatabaseSettings > ConnectionString
This element must contain a string with an IP address and a port. See the example below.
This element is mandatory.
Example
The following is an example of this element.
<IndicatorDatabaseSettings> <ConnectionString>127.0.0.1:9200</ConnectionString> </IndicatorDatabaseSettings> |
Domains
Contains configuration for tenants.
Path
Domains
Attributes
This element has no attributes.
Nested elements
This element is a container for the following nested element:
Example
The following is an example of this element.
<Domains> <Domain name="Example Domain"> ... </Domain> <Domain name="Example Domain 2"> ... </Domain> </Domains>
|
Domain
Defines configuration for a single feed in a tenant.
Path
Domains > Domain
Attributes
This element has the following attributes.
Domain element attributes
Attribute |
Description |
|---|---|
|
Tenant name |
Nested elements
This element is a container for the following nested elements:
- Description
Tenant description
This element is optional.
- InputSettings
Input connection settings specific for this tenant. See InputSettings.
- OutputSettings
Output connection settings specific for this tenant. See OutputSettings.
This section is for a specific tenant. It cannot have AlertConnectionString and AlertFormat as nested elements.
- Feeds
Feed settings for the feeds used in this tenant.
For more information about this element, see the Domain > Feeds section below.
Domain > Feeds
Feed settings for the feeds used in the tenant.
This element is a container for the following nested element:
- Feed
Settings for a specific feed in a tenant.
Example
The following is an example of this element.
<Domain name="CustomDomain"> <Description>Custom domain description</Description> <InputSettings> ... </InputSettings> <OutputSettings> ... </OutputSettings> <Feeds> ... </Feeds> </Domain> |
Domain > Feeds > Feed
Defines configuration for a single tenant.
Path
Domains > Domain > Feeds > Feed
Attributes
This element has the following attributes.
Feed element attributes
Attribute |
Description |
|---|---|
|
Feed name. Must correspond to the name of a feed in the Feeds > Feed element. |
|
Specifies if the feed is used in the tenant. The feed must be enabled in the corresponding Feeds > Feed element to be used in a tenant. If the feed is enabled in the tenant, the value is If the feed is disabled in the tenant, the value is |
Nested elements
This element is a container for the following nested element:
- ActionableFields
Actionable fields for this feed in this tenant.
The specified actionable fields replace actionable fields that are defined for this feed in the Feeds > Feed > ActionableFields element (if such fields are defined).
This element is optional.
For more information, see Feeds > Feed > ActionableFields.
Example
The following is an example of this element.
<Feed feedname=ExampleFeed used="true"> <ActionableFields> <ActionableField name="ExampleField" output_name="ExampleOutputField"/> ... </ActionableFields> </Feed> |
InputSettings
Contains input settings for the General tenant.
This element defines the IP address and port that Feed Service will listen on for incoming events, normalizing rules for processing the events, and regular expressions for parsing the events.
Path
InputSettings
Attributes
This element has no attributes.
Nested elements
This element is a container for the following nested elements:
- RegExps
Contains Boost regular expressions that are used to parse incoming events originating from different sources.
- ConnectionString
Specifies the IP address and port (or the Windows-named pipe) that the service will listen on for incoming events.
- EventDelimiter
Specifies the rule for the splitting of incoming events,
Example
The following is an example of this element.
<InputSettings> <RegExps> ... </RegExps> <ConnectionString>0.0.0.0:9999</ConnectionString> </InputSettings> |
RegExps
Contains Boost regular expressions that are used to parse incoming events originating from different sources.
Path
InputSettings > RegExps
Attributes
This element has no attributes.
Nested elements
This element is a container for the following nested element:
- Source
Contains parameters for a specific event source.
Example
The following is an example of this element.
<RegExps> <Source id="default"> ... </Source> <Source id="ExampleSource1"> ... </Source> <Source id="ExampleSource2"> ... </Source> </RegExps> |
Source
Contains parameters for a specific event source.
The regular expressions and event normalizing rules specified in the configuration file are grouped by event sources that are represented by Source elements. Usually these event sources are devices that issue events, which afterward are checked by Feed Service. Every Source element contains a set of rules. There can be one or more Source elements in the InputSettings > RegExps element.
Rules workflow
The way Feed Service chooses rules from different Source elements is described in the following flow chart.
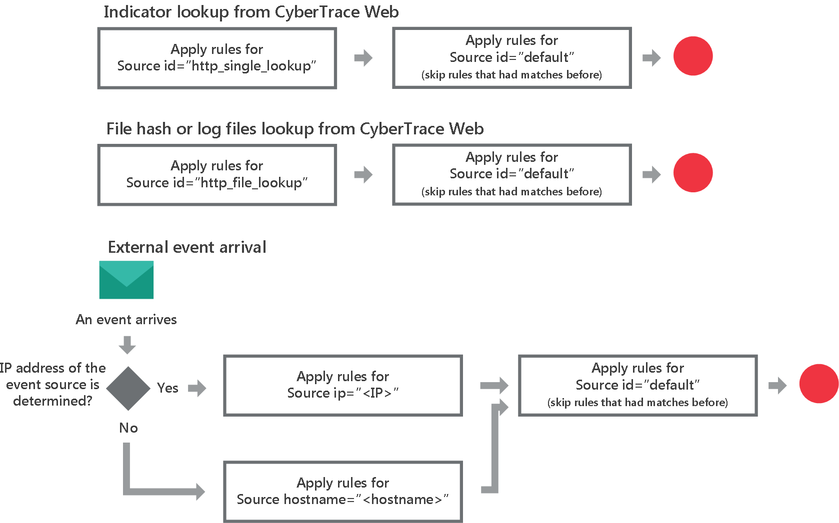
Choosing a rule
Note that event normalizing rules are applied first and regular expressions are applied afterwards.
The regular expressions of the default event source for finding URLs, IP addresses, and hashes are universal; that is, they can be used for parsing events issued by most devices. They can be used for parsing events that contain multiple URLs, but cannot be used, for example, for parsing events that contain URLs with no protocol specified. The use of universal regular expressions lowers the performance of Feed Service, compared to using device-specific regular expressions. Also, the universal regular expressions do not handle the dispersal, in an event, of different parts of a URL (for example, the host and the path). The universal regular expressions for finding hashes can extract symbol sequences that actually are not hashes.
Special event sources
There must be an event source with the default identifier (<Source id="default">). Rules of the default event source have lower priority than rules specific to the event source. Rules specific to the event source are applied first. Rules of the default event source are applied next. If a rule specific to the event source and a rule of the default event source have the same name, the rule of the default event source is applied only if the rule specific to the event source had no matches.
There are two special event sources that you can use: http_single_lookup (<Source id="http_single_lookup">) and http_file_lookup (<Source id="http_file_lookup">).
The rules of the http_single_lookup event source are used when single values are searched for by using CyberTrace Web.
The rules of the http_file_lookup event source are used when hashes of specified files or indicators in log files are searched for by using CyberTrace Web. Therefore, if you have to search for values contained in a log file that has a special format, we recommend specifying rules for the http_file_lookup event source.
If the configuration file contains the http_single_lookup event source or the http_file_lookup event source, we strongly recommend that you do not remove the regular expressions specified in these special event sources by default and, instead, edit them as needed.
Path
InputSettings > RegExps > Source
Attributes
This element has the following attributes.
Source element attributes
Attribute |
Description |
|---|---|
|
A unique identifier of the event source. In detection events, the identifier of the event source can be referred to by the %SourceId% pattern. |
|
The IP address of the event source. If an event has arrived from an event source that has the specified IP address, the event is processed by using the rules contained in this The |
|
The host name of the event source. The value of the host name is extracted from the event. In syslog events, the host name follows the timestamp (https://tools.ietf.org/html/rfc5424). For example, in the event If an event has arrived from an event source that has the specified host name and the IP address of the event source is not among those specified in the The hostname attribute cannot be set for the default, |
|
The regular expression that is used to determine if an event comes from the source. The specified regular expression is applied to an event. If the regular expression matches the event one or more times, the event is considered to be from the source. In this case, the event is processed by using the rules contained in this The hostname attribute cannot be set for the |
Nested elements
This element is a container for the following nested elements:
- Regular expressions
Regular expressions that are used to parse incoming events originating from this source.
Each regular expression is a separate element with the name of the regular expression.
- NormalizingRules
Rules for modifying incoming events.
Example
The following is an example of this element.
<Source id="CustomSource" ip="192.0.2.15"> <RE_MD5 type="MD5" extract="all">([\da-fA-F]{32})</RE_MD5> <RE_SHA1 type="SHA1" extract="all">([\da-fA-F]{40})</RE_SHA1> <RE_SHA256 type="SHA256" extract="all">([\da-fA-F]{64})</RE_SHA256> <NormalizingRules> ... </NormalizingRules> </Source> |
Source > Regular expression
Defines a regular expression for an event source.
Path
InputSettings > RegExps > Source > %RegexpName%
This element has the name of the regular expression.
Attributes
This element has the following attributes.
%RegexpName% element attributes
Attribute |
Description |
|---|---|
|
Sets a rule for creating a compound value from data extracted from an event. For more information, see section "About regular expressions". |
|
The Possible values are The The |
|
Specifies the type of value that is extracted by this regular expression. Possible values:
|
|
Specifies if the extracted value that matched a specified regular expression must be used for a retrospective scan. If the extracted value must be used for the retrospective scan, the value of this attribute is If the extracted value must not be used for the retrospective scan, the value of this attribute is This attribute cannot be used within elements where the |
Value
This element contains a Boost regular expression.
For more information about specifying values for this parameter, see section "About regular expressions".
Example
The following is an example of this element.
<RE_MD5 type="MD5" use_for_retroscan="true" extract="all">([\da-fA-F]{32})</RE_MD5> |
Source > NormalizingRules
Defines rules for modifying incoming events.
For more information about normalizing rules, see Adding normalizing rules.
Path
InputSettings > RegExps > Source > NormalizingRules
Attributes
This element has no attributes.
Nested elements
This element is a container for the following nested elements:
- Replace
These elements specify replacing rules.
- Ignore
These elements specify ignoring rules.
NormalizingRules > Replace
Defines a replacing rule.
This element has the following attributes.
Replace element attributes
Attribute |
Description |
|---|---|
|
Specifies a regular expression for the rule. |
|
Specifies the replacement sequence. |
NormalizingRules > Ignore
Defines an ignoring rule
This element has the following attributes.
Ignore element attributes
Attribute |
Description |
|---|---|
|
Specifies a regular expression for the rule. |
Example
The following is an example of this element.
<NormalizingRules> <Replace input="^\<(\d+)\>" output="NEW_EVENT\:\1\s" /> <Ignore input="Device0002" /> </NormalizingRules> |
ConnectionString
Specifies the IP address and port (or the Windows-named pipe) that the service will listen on for incoming events.
This element is mandatory.
Path
InputSettings > ConnectionString
Attributes
This element has no attributes.
Value
The value is formatted as <ip_address>:<port> (if an IP address and port are used) or as \\.\pipe\<pipe_name> (if a Windows-named pipe is used).
The IP address must consist of four decimal octets, each separated by a dot. The value in each octet must be less than 256.
Example
The following is an example of this element.
<ConnectionString>0.0.0.0:9999</ConnectionString> |
EventDelimiter
Specifies the rule for the splitting of incoming events.
Path
InputSettings > EventDelimiter
Attributes
This element has no attributes.
Value
The value rule must have the following format:
<EventDelimiter>%START_EVENT_SYMBOLS%</EventDelimiter>
The %START_EVENT_SYMBOLS% value contains the regular expression that corresponds to the beginning of the substring of the incoming event.
The rule processes all occurrences of the %START_EVENT_SYMBOLS% value. If the %START_EVENT_SYMBOLS% value is found in the string of the incoming event, this string will be split into multiple events by the addition of the newline character (\n) before every matched substring.
If the %START_EVENT_SYMBOLS% value does not match any substring of the incoming string, the incoming string is considered a single event.
If an event contains newline characters (\n), such an event will be split by using both the %START_EVENT_SYMBOLS% value and newline characters as event delimiters.
Example
The following is an example of this element.
<EventDelimiter><![CDATA[;]]></EventDelimiter> |
Feeds
Defines how events must be checked against feeds.
Path
Feeds
Attributes
This element has the following attributes:
Feeds element attributes
Attribute |
Description |
|---|---|
|
This attribute specifies how many times a field from an event can be matched against feeds. For example, a certain URL can match many feed records, so there will be many detection events. The This attribute is optional. If it is omitted, the number of generated events is not limited. |
|
This attribute specifies the update period (in minutes) for the feeds. You can use one of the following values: The value This attribute is optional. If it is omitted, the value |
Nested elements
This element is a container for the following nested element:
- Feed
Every Feed element describes a feed.
A configuration file must contain at least one Feed element.
Example
The following is an example of this element.
<Feeds per_scan_detect_limit="10000" update_frequency="30"> <Feed filename="Demo_Botnet_CnC_URL_Data_Feed.json" enabled="true" confidence="100"> ... </Feed> <Feed filename="Demo_Malicious_Hash_Data_Feed.json" enabled="true" confidence="100"> ... </Feed> <Feed filename="Demo_IP_Reputation_Data_Feed.json" enabled="true" confidence="100"> ... </Feed> </Feeds> |
Feed
Describes a feed or supplier.
Path
Feeds > Feed
Attributes
This element has the following attributes:
Feed element attributes
Attribute |
Description |
|---|---|
|
Specifies if the feed or supplier is enabled globally (across all tenants). |
|
The name of the supplier or the file name of the feed in the directory specified in the ServiceSettings > Bases element. This attribute is mandatory. |
|
The level of confidence of the feed or supplier. You can use values in the range of This attribute is mandatory. |
|
The period (in hours) following the last feed update, after which a notification about the outdated feed ( To turn off notifications for this feed, set this parameter to We recommend that you set this parameter to For third-party suppliers, this parameter is set to This attribute is optional. |
|
The period (in hours), after which indicators of compromise from the feed or supplier are removed from the database. If the indicator is detected on the basis of the incoming event, it is not removed from the database, but the feed that contains this indicator or the supplier that provided it can no longer be used in the matching process. To enable an infinite time limit for the feed or supplier invalidation, set this attribute to This attribute is mandatory (except for Kaspersky Threat Data Feeds). |
|
Name of the feed or supplier vendor. This attribute is optional. |
|
Specifies if the indicators from the feed or supplier must be used for retrospective scan. If the indicators must be used for retrospective scan, the value of this attribute is If the indicators must not be used for retrospective scan, the value of this attribute is |
|
Indicates that the supplier was added with the REST API. If the supplier was added with the REST API, the value of this attribute is This attribute is optional. |
Nested elements
This element is a container for the following nested elements:
- Field
This element is obsolete starting from Kaspersky CyberTrace version 4.0.
A Field element specifies the rules for checking an event against the records of the feed.
For more information about this element, see section "About feed matching rules".
- ActionableFields
Defines actionable fields.
Example
The following is an example of this element.
<Feed filename="Demo_Botnet_CnC_URL_Data_Feed.json" enabled="true" confidence="100"> <ActionableFields> ... </ActionableFields> </Feed> |
Feed > ActionableFields
Defines the fields that must be inserted into the outgoing events apart from the context. An outgoing event contains context and actionable fields.
Path
Feeds > Feed > ActionableFields
Attributes
This element has no attributes.
Nested elements
This element is a container for the following nested element:
- ActionableField
Defines a single actionable field.
ActionableFields > ActionableField
Defines a single actionable field.
This element has the following attributes:
ActionableField element attributes
Attribute |
Description |
|---|---|
|
The name of the field as it is used in the feed |
|
Contains the name of the field as it will be inserted into outgoing events. If the |
Example
The following is an example of this element.
<ActionableFields> <ActionableField name="information" output_name="cs4"/> <ActionableField name="threat" output_name="cs3"/> </ActionableFields> |
About feed matching rules
Starting from Kaspersky CyberTrace version 4.0, the Feeds > Feed > Field element is obsolete. Information in this section applies only to Kaspersky CyberTrace 3.1.0 and below.
Feed Service checks incoming events against the feeds specified in the Feeds > Feed elements. For each specified feed, matching rules are set with one or more Field elements. Each Field element describes how a particular field in the feed must match the data from incoming events.
The following is an example of a Field element:
<Field name="mask" matching_type="Url" input_regexp_to_match="RE_URL" category="KL_BotnetCnC_URL" /> |
The Field element must have the following attributes:
nameThe name of the field in the feed must be specified in the
nameattribute. Note that field names are case-sensitive. For example, fields"md5"and"MD5"are different fields.To specify nested fields, use the
'/'delimiter. For example,name="detail/info"specifies theinfofield in a feed that has the following content:[ { "hash":"234D123...", "detail": [ { "info" : "some value" } ] } ].matching_typeThe type of matching must be specified in the
matching_typeattribute.The following values are possible:
"Url"The event field will be checked for conformance to the URL masks stored in the feed. For more information about the masks stored in feeds, contact your technical account manager (TAM).
"Exact"Comparison of two strings will be performed: the event field and the field stored in the feed.
"Hash"The event field will be checked to determine whether it is equal to the one stored in the feed. This matching type is used only for hashes.
input_regexp_to_matchName of a regular expression that is used for matching. The value of this attribute must be one of the regular expression names from the
InputSettings > RegExpselement.categoryThe category that will be used in the outgoing event.
All the attributes of the Field element are required.
The following is an example of the feed matching rules for a specific feed:
<Feed filename="Botnet_CnC_URL_Data_Feed.json"> <Field name="mask" matching_type="Url" input_regexp_to_match="RE_URL" category="KL_BotnetCnC_URL" /> <Field name="files/MD5" matching_type="Hash" input_regexp_to_match="RE_MD5" category="KL_BotnetCnC_Hash_MD5" /> <Field name="files/SHA1" matching_type="Hash" input_regexp_to_match="RE_SHA1" category="KL_BotnetCnC_Hash_SHA1" /> <Field name="files/SHA256" matching_type="Hash" input_regexp_to_match="RE_SHA256" category="KL_BotnetCnC_Hash_SHA256" /> </Feed> |
The following is an example of the feed matching rules for a specific feed for ArcSight:
<Feed filename="Botnet_CnC_URL_Data_Feed.json"> <Field name="mask" matching_type="Url" input_regexp_to_match="RE_URL" category="KL_BotnetCnC_URL" /> <Field name="files/MD5" matching_type="Hash" input_regexp_to_match="RE_HASH" category="KL_BotnetCnC_Hash_MD5" /> <Field name="files/SHA1" matching_type="Hash" input_regexp_to_match="RE_HASH" category="KL_BotnetCnC_Hash_SHA1" /> <Field name="files/SHA256" matching_type="Hash" input_regexp_to_match="RE_HASH" category="KL_BotnetCnC_Hash_SHA256" /> </Feed> |
If you have events that contain the event source IP address, we recommend that you check them against IP Reputation Data Feed. This must be done because the event source may be a bot or a malicious device of some other kind that takes part in a DoS attack on the user resources. To check such events against IP Reputation Data Feed, add an SRC_IP regular expression to find the event source IP addresses. Also, add a rule for IP Reputation Data Feed to use the SRC_IP regular expression, so that the configuration file will contain the following records:
<Feed filename="IP_Reputation_Data_Feed.json"> <Field name="ip" matching_type="Exact" input_regexp_to_match="RE_IP" category="KL_IP_Reputation" /> <Field name="ip" matching_type="Exact" input_regexp_to_match="SRC_IP" category="KL_IP_Reputation" /> </Feed> |
Also, add the reference to the value found by the SRC_IP regular expression (%SRC_IP%) to the OutputSettings > EventFormat element.
IoCExports
Contains indicators export settings.
Path
IoCExports
Attributes
This element has the following attributes.
IoCExports element attributes
Attribute |
Description |
|---|---|
|
Path to a directory that will contain the report. This path can be either absolute or relative. |
Nested elements
The IoCExports element is a container for the following nested element:
Example
The following is an example of this element.
<IoCExports export_dir="../reports"> ... </IoCExports> |
IoCExport
Defines settings for a single report with exported data.
Path
IoCExports > IoCExport
Attributes
This element has the following attributes.
IoCExport element attributes
Attribute |
Description |
|---|---|
|
The name of the export task. The name can be in a range from 2 to 64 characters in length, must contain only Latin letters, digits (0-9), hyphens ( This attribute is mandatory. |
|
Specifies if a report must be generated. If the report must be generated, the value is If the report must not be generated, the value is This attribute is mandatory. |
|
Specifies the rule for splitting fields in the report file. Use one of the following characters as a delimiter: This attribute is mandatory. |
|
Specifies the update period (in minutes) for the export task. The following values are possible: This attribute is mandatory. |
|
Indicates whether the report file must contain column names as the first string. If the report file must contain column names as the first string, the value is If the report file must not contain column names as the first string, the value is This attribute is mandatory. |
|
Specifies the maximum number of indicators that can be included to the report file. The value must be a positive integer. The maximum number of records is 50,000. This attribute is mandatory. |
|
Specifies the identifier of the Kaspersky CyberTrace user who created the report. This attribute is mandatory. |
|
Specifies the credentials (user name and password) that must be used in the Basic authorization scheme when requesting a report. These credentials are stored encrypted. You can configure encryption by using the Kaspersky CyberTrace web user interface. This attribute is optional. |
Nested elements
The IoCExports > IoCExport element is a container for the following nested element:
- Filter
A configuration file must contain at least one Filter element.
Example
The following is an example of this element.
<IoCExport name="report_csv_123" enabled="true" delimiter=";" update_frequency="1440" create_header="true" records_limit="10000" created_by="admin" credentials="Mhy5QB7R487xbULBQJn8CzpOdV2fQftPyBJPxgjLBXZb+x08"> ... </IoCExport> |
IoCExport > Filter
Defines the filtering rules for data to be exported.
Path
IoCExports > IoCExport > Filter
Attributes
This element has the following attributes.
Filter element attributes
Attribute |
Description |
|---|---|
|
Specifies the name of the field to which filtering rules are applied and /or which must be exported. You can specify indicator attribute names from the indicator database. For the list of possible names, see section "Working with indicators" The name can be in a range from 2 to 255 characters in length, must contain only lowercase ASCII characters and cannot begin with a hyphen ( This attribute is mandatory. |
|
Specifies filtering criteria for the field. It is allowed to use a This attribute is mandatory. |
|
Specifies whether the field values must be included in the report file. If the field values must be included to the report file, the value is If the field values must not be included in the report file, the value is This attribute is mandatory. |
|
Specifies the name of the field that must contain the values from the exported field. This attribute is mandatory if the following requirements are met:
|
|
Specifies the sorting order for field values. The following values are possible:
|
Example
The following is an example of this element.
<Filter field="ioc_type" value="MD5;SHA1" sort="desc" included="false"/> <Filter field="supplier_name" value="IP Reputation Data Feed" included="true" output_name="feed"/> <Filter field="supplier_confidence" value="*" included="false"/> <Filter field="added_timestamp" value="[*;25.12.2019]" sort="asc" included="false"/> |
RetroScan
Contains retrospective scan settings.
Path
RetroScan
Attributes
This element has the following attributes.
RetroScan element attributes
Attribute |
Description |
|---|---|
|
Indicates if a retrospective scan mechanism is enabled. If the retrospective scan is enabled, the value is If the retrospective scan is disabled, the value is The preset value is This attribute is mandatory. |
|
The maximum size of the events (in MB) that must be saved for the retrospective scan. The preset value is This attribute is mandatory. |
|
The maximum time interval (in days) during which the events that must be saved for the retrospective scan are stored. The preset value is This attribute is mandatory. |
|
The maximum time interval (in days) during which the results of the retrospective scan are stored. The preset value is This attribute is mandatory. |
|
Frequency (in hours) of the retrospective scan scheduled task. The preset value is This attribute is mandatory. |
SendEventFilters
Contains filtering rules for detection events from Kaspersky CyberTrace. You can specify several filtering rules at once.
Path
SendEventFilters
Attributes
This element has no attributes.
Nested elements
This element is a container for the following nested element:
- Filter
A filtering rule.
SendEventFilters > Filter
This element defines a filtering rule.
For more information about this element and possible values of its attributes, see section "Working with indicators".
This element has the following attributes:
ActionableField element attributes
Attribute |
Description |
|---|---|
|
The name of the indicator attribute from the indicator database to which filtering rules are applied. |
|
Filtering rule. Kaspersky CyberTrace sends a detection event if the value of the indicator attribute matches the specified value.
|
Example
The following is an example of this element.
<SendEventFilters> <Filter attribute="ioc_supplier_context.last_seen" value="[01.02.2013;01.02.2015]"/> <Filter attribute="ioc_supplier_context.popularity" value="5"/> <Filter attribute="ioc_updated_timestamp" value="[%NOW%-3;%NOW%]"/> </SendEventFilters> |
OutputSettings
Contains output settings for the General tenant.
Defines the address and port of the event target software to send the outgoing events to, and the format of the outgoing events.
Path
OutputSettings
Attributes
This element has no attributes.
Nested elements
This element is a container for the following nested elements:
- EventFormat
Specifies the format of outgoing events.
For more information about the values of this element, see About event formats and patterns.
The EventFormat element is mandatory.
- RecordFieldContextFormat
Specifies how context fields must be added to an event.
For more information about the values of this element, see About event formats and patterns.
The RecordFieldContextFormat element is mandatory.
- ActionableFieldContextFormat
Specifies how actionable fields must be added to an event.
For more information about the values of this element, see About event formats and patterns.
The ActionableFieldContextFormat element is mandatory.
- AlertFormat
Specifies the format for outgoing events that inform the event target software of the Feed Service state.
For more information about the values of this element, see About event formats and patterns.
The AlertFormat element is optional. If it is absent from the configuration file, no notification is made.
- ConnectionString
Specifies the IP address and port (or the Windows-named pipe) to which the service will send outgoing events.
The ConnectionString element is mandatory.
For more information about this element, see the "OutputSettings > ConnectionString" section below.
- AlertConnectionString
Specifies the IP address (or host) and port to which the service will send service alerts.
The AlertConnectionString element is optional.
For more information about this element, see the "OutputSettings > AlertConnectionString" section below.
- FinishedEventFormat
Specifies the format of the informational event that is generated for each processed event.
The FinishedEventFormat element is mandatory.
For more information about this element, see the "OutputSettings > FinishedEventFormat" section below.
OutputSettings > ConnectionString
Specifies the IP address (or host) and port to which the service will send service alerts.
The string is formatted as <ip_address>:<port> (if an IP address and port are used) or as \\.\pipe\<pipe_name> (if a Windows-named pipe is used). The IP address must consist of four decimal octets, each separated by a dot. The value in each octet must be less than 256.
OutputSettings > AlertConnectionString
Specifies the IP address (or host) and port to which the service will send service alerts.
The value of this element is formatted as <ip_address>:<port> (if an IP address and port are used) or as \\.\pipe\<pipe_name> (if a Windows-named pipe is used). The IP address must consist of four decimal octets, each separated by a dot. The value in each octet must be less than 256.
The AlertConnectionString element is optional. If the element is omitted, the enabled attribute with the false value is used for this element.
This element has the following attributes:
AlertConnectionString element attributes
Attribute |
Description |
|---|---|
|
Defines whether Feed Service sends alert events to the specified IP address and port. Possible values: If the value is If the value is |
OutputSettings > FinishedEventFormat
Specifies the format of the informational event that is generated after an event is processed.
If this parameter is enabled, Kaspersky CyberTrace will generate an informational event for each event that it processes. An informational event is generated even if there were no detections.
The FinishedEventFormat element is mandatory.
The value of this element specifies the event format. You can use the %RecordContext% pattern and regular expression names in the format. For more information about patterns, see About event formats and patterns.
The %RecordContext% pattern will provide the following fields, if used:
- category
It is
"LookupFinished"for events of this type. - sent_events
The number of events sent to a SIEM solution.
- total
Concatenation of the following substrings formed for every category assigned to detection events:
<category>:<number_of_detections>;If there were no detections, the sent_events parameter is set to
0, and the total string is empty.
This element has the following attributes:
FinishedEventFormat element attributes
Attribute |
Description |
|---|---|
|
Defines whether special informational events are generated. Possible values: If the value is If the value is This attribute is optional. |
Example
The following is an example of this element.
<OutputSettings> <RecordFieldContextFormat><![CDATA[ %ParamName%=%ParamValue%]]></RecordFieldContextFormat> <AlertFormat>%Date% alert=%Alert%%RecordContext%</AlertFormat> <EventFormat>%RE_DATE% category=%Category% matchedIndicator=%MatchedIndicator% url=%RE_URL% src=%SRC_IP% ip=%RE_IP% md5=%RE_MD5% sha1=%RE_SHA1% sha256=%RE_SHA256% usrName=%RE_USERNAME%%RecordContext%</EventFormat> <FinishedEventFormat enabled="true">LookupFinished %RecordContext%</FinishedEventFormat> <ActionableFieldContextFormat><![CDATA[ %ParamName%:%ParamValue%]]></ActionableFieldContextFormat> <ConnectionString>127.0.0.1:9998</ConnectionString> <AlertConnectionString>192.0.2.145:9998</AlertConnectionString> </OutputSettings> |
ServiceSettings
Defines settings for the Feed Service process.
Path
ServiceSettings
Attributes
This element has no attributes.
Nested elements
This element is a container for the following nested elements:
- Bases
Specifies the path to the directory that contains feeds from Kaspersky. If a relative path is set, it is calculated relative to the directory that contains the service binary file.
The Bases element is mandatory.
- BasesBackup
Specifies the path to the directory that contains backup version of feeds from Kaspersky. If a relative path is set, it is calculated relative to the directory that contains the service binary file.
The BasesBackup element is mandatory.
- BasesDownload
Specifies the path to the directory that contains downloaded feeds from Kaspersky. If a relative path is set, it is calculated relative to the directory that contains the service binary file.
The BasesDownload element is mandatory.
- TemporaryDir
The directory for temporary files.
The TemporaryDir element is optional. If it is omitted, the default value is used.
In Linux, the default value is
/tmp.In Windows, the default value is
%TEMP%(the current Windows user's temporary folder). - OutdatedBasesAlertPeriod
The time interval in hours following the last feed update, after which a notification about an outdated feed is sent to the event target. To turn off notifications, set this parameter to
0. This setting is taken into account for every feed that has no outdated_alert_period attribute.The OutdatedBasesAlertPeriod element is optional. If it is omitted, the default value
0is used. - ScannersCount
The number of scanners. Every scanner handles a single TCP connection.
If you want to run Feed Service in watchdog mode, specify one scanner in addition to the number of scanners needed for Feed Service itself. This must be done because the watchdog module uses an additional scanner.
The ScannersCount element is optional. If it is omitted, the default value
9is used. - ScanningThreadsPerScanner
The number of threads per scanner.
The ScanningThreadsPerScanner element is optional. If it is omitted, the default value
8is used. - EventSendingRetriesCount
Number of times Feed Service tries to resend a detection event to a SIEM solution if the first attempt at sending fails. If the value of
EventSendingRetriesCountis0, Feed Service sends each detection event one time and does not attempt to resend it.Maximum possible value is
10. The preset value is3.The EventSendingRetriesCount element is mandatory.
- EventSendingRetriesTimеout
Time interval between attempts made by Feed Service to resend a detection event to a SIEM solution, in seconds. Maximum possible value is
60.The EventSendingRetriesTimеout element is mandatory.
The preset value is
10. - FeedsRollbackEnabled
Specifies if feeds rollback is enabled or disabled.
If feeds rollback is enabled, feeds are rolled back when Kaspersky CyberTrace fails to upload new indicators into the Matching engine after feeds are updated. Kaspersky CyberTrace removes new indicators from the database and uses the previous feeds.
Possible values:
true— feeds rollback is enabled.false— feeds rollback is disabled.
Kaspersky CyberTrace reads FeedsRollbackEnabled only during initialization and does not reread it after.
By default, there is no FeedsRollbackEnabled element in the configuration file. If this element is missing, feeds rollback is enabled.
Example
The following is an example of this element.
<ServiceSettings> <Bases>../feeds</Bases> <BasesBackup>../feeds/backup</BasesBackup> <BasesDownload>../feeds/download</BasesDownload> <TemporaryDir>/tmp</TemporaryDir> <OutdatedBasesAlertPeriod>120</OutdatedBasesAlertPeriod> <ScannersCount>9</ScannersCount> <ScanningThreadsPerScanner>8</ScanningThreadsPerScanner> <EventSendingRetriesCount>3</EventSendingRetriesCount> <EventSendingRetriesTimеout>10</EventSendingRetriesTimеout> <FeedsRollbackEnabled>true</FeedsRollbackEnabled> </ServiceSettings> |
GUISettings
Defines settings for the CyberTrace Web.
Path
GUISettings
Attributes
This element has no attributes.
Nested elements
This element is a container for the following nested elements:
- HTTPServer
Contains the CyberTrace HTTP service parameters.
- FeedUtil
Contains the Feed Utility parameters.
- AuthenticationServers
Defines settings for connection to the LDAP servers.
Example
The following is an example of this element.
<GUISettings> <HTTPServer> ... </HTTPServer> <FeedUtil> ... </FeedUtil> <AuthenticationServers> ... </AuthenticationServers> </GUISettings> |
HTTPServer
Contains the CyberTrace HTTP service parameters.
Path
GUISettings > HTTPServer
Attributes
This element has no attributes.
Optional
The HTTPServer element is optional. If it is omitted, the default values are used.
Nested elements
This element is a container for the following nested elements:
- ConnectionString
Specifies the IP address and port where the CyberTrace HTTP service is available.
The
ConnectionStringelement is optional. If it is omitted, the127.0.0.1:443IP address and port are used. After the installation process is complete, the default value of the HTTPServer > ConnectionString element is0.0.0.0:443. - SSLCertificatePath
Path to the PEM-formatted certificate on a local computer for HTTPS connections. If a relative path is specified, it is calculated relative to the executable file.
For security reasons, do not store your certificate in a shared folder accessible over a network and do not specify the path to a network shared folder containing your certificate.
The SSLCertificatePath element is optional. If it is omitted, the
../httpsrv/kl_feed_service_cert.pemfile is used. - SSLPrivateKeyPath
Path to the PEM-formatted private key on a local computer for HTTPS connections. If a relative path is specified, it is calculated relative to the executable file.
For security reasons, do not store your private key in a shared folder accessible over a network and do not specify the path to a network shared folder containing your private key.
The SSLPrivateKeyPath element is optional. If it is omitted, the
../httpsrv/kl_feed_service_private.pemfile is used. - TemplatesPath
Path to the directory that contains layout pages for CyberTrace HTTP Service. If a relative path is specified, it is calculated relative to the executable file.
The TemplatesPath element is optional. If it is omitted, the
../httpsrv/templates/directory is used. - ResourcesIP
Contains the IP address or hostname that is used in the
%IndicatorInfo%field of detection events, in the service events to notify that a retrospective scan completes, and in the result of exporting an indicator.The ResourcesIP element is mandatory. The default value is
127.0.0.1.
Example
The following is an example of this element.
<HTTPServer> <ResourcesIP>127.0.0.1</ResourcesIP> <ConnectionString>0.0.0.0:443</ConnectionString> <TemplatesPath>../httpsrv/templates</TemplatesPath> <SSLCertificatePath>../httpsrv/kl_feed_service_cert.pem</SSLCertificatePath> <SSLPrivateKeyPath>../httpsrv/kl_feed_service_private.pem</SSLPrivateKeyPath> </HTTPServer> |
FeedUtil
Contains the Feed Utility parameters.
Path
GUISettings > FeedUtil
Attributes
This element has no attributes.
Nested elements
This element is a container for the following nested element:
- ConfigurationPath
Path to the Feed Utility configuration file.
The ConfigurationPath element is mandatory.
Example
The following is an example of this element.
<FeedUtil> <ConfigurationPath>../etc/kl_feed_util.conf</ConfigurationPath> </FeedUtil> |
AuthenticationServers
Defines settings for connection to the LDAP servers.
Path
GUISettings > AuthenticationServers
Attributes
This element has no attributes.
Mandatory
This element is mandatory.
Nested elements
This element is a container for the following nested element:
- AuthenticationServer
Contains the LDAP connection settings parameters.
Example
The following is an example of this element.
<AuthenticationServers> <AuthenticationServer type="LDAP" enabled="true"> ... </AuthenticationServer> </AuthenticationServers> |
AuthenticationServers > AuthenticationServer
Contains the LDAP connection settings parameters.
Path
GUISettings > AuthenticationServers > AuthenticationServer
Optional
The AuthenticationServer element is optional.
Attributes
This element has the following attributes.
AuthenticationServer element attributes
Attribute |
Description |
|---|---|
|
Specifies the type of server to connect. Possible values: This attribute is mandatory. |
|
Indicates whether the specified server must be used. Possible values: This attribute is mandatory. |
Nested elements
This element is a container for the following nested elements:
- ConnectionString
Contains the connection parameters for the LDAP server.
For more information about this element, see subsection "AuthenticationServer > ConnectionString" below.
- DomainName
The path to the database that contains the user accounts that can access Kaspersky CyberTrace.
For more information about this element, see subsection "AuthenticationServer > DomainName" below.
- AdministratorAccountsFilter
Contains filtering rules for user accounts that must be assigned the Administrator role.
The AdministratorAccountsFilter element must not contain the value that is specified in the AnalystAccountsFilter element.
The AdministratorAccountsFilter element can be empty.
- AnalystAccountsFilter
Contains filtering rules for user accounts that must be assigned the Analyst role.
The AnalystAccountsFilter element must not contain the value that is specified in the AdministratorAccountsFilter element.
The AnalystAccountsFilter element can be empty. If the value is not specified, all user accounts that access Kaspersky CyberTrace will have the Analyst role.
This element is mandatory.
AuthenticationServer > ConnectionString
IP address or FQDN (fully qualified domain name), and port of the LDAP server.
This element is mandatory and cannot be empty.
This element has the following attributes.
ConnectionString element attributes
Attribute |
Description |
|---|---|
|
Indicates whether to use an SSL connection. If an SSL connection is used, the value is If an SSL connection is not used, the value is |
|
Specifies a response timeout from the LDAP server, in seconds. The range of values for this attribute is from |
AuthenticationServer > DomainName
The path to the database that contains the user accounts that can access Kaspersky CyberTrace.
This element is mandatory and cannot be empty.
This element has the following attributes.
DomainName element attributes
Attribute |
Description |
|---|---|
|
Indicates whether to use the User Principal Name (UPN) format. Specify Otherwise, specify |
Example
The following is an example of this element.
<AuthenticationServer type="LDAP" enabled="true"> <ConnectionString use_encryption="false" connection_timeout="20">ldap.example.com:389</ConnectionString> <DomainName use_principal_name="true">dc=testing,dc=con</DomainName> <AdministratorAccountsFilter>cn=theadministrator</AdministratorAccountsFilter> <AnalystAccountsFilter>cn=users_an</AnalystAccountsFilter> </AuthenticationServer> |
Feed Service logging
This section describes how Feed Service logs its activity.
Enabling logging
By default, logging is disabled. To enable logging, use the kl_feed_service_log.conf file in the bin directory where the binary file of the service is located. Fill in the kl_feed_service_log.conf file as described in this section. This file is used by Feed Service and the watchdog module. A change in the contents of the kl_feed_service_log.conf file results in the new settings being applied; this process takes several seconds.
Enabling logging decreases the performance of Feed Service. Use logging only if you encounter problems and errors.
Logging and data security
If you enable logging, Feed Service can write to the log files any of the following information that can be considered private, security-related, or sensitive:
- Unmodified data (URLs, IP addresses, hashes, and other data) as it is received by Feed Service.
- The results of checking events against a feed.
Log files are regular text files. No information written to the log files is encrypted. The log files have standard inherited access rights. We recommend that you assign the directory for storing log files the appropriate rights so that only the administrator can read the log files.
Kaspersky CyberTrace does not send log files or any data contained in them to Kaspersky. For technical support purposes, your Technical Account Manager can ask you to provide log files.
Log files are stored until they are explicitly deleted by a user. If the Append parameter in the logging configuration file is 0, the previous log files are deleted when Feed Service is started. If the Append parameter in the logging configuration file is 1, the information is retained during the full cycle of Feed Service usage
If you uninstall Kaspersky CyberTrace, these log files will not be deleted if the directory with log files is located outside of the Feed Service installation directory (as specified by the LogsFolder parameter).
For more information about data written to the log files, see subsection "Log file contents" below.
Logging configuration file
The kl_feed_service_log.conf file is an XML file. Its fields are described in the table below.
Parameter |
Description |
Mandatory / optional |
|---|---|---|
WriteLog |
Log level. One of the following values can be used:
|
Optional By default, |
LogsFolder |
The directory where to store log files. Absolute and relative paths can be used. On Windows, you cannot use the following symbols in the
If you use environment variables in the |
Optional By default, the |
SizeLimit |
The maximum size of the log file, in MB. If |
Optional By default, |
Append |
Indicates whether old log files must be removed ( |
Optional By default, |
UseSyslog |
Indicates whether the system daemon syslog will be used for logging (1) or not (0). This parameter is not used in Windows. |
Optional By default, |
Configuration file example
The following kl_feed_service_log.conf file example enables logging at the dbg logging level. Logs will be stored in the logs subdirectory of the directory where the Feed Service binary file resides.
<Logging> <WriteLog>dbg</WriteLog> <LogsFolder>logs</LogsFolder> <SizeLimit>0</SizeLimit> <Append>0</Append> <UseSyslog>0</UseSyslog> </Logging> |
Log files name format
Feed Service writes messages to files named "kl_feed_service-<pid>-<date_time>.log" or "kl_feed_service-<pid>-<date_time>_<index>.log".
The watchdog module writes messages to files named "kl_feed_servicewd-<pid>-<date_time>.log" or "kl_feed_servicewd-<pid>-<date_time>_<index>.log".
Log file contents
If the err logging level is used, Feed Service writes the following information to the log:
- Feed Service version and PID of the service process.
- The Feed Service configuration file parameters.
- Path to the directory with feeds.
- Errors occurred when normalizing a URL.
- Errors occurred while establishing a TCP connection.
- Watchdog messages:
- Feed Service freezing or crashing.
- Restarting Feed Service.
- Errors that occurred while changing the state of CyberTrace Web interface elements. Identifiers of user sessions where these errors occurred.
- Information about errors that occurred while handling CyberTrace Web HTTP requests:
- Request method, GET or POST.
- Request path for GET and POST requests.
- GET request parameters. For POST requests, the request body is not logged.
- Total elapsed time for handling the request.
If the inf logging level is used, Feed Service writes the following information to the log:
- Information to be written at the
errlogging level. - Establishing or closing a TCP connection.
- Receiving and sending TCP requests and responses.
- Switching Feed Service to same-socket mode.
- Putting new databases into effect.
- Detecting an event that matches some record in a feed.
- Incoming event.
Note that incoming events can contain private data, and so we recommend that you protect the log files from unauthorized access.
- Messages about navigating CyberTrace Web pages. Identifiers of user sessions for these messages.
If the dbg logging level is used, Feed Service writes the following information to the log:
- Information to be written at the
inflogging level. - Substrings in events information that regular expressions match.
- The result of checking an event against a feed.
- Sending test messages to and from the watchdog module.
- Messages about actions performed on CyberTrace Web pages. Identifiers of user sessions for these messages.
- Information about successful CyberTrace Web HTTP requests:
- Request method, GET or POST.
- Request path for GET and POST requests.
- GET request parameters. For POST requests, the request body is not logged.
- Total elapsed time for handling the request.
About resending detection events
By default, if an error occurs when Feed Service is sending a detection event to a SIEM solution, this event is sent again after a period of time specified in the configuration file.
You can configure how many times Feed Service attempts to send each detection event and the interval between attempts by using the EventSendingRetriesCount and EventSendingRetriesTimеout elements of the configuration file.
Feed Service in ReplyBack mode
In some cases, it is necessary for Feed Service to send responsive events back to the event source to the same socket from which the original events are received (ReplyBack mode).
To shift Feed Service to ReplyBack mode:
Send X-KF-ReplyBack as the first message after a TCP connection with Feed Service is established.
During the current TCP session every responsive event will be sent back to the same socket from which the original event was received. The setting specified in the OutputSettings > ConnectionString element of the configuration file will be ignored.
You can configure Feed Service to send an informational event indicating that event checking has finished.
To enable sending finishing events, perform one of the following actions:
- Set the
enableattribute of theOutputSettings > FinishedEventFormatelement of the Feed Service configuration file totrue. - Send
X-KF-SendFinishedEventX-KF-ReplyBackas the first message after a TCP connection with Feed Service is established.In this case, the
enableattribute of theOutputSettings > FinishedEventFormatelement in the Feed Service configuration file will be ignored.
To instruct Feed Service that it must shift to ReplyBack mode and send finishing events:
Send X-KF-SendFinishedEventX-KF-ReplyBack as the first message after a TCP connection with Feed Service is established.
By default, in ReplyBack mode, Kaspersky CyberTrace does not save the statistics of the detection events received during the current connection.
To save the statistics of the detection events in ReplyBack mode:
- If you want Feed Service to send finishing events, send
X-KF-SendFinishedEventX-KF-ReplyBackX-KF-SaveStatisticas the first message after a TCP connection with Feed Service is established. - If you do not want Feed Service to send finishing events, send
X-KF-ReplyBackX-KF-SaveStatisticas the first message after a TCP connection with Feed Service is established.
Features of event processing by Feed Service
This section outlines the way in which Feed Service processes incoming events.
Feed Service receives and sends events using TCP. Events are encoded in UTF-8.
Feed Service processes special characters in incoming events as follows:
- Feed Service treats the line feed character (0x0A) as the delimiter between events.
Thus, text before a line feed character and text after it belong to different events.
- Feed Service ignores the carriage return character (0x0D).
Limitations on Feed Service incoming events
Feed Service processes events that are no larger than 64 kilobytes (KB). If an incoming event exceeds 64 KB, Feed Service splits it into several events and processes them separately. Thus, an indicator can be split in two and may not be extracted and checked.
We recommend that you configure the event source (the SIEM software), or the normalization rules, or both, so that the incoming events will not exceed 64 KB in size.
Page topWorking with feeds
Feed Utility is a tool that can download, filter, and compile Kaspersky Threat Data Feeds according to a specified set of rules defined in its configuration file. These rules can also be set by using Kaspersky CyberTrace Web.
Downloading
Feed Utility downloads archives containing feeds from the update servers. Each downloaded archive contains one feed. Before downloading Kaspersky Threat Data Feeds, Feed Utility checks whether they are newer than those being used. Before downloading OSINT and third-party feeds, Feed Utility does not perform such checking.
Feed Utility uses a certificate for authentication. The certificate also defines which Kaspersky Threat Data Feeds can be downloaded by Feed Utility. For example, if you have a demo certificate, Feed Utility can download only demo feeds.
Processing and filtering
After the archives containing feeds are downloaded, Feed Utility unpacks the archives and processes the original feed files. The feed files are modified according to a combination of feed rules, filtering rules, and other parameters specified in the Feed Utility configuration file. These parameters define the data that will be included in the resulting feeds, the output format of the resulting feeds, and the maximum number of records in the resulting feed.
Filtering is the process of modifying the original feed files according to specified filtering criteria. Filtering criteria are defined in the filtering rules for each feed. Depending on the intended Feed Utility usage scenario, you may want to create a feed that uses only a subset of information contained in the original feed. This can be achieved by using a combination of feed rules and filtering rules.
Default filtering rules
The default Feed Utility configuration file that is shipped in the Kaspersky CyberTrace distribution kit contains the following filtering rule for IP Reputation Data Feed and Demo IP Reputation Data Feed:
Only feed records whose threat_score parameter is not less than 75 are detected.
Kaspersky considers malicious those IP addresses whose threat_score is not less than 75. IP addresses whose threat_score is less than 75 are considered related to spam and posing no threat.
If you reduce the boundary value or remove the filter, you will have many detections by Demo IP Reputation Data Feed and IP Reputation Data Feed that will be mere notifications about detecting spam IP addresses.
To remove the filter:
- Open the Settings > Feeds page of Kaspersky CyberTrace Web.
- For Demo IP Reputation Data Feed (or IP Reputation Data Feed) remove the filtering rule for the
threat_scorefield.
Compiling
If you use Feed Utility with Feed Service, feeds that contain URL masks must be converted to binary format. Feed Utility compiles the URL masks extracted from these feeds and creates binary files which are then used by Feed Service to quickly match URLs from received events to URL masks. Compiling is performed automatically by Feed Utility, if the UrlMatcherField option is specified in the feed rules.
Reloading
When notified, Feed Service reloads the feeds for use, that is, it unloads the old feeds from memory and loads the new ones.
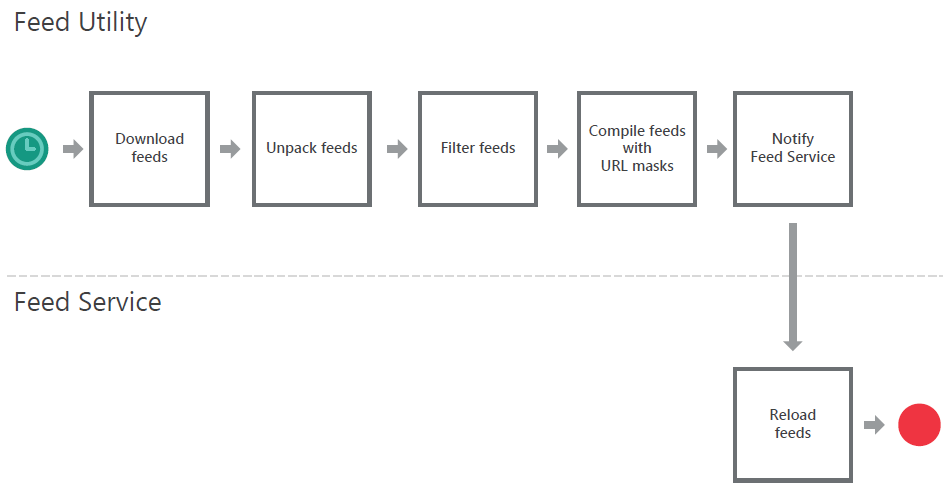
Updating feeds
Page topFeed Utility command-line options
Feed Utility is a console application. You can invoke it from the command line.
Syntax
Feed Utility uses the following syntax in Linux:
./kl_feed_util [options]
Feed Utility uses the following syntax in Windows:
kl_feed_util.exe [options]
Options
The following options are available:
-h [ --help ]Prints the help message.
-v [ --verbose ]Enables verbose mode.
If verbose mode is enabled, Feed Utility prints detailed information about its activity to the screen. If verbose mode is disabled, brief information is printed.
-s [ --silent ]Enables silent mode.
If silent mode is enabled, Feed Utility does not print information about its activity to the screen.
-c [ --config ] argSpecifies the path to the configuration file. The path must be specified in the
argargument.You can use absolute or relative paths. If a relative path is specified, it is calculated relative to the Feed Utilty binary file.
The default value for this parameter is
kl_feed_util.conf. Feed Utility searches for this file in the directory where its binary file is located.-d [ --download ]Enables downloading mode.
If this option is specified, Feed Utility downloads feeds, but does not process them.
Downloaded files will be located in the directory specified in the
WorkDirparameter of the Feed Utility configuration file.-u [ --unpack ]Unpack downloaded feeds.
If this option is specified, Feed Utility unpacks the feeds after downloading.
This option can be used only in combination with
-dor-poption.-p [ --processing ]Enables processing mode.
If this option is specified, Feed Utility processes feeds, but does not download or unpack them. Feed Utility does not delete the original feed files.
Feed Utility looks for feeds in the directory specified in the
WorkDirparameter of the Feed Utility configuration file.In processing mode, Feed Utility does not delete the original feed files, located in the
WorkDirdirectory. This may lead to a situation where this directory contains several versions of one feed file. In this case, Feed Utility will print an error message. To avoid this situation, you must manually delete the original feed files from theWorkDirdirectory after they are processed by Feed Utility.-f [--feed] argDownload or process the specified feed.
The name of the feed must be specified in the
argargument. This name must correspond to the value of theNameparameter specified in feed rules (Feeds>Feed>Name).You can specify more than one feed. In this case, separate feed names with a semicolon (
;).This parameter can be used with
-dand-pparameters.-i [--input]Parses an external feed and converts it to JSON format according to parsing rules defined for this feed.
The name of the feed must be specified with
-fformat.--set-proxy username:password@host:portWrites specified proxy connection settings to the Feed Utility configuration file. The
usernameandpasswordparameters are written in encrypted form.Specify the user name in the
usernameparameter, password in thepasswordparameter, and proxy server address and port in thehostandportparameters.If a proxy server does not require authentication, use the
--set-proxy host:portformat.--set-taxii username:password@feedname@taxii-address@collectionnameWrites specified TAXII server connection settings to the Feed Utility configuration file. The
usernameandpasswordparameters are written in encrypted form.If a TAXII server does not require authentication, use the
feedname@taxii-address@collectionnameformat.--set-basic-auth username:password@feednameWrites the specified basic authentication settings to the Feed Utility configuration file. The
usernameandpasswordparameters are written in encrypted form.If a password is not required, use the
username:@feednameformat.--speedtestMeasures the average speed with which Feed Utility downloads feeds from Kaspersky servers.
You can combine this parameter with the
-сparameter to specify the path to the configuration file that will be used.
Syntax examples
The following command runs Feed Utility with default parameters. Feed Utility will download, unpack, and process feeds.
- In Linux:
./kl_feed_util
- In Windows:
kl_feed_util.exe
The following command runs Feed Utility in verbose mode with a configuration file named custom_configuration.conf, which is located in the same directory as the utility binary file.
- In Linux:
./kl_feed_util -v -c custom_configuration.conf
- In Windows:
kl_feed_util.exe -v -c custom_configuration.conf
The following command makes Feed Utility download and unpack feeds.
- In Linux:
./kl_feed_util -d -u
- In Windows:
kl_feed_util.exe -d -u
With the following command, Feed Utility processes the unpacked feeds. In this case, Feed Utility does not download the feeds; it only looks for the unpacked feed files and processes them.
- In Linux:
./kl_feed_util -p
- In Windows:
kl_feed_util.exe -p
The following command makes Feed Utility unpack and process feeds.
- In Linux:
./kl_feed_util -u -p
- In Windows:
kl_feed_util.exe -u -p
The following command makes Feed Utility download, unpack, and process the specified feed.
- In Linux:
./kl_feed_util -f Demo_Botnet_CnC_URL_Data_Feed
- In Windows:
kl_feed_util.exe -f Demo_Botnet_CnC_URL_Data_Feed
The following command specifies proxy connection parameters. These parameters are written to the configuration file.
- In Linux:
./kl_feed_util --set-proxy 'user:pass@proxy.example.com:3128'
- In Windows:
kl_feed_util.exe --set-proxy 'user:pass@proxy.example.com:3128'
The following command specifies proxy connection parameters for a proxy that does not require authentication. These parameters are written to the configuration file.
- In Linux:
./kl_feed_util --set-proxy 'proxy.example.com:3128'
- In Windows:
kl_feed_util.exe --set-proxy 'proxy.example.com:3128'
The following command specifies TAXII server connection parameters. These parameters are written to the configuration file.
- In Linux:
./kl_feed_util --set-taxii '
user:pass@Example_Feed_Name@http://example.com@Example_Collection' - In Windows:
kl_feed_util.exe --set-taxii '
user:pass@Example_Feed_Name@http://example.com@Example_Collection'
The following command displays an average speed with which Feed Utility downloads the feeds from Kaspersky servers.
- In Linux:
./kl_feed_util --speedtest
- In Windows:
kl_feed_util.exe --speedtest
Output example
The following example demonstrates a typical Feed Utility output. Feed Utility downloads demo feeds, and then unpacks and processes them.
2018-08-03 16:20:31.815 7f9b01c58740 INF KL Feed Utility, version: 1.1.91.0/Release 2018-08-03 16:20:31.815 7f9b01c58740 INF Built at 2018-08-02T15:06:50Z for Linux/x86_64 2018-08-03 16:20:31.815 7f9b01c58740 INF Running at Linux/x86_64 version #1 SMP Debian 3.16.43-2 (2017-04-30) 2018-08-03 16:20:31.815 7f9b01c58740 INF Current locale is en_US.UTF-8 2018-08-03 16:20:31.992 7f9b01c58740 INF feed #85(Demo_Botnet_CnC_URL_Data_Feed) version 2018-08-03T12:47:26.893 is available 2018-08-03 16:20:32.404 7f9b01c58740 INF update of feed #85(Demo_Botnet_CnC_URL_Data_Feed) is extracted to /opt/feed_util/bin/tmp/Demo_Botnet_CnC_URL_Data_Feed.json 2018-08-03 16:20:32.586 7f9b01c58740 INF feed #86(Demo_Malicious_Hash_Data_Feed) version 2018-08-03T12:44:53.82 is available 2018-08-03 16:20:32.992 7f9b01c58740 INF update of feed #86(Demo_Malicious_Hash_Data_Feed) is extracted to /opt/feed_util/bin/tmp/Demo_Malicious_Hash_Data_Feed.json 2018-08-03 16:20:33.172 7f9b01c58740 INF feed #87(Demo_IP_Reputation_Data_Feed) version 2018-08-03T12:57:57.017 is available 2018-08-03 16:20:33.406 7f9b01c58740 INF update of feed #87(Demo_IP_Reputation_Data_Feed) is extracted to /opt/feed_util/bin/tmp/Demo_IP_Reputation_Data_Feed.json 2018-08-03 16:20:34.414 7f9b01c58740 INF 3 of 3 feeds downloaded 2018-08-03 16:20:34.416 7f9afedb9700 INF start processing of feed #87(Demo_IP_Reputation_Data_Feed) 2018-08-03 16:20:34.416 7f9aff5ba700 INF start processing of feed #86(Demo_Malicious_Hash_Data_Feed) 2018-08-03 16:20:34.425 7f9b007ea700 INF start processing of feed #85(Demo_Botnet_CnC_URL_Data_Feed) 2018-08-03 16:20:34.855 7f9b01c58740 INF 3 of 3 feeds processed 2018-08-03 16:20:35.255 7478 INF Starting the speed test... 2018-08-03 16:20:35.874 7478 INF 500.00 MiB downloaded in 14399 ms, average speed is 34.72 MiB/s 2018-08-03 16:20:36.133 7478 INF 500.00 MiB downloaded in 14304 ms, average speed is 34.96 MiB/s 2018-08-03 16:20:36.421 7478 INF 500.00 MiB downloaded in 13402 ms, average speed is 37.31 MiB/s 2018-08-03 16:20:36.679 7478 INF Overall average speed was 35.66 MiB/s |
About the configuration file (Feed Utility)
Feed Utility reads settings from a configuration file.
Editing the configuration file
If the configuration file is absent or does not follow the rules specified in this section, Feed Utility does not start and prints an error message.
We recommend that you create a backup copy of the Feed Utility configuration file before you make any changes in it. If Kaspersky CyberTrace does not work properly after you have reconfigured Feed Utility, replace the configuration file with its backup copy.
Configuration file location (Linux)
In Linux, the configuration file used by Feed Utility is named kl_feed_util.conf and is located in the %service_dir%/etc directory.
Configuration file location (Windows)
The configuration file used by Feed Utility is named kl_feed_util.conf and resides in the same directory as the Feed Utility binary file, %service_dir%/bin.
Encoding requirements
The Feed Utility configuration file, including all paths that it specifies, must be in UTF-8 encoding. If you use non-ASCII symbols in the configuration file, and the file is not in UTF-8 encoding, Feed Utility will not start.
Absolute and relative paths
When defining directories and files used by Feed Utility, you can use absolute and relative paths. If a relative path is specified, it is calculated from the directory that contains the Feed Utility binary file.
Page topConfiguration file parameters (Feed Utility)
Feed Utility reads the configuration parameters, feed rules, filtering rules, and parsing rules for feeds from the configuration file. This file is in XML format and has several groups of parameters.
The paths in the configuration file must contain only the characters used in the operating system locale, otherwise Feed Utility will not work.
Feed (feed rules, filtering rules, and parsing rules)
The Feed parameter contains rules for a particular feed. This element has several types of nested parameters:
- Feed rules specify how this particular feed must be processed by Feed Utility.
- Filtering rules are criteria that Feed Utility uses to filter the original feed files. Filtering rules are a part of feed rules for each feed.
- Parsing rules are rules for custom feeds (OSINT feeds, and other feeds that are not Kaspersky Threat Data Feeds). These parameters specify how each feed must be parsed by Feed Utility.
This parameter has the following attributes:
enabledSpecifies whether Feed Utility must download and process this feed.
If
enabledis true, Feed Utility downloads and processes the feed. Ifenabledis false, Feed Utility skips this feed.
The following example demonstrates how feed rules, filtering rules, and parsing rules are nested in the configuration file.
<Settings> ... <Feeds> ... <Feed enabled="true"> <Name>Malicious_Hash_Data_Feed</Name> <!-- Other feed rules for this feed --> <Filters> <Field name="popularity" value="4;5"/> <!-- Other filtering rules for this feed --> </Filters> </Feed> <Feed> <Name>Botnet_CnC_URL_Data_Feed</Name> <!-- Other feed rules for this feed --> <!-- This feed has no filtering rules --> </Feed> ... </Feeds> ... </Settings> |
FeedsDir
The FeedsDir parameter specifies the directory where Feed Utility puts processed feed files.
WorkDir
The WorkDir parameter specifies the directory where Feed Utility puts the downloaded and unpacked feed files.
If this parameter is not specified, Feed Utility uses the default temporary directory of the operating system.
WorkDir cannot be equal to FeedsDir.
CertFile
The CertFile parameter specifies the path to the certificate file. This certificate is used by Feed Utility to download feeds.
The certificate file must be in PEM format.
SourceIPs
The SourceIPs parameter specifies the IP addresses that are used by Feed Utility to download feeds.
This parameter is optional. If it is omitted or has an empty value, Feed Utility resolves Kaspersky server addresses by their domain names.
You can specify one or more IPv4 addresses in this parameter. To specify several IP addresses, use the semicolon (";") as a delimiter.
The following example demonstrates specifying IP addresses in the SourceIPs parameter.
<SourceIPs>192.0.2.1;192.0.2.2</SourceIPs> |
SourceDomains
The SourceDomains parameter specifies the domain names that are used by Feed Utility to download feeds.
You can specify one or more domain names in this parameter. To specify several domain names, use the semicolon (";") as a delimiter. Feed Utility will attempt to download feeds from the specified domain names in the order they appear in the configuration file.
When SourceDomains and SourceIP parameters are used together, domains specified in the SourceDomains parameter are used before IP addresses specified in the SourceIP parameter. If all attempts to download feeds fail, Feed Utility will generate an error message.
You can use Unicode symbols in this parameter.
The following example demonstrates specifying IP addresses in the SourceDomains parameter.
<SourceDomains>updates1.example.com;updates2.example.com</SourceDomains> |
CreateExternalFeedInfoList path="PATH"
This parameter is obsolete. It is ignored in the current version of Kaspersky CyberTrace.
The CreateExternalFeedInfoList parameter specifies whether a list of supported OSINT feeds must be generated. This parameter is mandatory.
If this parameter is 1, Feed Utility creates a list of supported OSINT feeds, osint_feed_list.conf, in a directory specified in the path attribute. If you added any custom or third-party feeds to Kaspersky CyberTrace, Feed Utility also creates a list of these feeds, custom_feed_list.conf, in the same directory as osint_feed_list.conf.
If this parameter is 0, Feed Utility does not create a list of supported OSINT feeds.
The following example demonstrates specifying a path where the list must be created. In this example, the list will be created in a directory where Feed Utility binary is located.
<CreateExternalFeedInfoList path=".">1</CreateExternalFeedInfoList> |
NotifyKTFS path="PATH"
The NotifyKTFS parameter specifies whether Feed Service must be notified about the feed updates.
This parameter can be used only with json output format.
If this parameter is 1, Feed Utility notifies Feed Service that the feeds must be reloaded. A path to the Feed Service binary file must be specified in the path attribute of this parameter.
If this parameter is 0, Feed Utility does not notify Feed Service.
EULA
The EULA parameter specifies whether the terms of the End User License Agreement (EULA) were accepted by a user.
If this value is accepted, the terms of the EULA were accepted.
If this value is rejected, the terms of the EULA were not accepted. In this case, Feed Utility cannot be used.
RetryCount
The RetryCount parameter specifies the number of attempts to download a Kaspersky Threat Data Feed. Feed Utility tries to re-download a feed when a connection timeout, partial downloading, and other errors occur.
If the specified number of attempts were unsuccessful, Feed Utility displays an error message and continues its operation.
This parameter is used only for Kaspersky Threat Data Feeds. OSINT feeds and other custom feeds will not be re-downloaded by Feed Utility.
This parameter is optional. If this parameter is not specified, Feed Utility uses the default value of 10.
If this parameter is 0, the number of attempts is not limited.
SequentialDownload
The SequentialDownload parameter specifies whether Feed Utility must download feeds in sequential or parallel mode.
If this value is 1 or true, Feed Utility downloads feeds in sequential mode, one by one.
If this value is 0 or false, Feed Utility downloads feeds in parallel mode, all feeds at the same time.
By default, this parameter has the value of 0.
OutputFormat
The OutputFormat parameter defines the output format for all feeds. This parameter can have the following values:
jsonThe feeds are in JSON format. The feed files have a .json extension.
This is the default value. If the
OutputFormatparameter is omitted, this value is used to define the output format.txtThe feeds are in plain text format (UTF-8 with BOM). The feed files have a .txt extension.
delimiterattributeIn this format, record fields are separated with a delimiter. The default delimiter is
";". To specify a custom delimiter, use thedelimiterattribute as follows:<OutputFormat delimiter="%delimiter%">txt</OutputFormat>Here, substitute
%delimiter%with a symbol that must be used as a delimiter.indicatorPerLineattributeTo output one record field per line, set the
indicatorPerLineattribute to 1 as follows:<OutputFormat indicatorPerLine="1">txt</OutputFormat>If you use this attribute, subfields specified in the
RequiredFieldsfeed rule must have the same parent field. For example,"files/MD5;files/SHA1"is valid, while"files/MD5;whois/domain"is invalid and will result in an error.
If this output format is specified, all feed rules in the configuration file must include a
RequiredFieldsparameter. TheRequiredFieldsparameter specifies the order in which the fields are written to the output feed.csvSame as
txt. The feed files have a .csv extension.You can use
delimiterandindicatorPerLineattributes.openiocThe feeds are in OpenIOC format. The feed files have an .ioc extension.
You can specify the version of the OpenIOC format in the
versionattribute: it can be either1.0, or1.1. If the attribute is omitted, version1.1is used.Converting feeds to OpenIOC 1.0 format has some restrictions. Phishing URL Data Feed and Malicious URL Data Feed cannot be converted to OpenIOC 1.0 format; an error message is printed instead. For other feeds, only hash and IP address fields are converted. Converting feeds to OpenIOC 1.1 format has no such restrictions.
Feeds in OpenIOC format take significantly more hard disk space than the original feed files.
stixThe feeds will be in STIX format. The files will have an .xml extension.
For STIX format, feeds with URL masks must have the
typefield.Feeds in STIX format take significantly more hard disk space than the original feed files.
The following example demonstrates how the OutputFormat parameter is nested in the configuration file.
<Settings> ... <Feeds> <OutputFormat>json</OutputFormat> ... </Feeds> ... </Settings> |
CreateDiff
The CreateDiff parameter specifies whether Feed Utility must create feed diffs. Feed diffs are files that contain differences between the old and new version of a processed feed file. This parameter affects all feeds created by Feed Utility as follows:
- If this parameter is
0, Feed Utility does not create feed diffs. This is the default value. - If this parameter is
1, Feed Utility creates feed diffs.
If CreateDiff is 1, and new versions of feeds are downloaded, two additional files are created for each feed (%feed_name% is the name of the feed file):
The %feed_name%_new.jsonfile contains records that were added to the new version of the feed file.The %feed_name%_del.jsonfile contains records that were deleted in the new version of the feed file.
Feed diffs can be created only for feeds in JSON format that are contained in a single file:
- The
OutputFormatparameter must have thejsonvalue. - For each feed, the
UrlMatcherFieldparameter must be omitted or have an empty value. - For each feed, the
RecordsCountparameter must not have theperFileattribute, or this attribute must have a value of0.
To create feed diffs, Feed Utility uses a key field in the old and new version of the feed:
- If this feed contains non-nested
id,MD5,ip,url, ordomainfield, this field is used as a key field. - If none of the fields above are present, Feed Utility attempts to search for a field with unique values across the feed. If this attempt is not successful, a warning is generated.
The following example demonstrates how the OutputFormat parameter is nested in the configuration file.
<Settings> ... <Feeds> ... <CreateDiff>0</CreateDiff> ... </Feeds> ... </Settings> |
ProxySettings
The ProxySettings parameter specifies proxy settings for Feed Utility. If you specify a proxy server, Feed Utility will download feeds using the specified parameters.
The user name and password for the proxy are stored in the Feed Utility configuration file. This information is not provided to Kaspersky.
Proxy settings are specified in the following parameters:
HostHost of the proxy server.
You can specify a domain name or an IP address in this parameter.
PortPort of the proxy server.
UserEncrypted user name for proxy server authentication.
If a proxy server does not require authentication, leave this parameter empty.
This parameter is stored encrypted. Use the
--set-proxycommand-line option to set this parameter. If you do not use this option and enter your user name as plain text, connection to the proxy server will not be established.PasswordEncrypted password for proxy server authentication.
If a proxy server does not require authentication, leave this parameter empty.
This parameter is stored encrypted. Use the
--set-proxycommand-line option to set this parameter. If you do not use this option and enter your password as plain text, connection to the proxy server will not be established.
The following example demonstrates how proxy settings are nested in the configuration file.
<Settings> ... <ProxySettings> <Host></Host> <Port></Port> <User></User> <Password></Password> </ProxySettings> ... </Settings> |
LogSettings
The LogSettings parameter defines how Feed Utility logs its activity.
If you enable logging, Feed Utility can write to the log files any of the following information that can be considered private, security-related, or sensitive: Feed Utility configuration parameters, proxy host and port, and operations performed while downloading and processing feeds.
If logging is enabled, Feed Utility writes to log files the information about free hard disk space that available for the work and feed directories. Also, starting from this version, an average speed that the feeds have while loading will be written to logs.
Log files are regular text files. All information written to the log files is not encrypted. The log files have standard inherited access rights. We recommend that you assign the directory for storing log files the appropriate rights so that only the administrator can read the log files.
Log files are stored until they are explicitly deleted by a user.
Feed Utility does not send log files or any data contained in them to Kaspersky. For technical support purposes, your technical account manager (TAM) can ask you to provide log files.
Logging settings are specified in the following parameters:
EnableLogEnables logging.
If this value is
1ortrue, Feed Utility logs its activity.If this value is
0orfalse, Feed Utility does not log its activity.LogsDirDirectory where Feed Utility stores its log files.
CleanOldLogEnables removal of old log files.
If this value is
0, upon initialization, Feed Utility keeps old log files.If this value is
1, upon initialization, Feed Utility deletes old log files.
The following example demonstrates how logging settings are nested in the configuration file.
<Settings> ... <LogSettings> <EnableLog>0</EnableLog> <LogsDir>logs</LogsDir> <CleanOldLog>1</CleanOldLog> </LogSettings> </Settings> |
Feed rules
Individual feed rules in the Feed elements specify how each feed must be processed by Feed Utility.
By default, the configuration file has entries containing feed rules for all feeds. Entries for commercial feeds are commented. If you use a commercial certificate to download feeds, uncomment the entries for feeds that are available with your certificate.
Example of feed rules
The following is an example of feed rules. Feed rules are specified individually for each feed.
<Settings> ... <Feeds> <Feed enabled="true"> <Name>Botnet_CnC_URL_Data_Feed</Name> <FeedID>65</FeedID> <Filters> <Field name="geo" value="RU"/> </Filters> <UrlMatcherField toRegex="false">mask</UrlMatcherField> <RequiredFields>mask;geo;first_seen;last_seen</RequiredFields> <RecordsCount perFile="100" total="1000" /> <FeedFields/> </Feed> <Feed enabled="false"> <Name>CustomFeed</Name> <Path>./custom_example/example_feed.json</Path> <Parsing type="json"> <MD5 type="MD5">files/MD5</MD5> </Parsing> <FeedFields/> </Feed> ... </Feeds> ... </Settings> |
Feed
This parent element contains feed rules for a feed. For more information about this parameter, see section "Configuration file parameters".
Name
This element specifies the name of the downloaded feed file.
After Feed Utility unpacks downloaded feeds, it searches for a file with a name that begins with a specified string. If several file names begin with the specified string, Feed Utility prints an error message and stops processing feeds. In this case, you must manually resolve this conflict, for example, by deleting the extra files from the directory where Feed Utility unpacks them. This directory is specified by the WorkDir parameter.
This parameter is case-insensitive.
This parameter must have a unique value. No two Feed elements can have the same value in this parameter.
FeedID
This element specifies the identifier of a feed. Feed Utility uses this parameter to download feeds from the update servers.
The enabled attribute specifies whether the feed must be processed by Feed Utility:
- If this attribute is
true, Feed Utility processes this feed. - If this attribute is
false, Feed Utility skips this feed.
Path
The Path parameter specifies the path and the file name for a custom or third-party feed.
Following value types are supported:
- Path and filename on the computer where Feed Utility binary is located.
- FTP or FTPS path and file name.
- HTTP or HTTPS URL.
- Network path (supported only in the Windows operating system).
This parameter has the following attributes:
certSpecifies the path to a certificate that will be used to download this feed via HTTPS or FTPS. This attribute is optional. If it is not specified, Feed Utility will not use a certificate.
Authentication type is provided in the Settings > Feeds > Feed parameter of the Feed Utility configuration file.
Authorization
Basic authentication settings for custom or third-party feeds.
This parameter has two nested elements:
UserEncrypted user name for basic authentication on a server from which the feeds are downloaded.
Use the
--set-basic-authcommand-line option to set this parameter. For STIX feeds that are downloaded from the TAXII server, use the--set-taxiioption.This element cannot be empty.
PasswordEncrypted password for basic authentication on a server from which the feeds are downloaded.
Use the
--set-basic-authcommand-line option to set this parameter. For STIX feeds that are downloaded from the TAXII server, use the--set-taxiioption.
If this type of authentication is not required, do not specify this parameter.
TAXII
The TAXII parameter specifies the location of a STIX feed. This element must contain the address of a Poll service of a TAXII server.
This parameter has the following attributes:
collection_nameThe name of the data collection for this STIX feed.
certPath to a certificate that must be used to download STIX feeds. This attribute must be used when downloading STIX feeds using the HTTPS or FTPS protocol.
The following example demonstrates specifying the location of a STIX feed:
<TAXII collection_name="example-collection">http://192.0.2.10:9000</TAXII> |
The following example demonstrates usage of this parameter:
<Feed> <Name>TAXII</Name> <TAXII collection_name="example-collection">http://192.0.2.10:9000</TAXII> <Authorization> <User>zQYq33rAY7dgImLtk8W0jQ==</User> <Password>OUYWpkPDoH+vv/IFfCrshw==</Password> </Authorization> </Feed> |
Filters
This element specifies filtering rules for the feed. Each filtering rule is defined in a Field element. For more information, see section "Filtering rules".
The Filters element is optional. If a Filters element contains no nested Field elements, Feed Utility treats this situation as if the Filters element is omitted. If there is no Filters element, no filtering is performed.
UrlMatcherField
This element defines how feeds with URL masks are processed by Feed Utility.
If you use Feed Utility as a part of CyberTrace together with Feed Service, feeds that contain URL masks must be converted to binary format.
If you use Feed Utility without Feed Service, you do not need to compile masks, so the UrlMatcherField element is not required in the FeedUtility configuration file.
This element has a value and an optional toRegex attribute:
- The value of this element specifies the name of the field in the feed that contains the URL mask.
- The optional
toRegexattribute of this element defines how the utility must process the feed.- If the
toRegexattribute is0,false, or is omitted, Feed Utility compiles the feed and creates binary files that can be used by Feed Service. - If the
toRegexattribute is1, ortrue, Feed Utility processes URL masks in the feeds so that they are converted to regular expressions.For each URL mask, Feed Utility creates a regular expression that matches all URLs covered by the URL mask. For example, if a URL mask is
botnet.example.com, the regular expression for it is((\/{2}|^)botnet\.example\.com(\/.*|$)). Like the URL mask, this regular expression matches all URLs in thebotnet.example.comdomain.The
toRegexattribute can be set to1only for those feeds that have thetypefield. Also, if theRequiredFieldselement is present among the feed rules, it must contain thetypefield.
- If the
For json output format, you can do the following:
- Compile feeds with URL masks to a binary file that can be used by Feed Service.
If you use Feed Service, the
UrlMatcherFieldelement is mandatory for feeds that contain URL masks: Malicious URL Feed, Phishing URL Feed, Botnet CnC URL Feed, and IoT URL Feed.<UrlMatcherField>%field_name%</UrlMatcherField> - Convert URL masks to regular expressions.
<UrlMatcherField toRegex=1>%field_name%</UrlMatcherField> - Do not convert URL masks.
Omit the
UrlMatcherFieldelement.
For csv and txt output formats, you can do the following:
- Convert URL masks to regular expressions.
<UrlMatcherField toRegex=1>%field_name%</UrlMatcherField> - Do not convert URL masks.
Omit the
UrlMatcherFieldelement.
For openioc and stix output formats, omit this element. You cannot use this element with these output formats.
RequiredFields
This element specifies fields that are included in the processed feed. This element is mandatory for txt and csv output formats. If the RequiredFields element is omitted, all fields of a record are written to the processed feed.
Field names are separated by a semi-colon (";"). The slash ("/") in a field name indicates a nested field (in terms of JSON format).
This element defines fields in the resulting feed; it does not work like a filtering rule. For example, if a <RequiredFields>id;mask</RequiredFields> feed rule is defined for a feed, the records in the processed feed will have only id and mask fields. Records that have at least one of the specified fields (id or mask) will also be included. Records that do not have at least one of the specified fields will be excluded because the absence of specified fields results in an empty record written to the processed feed. If you want to filter a feed so that only records with all the specified fields are included in resulting feed, you must use filtering rules. For information about using the RequiredFields element together with filtering criteria, see subsection "Excluding records with missing fields" in the "Filtering rules" section.
Record fields are written to csv and txt formats in the order they are listed in the RequiredFields element. Record fields are written in json format in the order in which they appear in the source feed. For openioc and stix formats, the order of records is not defined; records are written in the order of processing.
FeedFields
This element lists all fields present in a feed.
Do not change this parameter. Feed Utility automatically writes field values to it.
RecordsCount
This element specifies the maximum number of records that will be included in the processed feed.
This element has two attributes:
- The
totalattribute of this element defines the total number of first-level records that must be included in the processed files. Feed Utility includes only those records that match the filtering rules. If this value is0, this number is not limited, and all records are included.Note that the
totalattribute refers to first-level records, so the processed feed can contain more nested records than the value oftotal. For example, the original feed contains the following data:[
{
"time": "23.02.1992 15:43",
"urls":[
{
"url" : "http://url.biz/sample1"
},
{
"url" : "http://url.biz/sample2"
}
]
},
{
"time": "24.02.1992 15:43",
"urls":[
{
"url" : "http://url.biz/sample3"
},
{
"url" : "http://url.biz/sample4"
}
]
}
]
You can specify the following settings for this feed in the Feed Utility configuration file:
<OutputFormat>csv</OutputFormat>
<RequiredFields>urls/url</RequiredFields>
<RecordsCount total="1" />
The processed feed will contain two records because they are nested in one first-level record.
http://url.biz/sample1
http://url.biz/sample2
- The
perFileattribute of this element defines the maximum number of records that must be included in a single file. If the total number of records in one processed feed file is greater than this value, Feed Utility creates an additional feed file.For example, if
totalis1000,perFileis300, and Feed Utility finds 650 records that match filtering rules, then three files are created (two files with 300 records and one with 50 records).This attribute cannot be used in the following cases:
- The
perFileattribute cannot be used for feeds with URL masks that are compiled into binary format. - The
perFileattribute cannot be used with custom feeds that have parsing rules with thetypeattribute set tourlordomaintypes. Such feeds are also compiled into binary format by Feed Utility. To use theperFileattribute for these types of fields, you must change the field type tocontext.
- The
Parsing
This element contains parsing rules for custom feeds. For more information, see section "Parsing rules".
Page topFiltering rules
Filtering rules are criteria that Feed Utility uses to filter the original feed files.
Filtering rules are specified for each feed in a Filters element. Each filtering rule is set in a Field element: the field name is specified in the name attribute and the filtering criteria are specified in the value attribute. A field can have only one filtering rule associated with it; you cannot have two Field parameters for one field.
The following is an example of filtering rules for a feed. These rules specify that the output feed must include only records that have the popularity field equal to 4 or 5 and the mask field containing .ru or .com.
<Feed> ... <Filters> <Field name="popularity" value="4;5"/> <Field name="mask" value=".ru;.com"/> </Filters> ... <Feed> |
Feed Utility ignores leading and terminating space symbols, or tab symbols in the value of the "value" attribute.
Only those records that match all the specified criteria are included in the output file. If a filtering criterion is specified for a field, and the field is missing from a record, Feed Utility will not include this record in the output file.
Defining filtering criteria for numeric values
Numeric values are integers. Decimal values are not supported.
You can define filtering criteria for numeric fields in the following ways:
value="*"A field can have any value.
For example,
<Field name="type" value="*"/>means that thetypefield can have any value.value="%value%"Exact numeric value. A field must be equal to
%value%.For example,
<Field name="popularity" value="1"/>means that thepopularityfield must be equal to1.value="%value1%;%value2%"One of several numeric values. A field can have one of the specified numeric values (
%value1%or%value2%).You can specify additional values using
";"as a delimiter.For example,
<Field name="popularity" value="1;3"/>means that thepopularityfield must be equal to1or3, but not2.value="[%value1%;%value2%]"Range of numeric values.
A field can have one of the values in the specified range between
%value1%and%value2%.For example,
<Field name="popularity" value="[1;3]"/>means that thepopularityfield must have a value from1to3, including2.value="[%value1%;*]"orvalue="[*;%value1%]"Open range of numeric values. Same as range, but an asterisk (
*) specifies infinity.For example,
<Field name="popularity" value="[2;*]"/>means that the value of thepopularityfield must be greater than or equal to2.
Defining filtering criteria for strings
You can define filtering criteria for string fields in the following ways:
value="*"A field can have any value.
For example,
<Field name="mask" value="*"/>means that themaskfield can have any value.- value="
%string%"A field must contain the specified string.
For example,
<Field name="geo" value="ru"/>means that the value of thegeofield must contain"ru". value="%string1%;%string2%"Contains one or more of the specified strings.
For example,
<Field name="geo" value="ru;us"/>means that the value of thegeofield must contain"ru"or"us", or both"ru"and"us".
Defining filtering criteria for dates
Date values in feeds are formatted either in the pattern "DD.MM.YYYY" (for example, "26.04.2014"), in the pattern "YYYY-MM-DD" (for example "2014-04-26"), or in the pattern "MM/DD/YYYY" (for example, "04/26/2014").
You can define filtering criteria for fields with dates in the following ways:
value="*"A field can have any value.
For example,
<Field name="last_seen" value="*"/>means that thelast_seenfield can have any value.value="%date%"A field must contain the specified date.
For example,
<Field name="first_seen" value="14.10.2015"/>means that thefirst_seenfield value must be 14 October 2015.value="[%date1%;%date2%]"A field must contain the date in the specified range.
For example,
<Field name="first_seen" value="[01.02.2013;01.02.2015]"/>means thefirst_seenfield value must be from 1 February 2013 to 1 February 2015.value="[%date1%;*]"orvalue="[*;%date1%]"Open range of dates. Same as range of dates, that is,
value="[%date1%;%date2%]". But an asterisk (*) specifies infinity.For example,
<Field name="first_seen" value="[*;10.12.2015]"/>means that thefirst_seenfield value must be on or before 10 December 2015.
Excluding records with missing fields
In the original feed files, some records can have extra fields or can lack some fields. For records with extra fields, Feed Utility includes only those fields that are specified in the RequiredFields element of feed rules for a specified feed. For records that lack some fields, Feed Utility includes such records in the output if they contain at least one of the fields specified in the RequiredFields element. If some fields specified in the RequiredFields element are missing from a record in the original feed, the record in the processed feed will not contain them.
If you want to exclude records with missing fields from the output, you must create filtering rules for all required fields.
In the following example, Feed Utility will include records that have popularity, or mask, or both popularity and mask, fields.
<RequiredFields>popularity;mask</RequiredFields> |
If you want Feed Utility to include only those records that have both popularity and mask, create a filtering rule for both fields. You can specify criteria for field values, or use an asterisk (*) to specify any value.
In the following example, only records that have both fields (mask and popularity) are included in the resulting feed.
<Filters> <Field name="popularity" value="*"/> <Field name="mask" value="*"/> </Filters> <RequiredFields>popularity;mask</RequiredFields> |
You can specify exact criteria, in the same manner. The following example instructs Feed Utility to include only records that have the popularity field with a value of 5 and the mask field with any value.
<Filters> <Field name="popularity" value="5"/> <Field name="mask" value="*"/> </Filters> <RequiredFields>popularity;mask</RequiredFields> |
Parsing rules
Parsing rules are rules for custom feeds (feeds that are specified using the Path element). These parameters specify how each feed must be parsed by Feed Utility.
Parsing rules are defined in the Parsing element of feed rules for a custom feed.
The following is an example of parsing rules for a custom feed. These rules specify that the input feed is in JSON format. An MD5 parsing rule is defined for the files/md5 field in the input feed. Values in this field will be parsed as MD5 hashes.
<Feed> ... <Parsing type="json"> <MD5 type="MD5">files/md5</MD5> </Parsing> ... <Feed> |
Parsing element
The parent element, Parsing contains all nested parsing rules. Its attributes define the input format.
This element has the following attributes:
typeSpecifies the input feed type.
This attribute can have the following values:
json,stix,csv,xml,misp.delimiterSpecifies the delimiter for CSV input feeds. By default, this value is '
;'.rootElementSpecifies the root element path for XML input feeds.
You can use the '
*' and '?' wildcard characters as substitutes for any other character or group of characters. The '*' wildcard character can be used for a group of characters. The '?' wildcard character can be used for a single character.You cannot specify parts of the
rootElementpath with wildcard symbols only. For example,"Feeds/*/Contents"is invalid.
The following example demonstrates how to use the Parsing element for an XML input feed. In this case, parsing rules will be applied to elements nested inside the Feeds > Example > Contents element.
<Feed> ... <Parsing type="xml" rootElement="Feeds/Example/Contents"> ... </Parsing> ... <Feed> |
Individual parsing rules
Parsing rules for individual fields of an input feed must be nested inside the Parsing element. When Feed Utility processes the input feed, it creates the fields of the output feed according to these rules.
Each rule has the following format:
<OUTPUT_NAME type="VALUE_TYPE">INPUT_NAME</OUTPUT_NAME>
Above, the following rule name elements are used:
- OUTPUT_NAME defines the name of the field in the output feed. For example, if OUTPUT_NAME is MD5, the field with this value will also be named MD5 in the output feed.
OUTPUT_NAME preserves nested fields. If a field specified in the INPUT_NAME is nested, the field in the output feed will also be nested. For example, if OUTPUT_NAME is MD5_HASH and INPUT_NAME is files/md5, the field in the output feed will be files/MD5_HASH.
For JSON input feed, OUTPUT_NAME must always use the
Fieldvalue. Feed Utility uses the field names from the original feed. - VALUE_TYPE is the type of the values stored in this field.
These values will be handled by Feed Utility according to the specified type. For example, if the output feed contains domain names and URLs, then it will be compiled to the binary format.
Following value types are possible:
url—This value type is used for URLs.ip—This value type is used for IP addresses.md5—This value type is used for MD5 hashes.sha1—This value type is used for SHA1 hashes.sha256—This value type is used for SHA256 hashes.domain—This value type is used for domain names.context—This value type is used for context information.
- INPUT_NAME is the name of the field in the input feed. It must be defined according to the input feed format:
- For JSON input feeds, INPUT_NAME must contain the name of the field from the input feed. Nested fields must be delimited by '
/'. - For CSV input feeds, INPUT_NAME must contain the column number.
- For XML input feeds, INPUT_NAME must contain a path to one of the nested elements of the root element. Root element is defined in the
rootElementattribute ofParsingelement. The path is case sensitive. - For STIX and MISP input feeds,
Parsingelement must contain no parsing rules.
- For JSON input feeds, INPUT_NAME must contain the name of the field from the input feed. Nested fields must be delimited by '
The following example demonstrates parsing rule syntax for JSON input format:
<Feed> ... <Parsing type="json"> <Field type="url">URL</Field> <Field type="ip">IP</Field> <Field type="context">GEO</Field> <Field type="md5">files/md5</Field> </Parsing> ... <Feed> |
The following example demonstrates parsing rule syntax for CSV input format:
<Feed> ... <Parsing type="csv" delimiter=";"> <URL type="url">1</URL> <IP type="ip">2</IP> <GEO type="context">3</GEO> <MD5 type="md5">4</MD5> </Parsing> ... <Feed> |
The following example demonstrates parsing rule syntax for XML input format:
<Feed> ... <Parsing type="xml" rootElement="Feeds/Example/Contents"> <URL type="url">url</URL> <IP type="ip">ip</IP> <GEO type="context">context</GEO> <MD5 type="md5">md5_hash</MD5> </Parsing> ... <Feed> |
Feed Utility return codes
After Feed Utility finishes its execution, it indicates success, partial success, or failure with a return code. A return code can have one of the values described below.
Return code values
Feed Utility returns the following values:
0Success.
All the actions were successfully performed by Feed Utility.
For example, Feed Utility is configured to download and process two feeds, and both feeds were successfully downloaded and processed.
1Failure.
All the actions performed by Feed Utility failed or could not be performed.
For example, Feed Utility is configured to download and process two feeds, and Feed Utility could not download any feeds because of a network error.
This value is returned when no records are written to any of the processed feed files because of the filtering rules.
2Partial success.
Some of the actions were successfully performed by Feed Utility.
For example, Feed Utility is configured to download and process two feeds, and Feed Utility successfully downloaded and processed only one of the feeds.
This value is also returned when no records are written to one of the resulting feed files because of the filtering rules.
3Nothing to download.
This value is returned in the following cases:
- Feeds were not downloaded and processed by Feed Utility (when the value of the
enabledattribute in the Feed Utility configuration file isfalse) - Feeds were not updated because the latest version of feeds is already present
- Feeds were not downloaded and processed by Feed Utility (when the value of the
Output example (Linux)
The following example demonstrates receipt of a return code after Feed Utility has finished downloading and processing feeds. In this example, Feed Utility returns a value for partial success, because filtering rules for Botnet CnC URL Data Feed do not match any records in the original feed.
/opt/feed_util/bin $ ./kl_feed_util
2017-04-10 16:30:48.568 KL Feed Utility, version: 1.0.37.0/Release 2017-04-10 16:30:50.811 feed #66(Malicious_Hash_Data_Feed) version 2017-04-10T13:22:16.92 is available 2017-04-10 16:30:50.821 feed #65(Botnet_CnC_URL_Data_Feed) version 2017-04-10T13:23:33.403 is available 2017-04-10 16:30:57.912 update of feed #65(Botnet_CnC_URL_Data_Feed) is extracted to /opt/feed_util/bin/tmp/Botnet_CnC_URL_Data_Feed.json 2017-04-10 16:31:09.448 update of feed #66(Malicious_Hash_Data_Feed) is extracted to /opt/feed_util/bin/tmp/Malicious_Hash_Data_Feed.json 2017-04-10 16:31:09.449 2 of 2 feeds downloaded 2017-04-10 16:31:14.984 failed to process feed #65(Botnet_CnC_URL_Data_Feed): there is nothing to write with the current filtration settings 2017-04-10 16:31:35.610 1 of 2 feeds processed
/opt/feed_util/bin $ echo $?
2 |
Output example (Windows)
The following example demonstrates receipt of a return code after Feed Utility has finished downloading and processing feeds. In this example, Feed Utility returns a value for partial success, because filtering rules for Botnet CnC URL Data Feed do not match any records in the original feed.
C:\feed_util\bin>call kl_feed_util.exe && (echo Success.) || (echo Error or partial success.)
2017-05-03 15:56:08.393 KL Feed Utility, version: 1.0.56.0/Release 2017-05-03 15:56:08.656 feed #87(Demo_IP_Reputation_Data_Feed) version 2017-03-28T10:59:41.05 is available 2017-05-03 15:56:08.692 feed #85(Demo_Botnet_CnC_URL_Data_Feed) version 2017-03-28T10:57:25.897 is available 2017-05-03 15:56:09.679 update of feed #87(Demo_IP_Reputation_Data_Feed) is extracted to C:\feed_util\bin\tmp\Demo_IP_Reputation_Data_Feed.json 2017-05-03 15:56:09.900 update of feed #85(Demo_Botnet_CnC_URL_Data_Feed) is extracted to C:\feed_util\bin\tmp\Demo_Botnet_CnC_URL_Data_Feed.json 2017-05-03 15:56:09.915 2 of 2 feeds downloaded 2017-05-03 15:56:09.929 start processing of feed #85(Demo_Botnet_CnC_URL_Data_Feed) 2017-05-03 15:56:09.939 start processing of feed #87(Demo_IP_Reputation_Data_Feed) 2017-05-03 15:56:09.980 failed to process feed #85(Demo_Botnet_CnC_URL_Data_Feed): there is nothing to write with the current filtration settings 2017-05-03 15:56:10.028 1 of 2 feeds processed Error or partial success. |
Using Password Utility
The Password Utility is a tool that allows you to reset the password for the admin account.
For default user name and password, see section "Logging in to CyberTrace".
Location
Use the following path to find the Password Utility:
- On Windows systems:
%service_dir%\tools\kl_access_util.exe - On Linux systems:
%service_dir%/tools/kl_access_util
Here %service_dir% is the directory where Kaspersky CyberTrace is installed.
Syntax
When you use this utility to reset the admin account, all other user accounts are deleted.
The Password Utility uses the following syntax:
- On Windows systems:
kl_access_util.exe [[--help|-h] | [--reset_default_user|-r] | [--version|-v]] - On Linux systems:
./kl_access_util [[--help|-h] | [--reset_default_user|-r] | [--version|-v]]
Options
The following table explains the command-line options.
Command-line options of kl_access_util
Option |
Description |
|
Prints the usage message to the screen. If this option is specified, all other options are ignored. |
|
Resets the password for the |
|
Prints the version information. |
Choosing the best feeds for your environment
You can reduce the load on your system by choosing the right feeds for your environment. Kaspersky CyberTrace Web allows you to compare the feeds that you use, and find and disable feeds that are not effective for your environment.
Effective feeds
Following are characteristics that can help you recognize effective feeds for your solution:
- High number of detections
- Frequent updates
The feeds that are updated frequently contain more accurate information.
Ineffective feeds
Following are characteristics that can help you recognize ineffective feeds for your solution:
- Many of the objects that are detected correctly are not harmful in your environment
- Many of the detections are false positives
- The feed contains a lot of records, but produces a low number of detections
Comparing feeds
To choose the best feeds for your solution, you can evaluate them by using the following criteria:
- Number of detections
- Number of false positives
- Number of records
- Update frequency
You can compare different characteristics of feeds by looking at the Dashboard of Kaspersky CyberTrace Web.
- To compare the number of detections, number of false positives, and number of records of different feeds, see tables and charts in the Supplier statistics section on the Dashboard tab of Kaspersky CyberTrace Web.
- To learn which types of indicators are frequently detected in your environment, see tables and charts in the Indicator statistics section.
Viewing feed fields
To decide whether to use a feed, you may want to see the list of its available fields. You can view the list of fields of a particular feed in the Kaspersky CyberTrace Web user interface.
To view the list of fields of a particular feed:
- Open the Settings tab of Kaspersky CyberTrace Web.
- Select the Feeds tab.
- Click the name of the feed to view its properties.
Upgrading and managing the installation
This section describes how to manage the Kaspersky CyberTrace installation after Kaspersky CyberTrace is installed.
Managing the installation on Linux systems
You can use the installation script to manage the RPM or DEB installation of Kaspersky CyberTrace.
The installation script can do the following:
- Install Kaspersky CyberTrace
- Upgrade Kaspersky CyberTrace
- Uninstall Kaspersky CyberTrace
- Change the Kaspersky CyberTrace configuration
Installation script command-line parameters
The installation script has the following command-line syntax:
run.sh [command]
Following commands are available:
helpDisplays the help message and exits.
installInstalls Kaspersky CyberTrace.
The installation script installs the software package and runs the configurator binary file. The configurator binary file performs an interactive setup of Feed Service, Feed Utility, and Log Scanner.
upgradeUpgrades Kaspersky CyberTrace from a previous version.
The installation script upgrades the software package, copies settings from the previous version of Feed Service, Feed Utility, and Log Scanner, and runs the configurator binary file.
removeRemoves (uninstalls) Kaspersky CyberTrace.
The installation script uninstalls the software package, removes the
/opt/kaspersky/ktfsdirectory, removes Feed Service from a list of system services, and removes crontab entries for Feed Service.changeChanges the Kaspersky CyberTrace configuration.
The installation script runs the configurator binary. The configurator binary performs an interactive setup of Feed Service, Feed Utility, and Log Scanner. For more information about the interactive setup, see subsection "Interactive setup with configurator" in section "Installation on Linux systems".
You can remove the specified proxy settings and stop using a proxy through Kaspersky CyberTrace Web.
Examples
The following command installs Kaspersky CyberTrace.
./run.sh install |
The following command upgrades Kaspersky CyberTrace.
./run.sh upgrade |
The following command uninstalls Kaspersky CyberTrace.
./run.sh remove |
The following command changes the Kaspersky CyberTrace configuration.
./run.sh change |
Managing the installation on Windows systems
You can use the executable installer to manage the installation of Kaspersky CyberTrace.
Executable installer options
The executable installer can do the following:
- Install Kaspersky CyberTrace
To install Kaspersky CyberTrace, run the executable installer and follow the instructions of the Kaspersky CyberTrace Setup Wizard.
- Uninstall Kaspersky CyberTrace
If you have an existing Kaspersky CyberTrace installation, running the executable installer enables the Remove button in the Kaspersky CyberTrace Setup Wizard. Clicking this button will uninstall Kaspersky CyberTrace from your computer.
When the existing installation is removed, all subdirectories and files in the installation directory are removed as well.
- Change the Kaspersky CyberTrace configuration
If you have an existing Kaspersky CyberTrace installation, running the executable installer enables the Change button in the Kaspersky CyberTrace Setup Wizard. Clicking this button allows you to reconfigure your installation of Kaspersky CyberTrace. Use this option if you want to change the installation settings or if the list of feeds available to you has been changed.
To be able to reconfigure the Kaspersky CyberTrace installation, run the executable installer as Administrator.
Upgrading Kaspersky CyberTrace from a previous version
This section describes how to upgrade Kaspersky CyberTrace from a previous version.
About the upgrade process
The upgrade process described in this section applies to Kaspersky CyberTrace versions 3.1.0 and above. If you have an older version of Kaspersky CyberTrace or Kaspersky Threat Feed Service, contact your Technical Account Manager (TAM).
You upgrade Kaspersky CyberTrace in two steps:
- Upgrade binary and other files.
- Upgrade the integration of Kaspersky CyberTrace with the SIEM solution.
This step is not relevant for Log Scanner.
How to learn the version of Kaspersky CyberTrace
You can find out the version of Kaspersky CyberTrace as follows:
- In Windows, view the version property of the kl_feed_service.exe binary file.
- In Linux, run the following command:
%service_dir%/bin/kl_feed_service -v
Upgrading automatically from 3.1 to 4.0 (Linux)
This section describes how to upgrade Kaspersky CyberTrace on Linux.
The instructions below apply to the RPM/DEB package installations.
Updating from 3.1 to 4.0
To upgrade Kaspersky CyberTrace automatically to a newer version:
- Run the following command with root privileges:
run.sh upgrade - At the beginning of the upgrade process, accept the request to stop Feed Service. If you decline to stop it, the upgrade fails.
At the end of the upgrade process, all the settings, user accounts data, available feeds, and certificates will be automatically transferred to the new version. If you have a commercial license key, you can add it to Kaspersky CyberTrace by using the Licensing tab.
After the upgrade process is finished, the actionable fields are not specified for new feeds that were not supported in the previous version. If needed, specify these fields manually on the Settings > Feeds tab.
Make sure that
/opt/kaspersky/ktfs/etc/kl_feed_service.confcontains only a single copy of the FalsePositive and InternalTI suppliers with corresponding standard names (Black_List.json and White_List.json). If not, the script displays an error and exits.After you finish the upgrade process, Feed Service will be launched automatically.
Note that the automatic upgrade functionality is available only if you have accepted the EULA in the installation that is being upgraded.
Page topUpgrading automatically from 3.1 to 4.0 (Windows)
This section describes how to upgrade Kaspersky CyberTrace on Windows.
The instructions below apply to installations done by using the executable installer.
Upgrading from 3.1 to 4.0
To upgrade Kaspersky CyberTrace automatically to a newer version:
- Run the executable installer that starts the upgrading process automatically.
- At the beginning of the upgrade process, accept the request to stop Feed Service. If you decline to stop it, the upgrade fails.
If Feed Service is stopped and the upgrade continues, all the settings, user accounts data, available feeds, and certificates will be automatically transferred to the new version. If you have a commercial license key, you can add it to Kaspersky CyberTrace on the Licensing tab.
After the upgrade process is finished, the actionable fields are not specified for new feeds that were not supported in the previous version. If needed, specify these fields manually on the Settings > Feeds tab.
Make sure that
/opt/kaspersky/ktfs/etc/kl_feed_service.confcontains only a single copy of the FalsePositive and InternalTI suppliers, with corresponding standard names (Black_List.json and White_List.json). If not, the installer displays an error and exits. - Change the settings during the upgrade process, if necessary.
After you finish the upgrade process, Feed Service will be launched automatically.
Note that automatic upgrade with the executable installer is available only if you have accepted the EULA in the installation that is being upgraded.
Page topUpgrading Kaspersky CyberTrace integration (QRadar)
This section describes how to finish the integration of Kaspersky CyberTrace with QRadar after the upgrade of the Kaspersky CyberTrace files.
The upgrade process described in this section applies to Kaspersky CyberTrace versions 3.1.0 and above. If you have an older version of Kaspersky CyberTrace or Kaspersky Threat Feed Service, contact your Technical Account Manager (TAM).
Finishing the integration of Kaspersky CyberTrace with QRadar consists of the following actions:
- Adding support of ICS Hash Data Feed
- Adding support of new alert events
- Adding events that correspond to new categories for APT feeds
- Adding events that correspond to new categories for the Internal TI list
In Kaspersky CyberTrace version 4.0, these categories are used instead of the following:
- KL_BlackList_URL
- KL_BlackList_IP
- KL_BlackList_Hash_MD5
- KL_BlackList_Hash_SHA1
- KL_BlackList_Hash_SHA256
If QRadar automatically receives configuration updates (including configuration file changes, vulnerabilities, QID maps, supportability scripts, and security threat information updates), the following features are included:
- Support of ICS Hash Data Feed
- Support of new alert events
- New categories of APT feeds
- New categories of the Internal TI list
Perform the procedure above manually only if it does not receive configuration updates automatically. To add these categories to QRadar, perform the actions described in sections "Importing QIDs to QRadar", "Sending a set of events to QRadar", and "Mapping events to QIDs". The categories mentioned above are included in the sample_initiallog.txt and sample_qid.txt files of the latest distribution kit of CyberTrace.
To finish the integration of Kaspersky CyberTrace with QRadar:
- Add the following categories to support ICS Hash Data Feed:
- KL_ICS_Hash_MD5
- KL_ICS_Hash_SHA1
- KL_ICS_Hash_SHA256
- Add new alert events:
- KL_ALERT_RetroScanError
- KL_ALERT_RetroScanCompleted
- KL_ALERT_RetroScanStorageExceeded
- KL_ALERT_IndicatorsStoreLimitExceeded
- KL_ALERT_IndicatorsStoreHardLimit
- KL_ALERT_FreeSpaceEnds
- Add new categories to support APT feeds:
- KL_APT_Hash_SHA1
- KL_APT_Hash_SHA256
- Add new categories to support the Internal TI list:
- KL_InternalTI_URL
- KL_InternalTI_IP
- KL_InternalTI_Hash_MD5
- KL_InternalTI_Hash_SHA1
- KL_InternalTI_Hash_SHA256
Upgrading Kaspersky CyberTrace integration (Splunk)
This section describes how to finish the integration of Kaspersky CyberTrace with Splunk after the upgrade of the Kaspersky CyberTrace files.
When upgrading the integration of Kaspersky CyberTrace with Splunk to version 3.1.0, import the new version of Kaspersky CyberTrace App for Splunk to Splunk. During the import, select the option shown in the picture below.

The application settings will be reset. The old settings will be saved in %SPLUNK_DIRECTORY%/etc/apps/Kaspersky-CyberTrace-App-for-Splunk/default.old.%CURRENT_DATE%, where %CURRENT_DATE% can be in the format yyyymmdd-hhmmss (for example, 20190725-161423). Kaspersky CyberTrace App for Splunk must be configured in its entirety, similarly to the way in which the old version was configured.
Upgrading Kaspersky CyberTrace integration (ArcSight)
This section describes how to finish the integration of Kaspersky CyberTrace with ArcSight after the upgrade of the Kaspersky CyberTrace files.
When upgrading the integration of Kaspersky CyberTrace with ArcSight to version 3.1.0, you must import a new version of the ARB package. During the import, you have to accept an upgrade of the current ARB package.
Page topUpgrading Kaspersky CyberTrace integration (RSA)
This section describes how to finish the integration of Kaspersky CyberTrace with RSA NetWitness after the upgrade of the Kaspersky CyberTrace files.
When upgrading the integration of Kaspersky CyberTrace with RSA NetWitness to version 3.1.0, import the cybertrace.ini and v20_cybertracemsg.xml files from the %service_dir%/integration/rsa/cybertrace directory to Log Decoder. After the import, restart Log Decoder.
If you update the v20_cybertracemsg.xml file, make sure that the actionable fields are specified for all feeds in use. For the full list of such fields, see section "Step 2. Sending events from Feed Service to RSA NetWitness".
Upgrading Kaspersky CyberTrace integration (LogRhythm)
This section describes how to finish the integration of Kaspersky CyberTrace with LogRhythm after the upgrade of the Kaspersky CyberTrace files.
Finishing the integration of Kaspersky CyberTrace with LogRhythm consists of the following steps:
- Adding new events to LogRhythm
- Removing obsolete events from LogRhythm
Step 1. Adding new events
To add new events to LogRhythm:
Add the following categories and alert events automatically or manually (as described in sections "Step 3 (optional). Adding Kaspersky CyberTrace events" and "Step 4 (optional). Adding Kaspersky CyberTrace rules"):
- KL_ICS_Hash_MD5
- KL_ICS_Hash_SHA1
- KL_ICS_Hash_SHA256
- KL_APT_Hash_SHA1
- KL_APT_Hash_SHA256
- KL_ALERT_RetroScanError
- KL_ALERT_RetroScanCompleted
- KL_ALERT_RetroScanStorageExceeded
- KL_ALERT_IndicatorsStoreLimitExceeded
- KL_ALERT_IndicatorsStoreHardLimit
- KL_ALERT_FreeSpaceEnds
- KL_InternalTI_URL
- KL_InternalTI_IP
- KL_InternalTI_Hash_MD5
- KL_InternalTI_Hash_SHA1
- KL_InternalTI_Hash_SHA256
Step 2. Removing obsolete events
To remove obsolete events from LogRhythm:
- Run LogRhythm Console.
- Select Deployment Manager > Tools > Knowledge > MPE Rule Builder.
The Rule Builder form opens.
- Click the Open rule library () button.
- Double-click the rule you want to retire.
A preview window for the rule opens.
Rules for the following events must be retired:
- KL_BlackList_URL
- KL_BlackList_IP
- KL_BlackList_Hash_MD5
- KL_BlackList_Hash_SHA1
- KL_BlackList_Hash_SHA256
- KL_ALERT_FeedLoadedPartially
- Click the Retire rule (
 ) button.
 - In the Verify Retire window, click Yes.
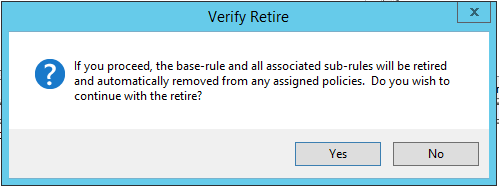
Verify Retire window
Uninstalling Kaspersky CyberTrace
This section describes how to uninstall Kaspersky CyberTrace.
Uninstalling Kaspersky CyberTrace (Windows)
This section contains the uninstallation procedures for Kaspersky CyberTrace on Windows. After you uninstall Kaspersky CyberTrace, remove objects related to it from your SIEM solution.
Uninstalling Kaspersky CyberTrace (executable installer)
The following procedure describes how to uninstall the copy of Kaspersky CyberTrace that was installed by using the executable installer.
To unistall Kaspersky CyberTrace:
- Run the executable installer of Kaspersky CyberTrace.
The Kaspersky CyberTrace Setup Wizard starts.
- Click Remove.
- Follow the Wizard instructions.
Uninstalling Kaspersky CyberTrace (Linux)
This section contains the uninstallation procedures for Kaspersky CyberTrace on Linux. After you have performed uninstallation, remove objects related to Kaspersky CyberTrace from your SIEM solution.
Uninstalling (RPM and DEB installation)
Following is the procedure for uninstalling Kaspersky CyberTrace installed by using the DEB or RPM installation package.
To uninstall Kaspersky CyberTrace:
- Run the following command:
%service_dir%/run.sh remove - Follow the Wizard instructions.
Uninstalling (.tgz installation)
Following is the procedure for uninstalling Kaspersky CyberTrace installed from the .tgz archive.
To uninstall Kaspersky CyberTrace:
- Remove entries for Feed Service from crontab.
- Stop Feed Service by running the following commands:
systemctl stop cybertrace.servicesystemctl stop cybertrace_db.service - Remove Feed Service from the list of services started on boot by running the following commands:
systemctl disable cybertrace.servicesystemctl disable cybertrace_db.service - Remove the
%service_dir%directory together with its contents.
Removing Kaspersky CyberTrace objects (QRadar)
This section describes how to remove objects related to Kaspersky CyberTrace from QRadar after Kaspersky CyberTrace is uninstalled. Note that after you have removed these objects, events from Kaspersky CyberTrace persist in QRadar.
After you have uninstalled Kaspersky CyberTrace, uninstall Kaspersky Threat Feed App (if it is installed). If you will not install Kaspersky CyberTrace in future, you can also remove log sources related to Kaspersky CyberTrace (it can be the KL_Threat_Feed_Service_v2 and KL_Verification_Tool log sources).
To remove a log source from QRadar:
- In QRadar, select Admin, and under Data Sources select Log Sources.
The Log Sources window opens.
- Select the log source that you want to remove and click Delete.
Removing Kaspersky CyberTrace objects (Splunk)
This section describes how to remove objects related to Kaspersky CyberTrace from Splunk after Kaspersky CyberTrace is uninstalled. Note that after you have removed these objects, events from Kaspersky CyberTrace persist in Splunk.
After you have uninstalled Kaspersky CyberTrace, delete the %SPLUNKDIR%/etc/apps/Kaspersky-CyberTrace-App-for-Splunk directory, which contains Kaspersky CyberTrace App for Splunk, and restart Splunk. (Here %SPLUNKDIR% is the directory to which Splunk is installed.) You can restart Splunk either by using the GUI or by running the following command:
%SPLUNKDIR%/bin/splunk restart
Then, if you want, you can clear Splunk of events received from Kaspersky CyberTrace.
To clear Splunk of events received from Kaspersky CyberTrace:
- Run the Search & Reporting app by clicking its button in the Splunk GUI.
- Delete the events from Kaspersky CyberTrace:
- In the Search field, type the following command:
index="main" sourcetype="kl_cybertrace_events" | deleteDeleting events from the
mainindex can be done only under the user account that has thecan_deleterole. You can add this role to a user account by selecting Settings > Roles in the Splunk main menu. - Next to the Search field, in the drop-down list for selecting the time interval of events to search, select All time.
- Click Search.
Search & reporting app
- In the Search field, type the following command:
Removing Kaspersky CyberTrace objects (ArcSight)
This section describes how to remove objects related to Kaspersky CyberTrace from ArcSight after Kaspersky CyberTrace is uninstalled. Note that after you have removed these objects, events from Kaspersky CyberTrace persist in ArcSight.
To remove objects related to Kaspersky CyberTrace from ArcSight:
- Remove the ARB package from ArcSight.
To do this, in ArcSight Console, remove the
/All Packages/Public/Kaspersky CyberTrace Connectorpackage. - Uninstall the ArcSight SmartConnector service that was used to receive events from Feed Service.
In Linux you do this as follows:
- Stop the ArcSight SmartConnector service by running the following command:
/etc/init.d/arc_%service_name% stopHere
%service_name%is the name of the ArcSight SmartConnector service specified during its installation. - Run the following command to uninstall the ArcSight SmartConnector:
%ConnectorInstallDir%/UninstallerData/Uninstall_ArcSightAgentsHere
%ConnectorInstallDir%is the directory to which the ArcSight SmartConnector was installed. - Remove the
%ConnectorInstallDir%directory.
In Windows you uninstall the ArcSight SmartConnector service by running the ArcSight SmartConnector uninstallation program.
- Stop the ArcSight SmartConnector service by running the following command:
- Uninstall the ArcSight Forwarding Connector that was used to send events to Feed Service.
Do this as follows:
- Stop the ArcSight Forwarding Connector service by running the following command:
/etc/init.d/arc_%FORWARDING% stopHere
%FORWARDING%is the name of the ArcSight Forwarding Connector service specified during its installation. - Run the following command to uninstall the ArcSight Forwarding Connector:
%ConnectorInstallDir%/UninstallerData/Uninstall_ArcSightAgentsHere
%ConnectorInstallDir%is the directory to which the ArcSight Forwarding Connector was installed. - Remove the
%ConnectorInstallDir%directory.
- Stop the ArcSight Forwarding Connector service by running the following command:
Removing Kaspersky CyberTrace objects (RSA NetWitness)
This section describes how to remove objects related to Kaspersky CyberTrace from RSA NetWitness after Kaspersky CyberTrace is uninstalled. Note that after you have removed these objects, events from Kaspersky CyberTrace persist in RSA NetWitness.
To remove objects related to Kaspersky CyberTrace from RSA Net Witness:
- Remove the
/etc/netwitness/ng/envision/etc/devices/cybertracedirectory from the computer on which Log Decoder runs. - From the Log Decoder settings, remove the
cybertraceforwarding rule similarly to the way that it was added. - If you will not forward events in future, disable the event forwarding by setting the
/decoder/config/logs.forwarding.enabledparameter tofalse. - Remove the
Kaspersky CyberTracedashboard similarly to the way that a dashboard can be created. - Remove the Kaspersky CyberTrace charts similarly to the way that you enabled them.
- Remove the
CyberTrace Reportreport similarly to the way that a report can be created. - Remove the Feed Service rules simillarly to the way that they were imported.
- If you added fields to the index-concentrator-custom.xml or table-map-custom.xml files, remove them from there.
- Restart Concentrator if you have changed index-concentrator-custom.xml.
- Restart Log Decoder.
Adding self-signed SSL certificates for CyberTrace Web
The SSL certificate and a private key that are generated during the installation of CyberTrace allow you to use CyberTrace Web via HTTPS. The certificate is self-signed, so the browser you use informs you about an untrusted connection. We recommend that you use a certificate that is trusted in your infrastructure. However if you cannot use a trusted certificate, you can add the self-signed certificate as trusted to your browser or operating system.
Generating SSL certificates for Kaspersky CyberTrace Web
CyberTrace Web uses an SSL certificate for HTTPS connections. By default, CyberTrace Web uses a self-signed certificate and a private key that are generated during the installation of CyberTrace. The generated certificate is valid for two years.
We recommend that you generate a certificate that will be trusted in your infrastructure, and then configure CyberTrace to use this certificate instead of the self-signed certificate.
Before making changes, create a backup copy of the existing private key, certificate, and Feed Service configuration file.
To generate a trusted certificate for CyberTrace Web:
- Create a private key and a trusted certificate:
- Create a new private and public key pair.
- Use the public key to generate an SSL Certificate Signing Request (CSR).
- Sign the CSR request by using the trusted CA.
This creates a trusted certificate for the private key.
- Convert the private key and the trusted certificate to the PEM format.
- Copy both the private key and the certificate to the
%service_dir%/httpsrvdirectory. - Edit the
GUISettings > HTTPServer > SSLCertificatePathandGUISettings > HTTPServer > SSLPrivateKeyPathelements of the Feed Service configuration file, if necessary, so that they will contain the paths to the certificate and private key, respectively.Save the Feed Service configuration file.
- Restart Feed Service.
Adding the self-signed certificate as trusted to a browser
The procedures in this section show you how to add the self-signed certificates generated during Kaspersky CyberTrace installation to the trusted storage. This will remove the security warnings generated by browsers.
The information in this section is applicable to the situation when a user gains access to CyberTrace Web from the same computer on which CyberTrace Web runs. If the GUISettings > HTTPServer > ConnectionString element of the Feed Service configuration file refers to an external interface, the CyberTrace Web website will not be considered trusted, because the self-signed certificate can be used only with the https://127.0.0.1 and https://localhost addresses.
To avoid potential security risks, we recommend using a trusted certificate signed by a certificate authority (CA). For more information, see section "Generating certificates for CyberTrace Web".
Causing a self-signed certificate to be trusted by a browser (CyberTrace Web is opened in Internet Explorer installed on a Windows system)
Gaining the browser's trust requires that you perform, in sequence, the following three procedures:
To save the certificate to a local file:
- Open the
https://127.0.0.1orhttps://localhostaddress in Internet Explorer.The browser informs you of a problem with the security certificate of the website.
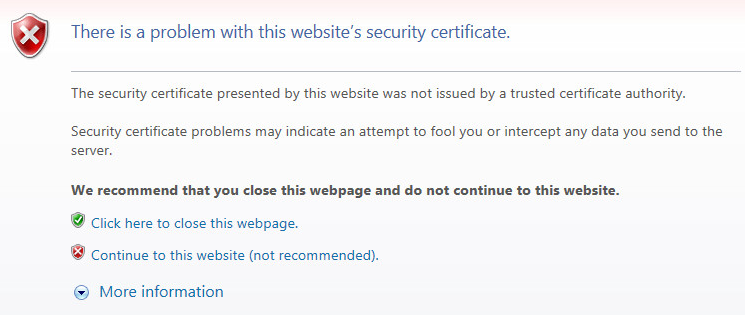
Certificate error message
- Select the Continue to this website (not recommended) link.
The Certificate Error message appears in the address bar.
- Click Certificate Error.
The Untrusted Certificate window opens.
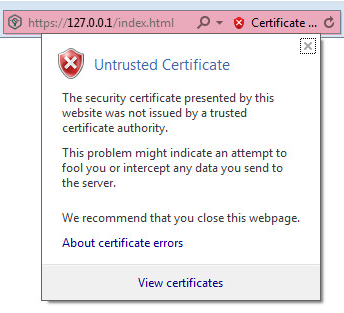
Untrusted Certificate window
- Select the View certificates link.
The Certificate window opens with information about the CyberTrace certificate.
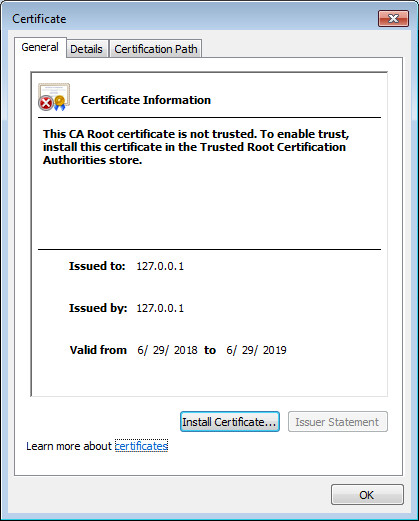
Certificate window
- Select the Details tab, and then click Copy to File to create a local copy of the certificate.
The Certificate Export Wizard starts.
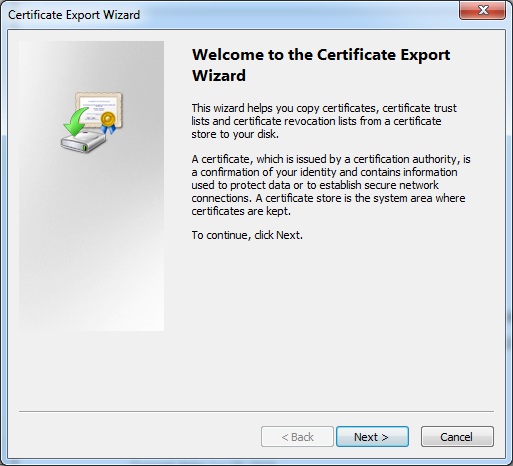
Certificate Export Wizard
- Follow the Wizard instructions.
Use the default Wizard settings during the certificate export.
To start the certificate import process through Microsoft Management Console (MMC):
- From the Search box, navigate to the Run box, and then enter mmc.
You can now run MMC as Administrator.
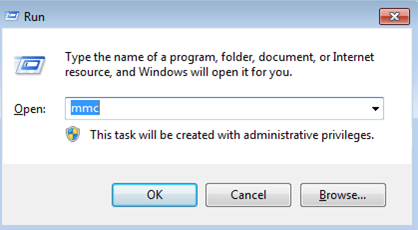
Running the MMC
- In the MMC-based console that opens, select File > Add/Remove Snap-in.
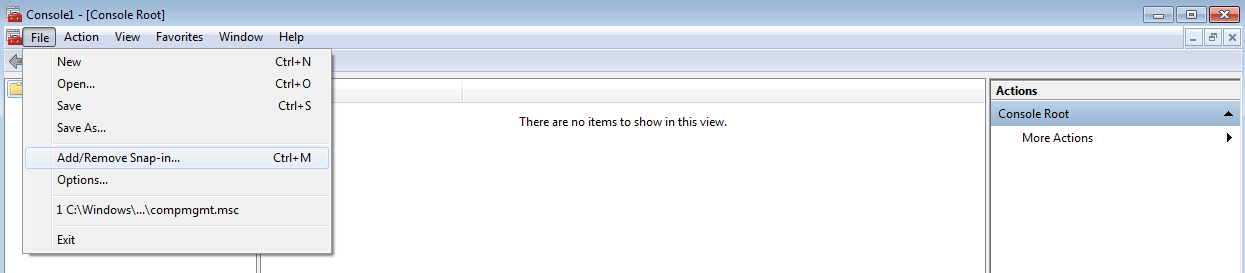
Selecting Add/Remove Snap-in
The Add or Remove Snap-ins window opens.
- In the Available snap-ins list, select Certificates, and then click Add.
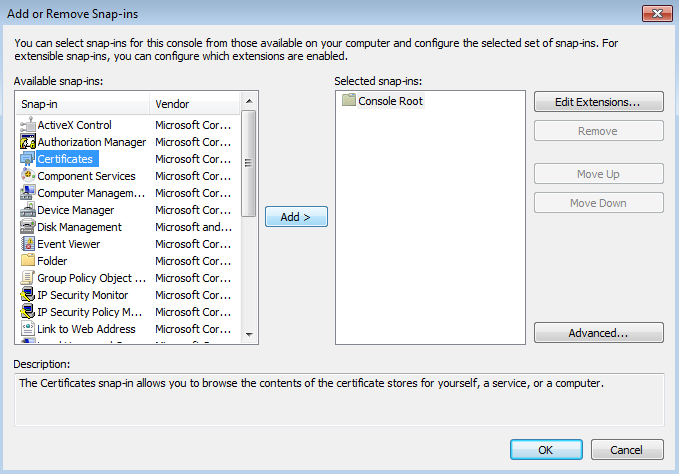
Adding a Certificates snap-in
The Certificates snap-in window opens.
- Select Computer account, and then click Next.
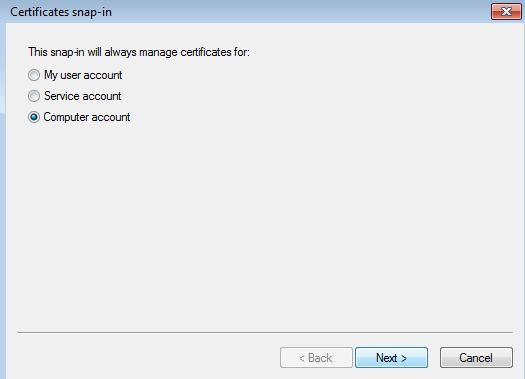
Selecting Computer account
In the Select Computer window that opens, click Finish.
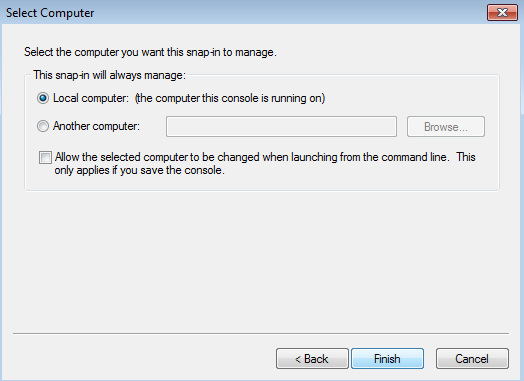
Selecting Local computer
- In the tree pane, select Certificates (Local Computer) > Trusted Root Certification Authorities, right-click Certificates, and then select All Tasks > Import.
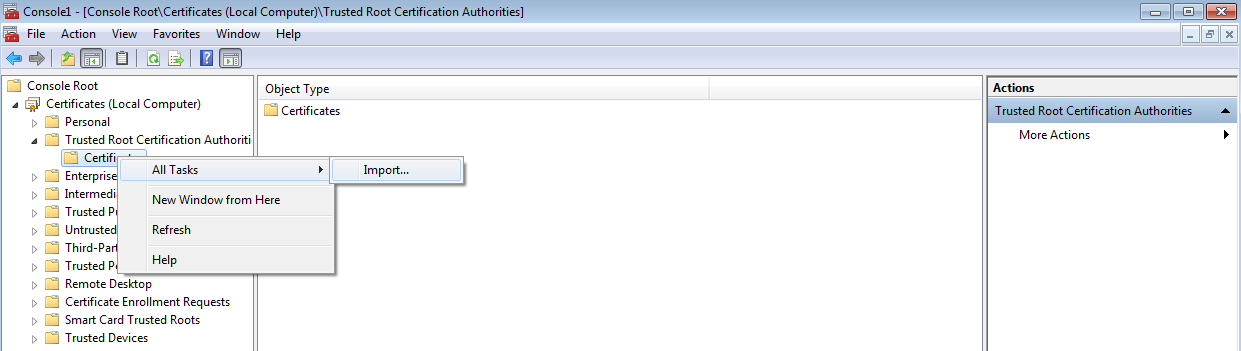
Selecting Import
The Certificate Import Wizard starts.
To add the saved certificate to the Trusted Root Certification Authorities store:
- On the Welcome page of the Wizard, click Next.
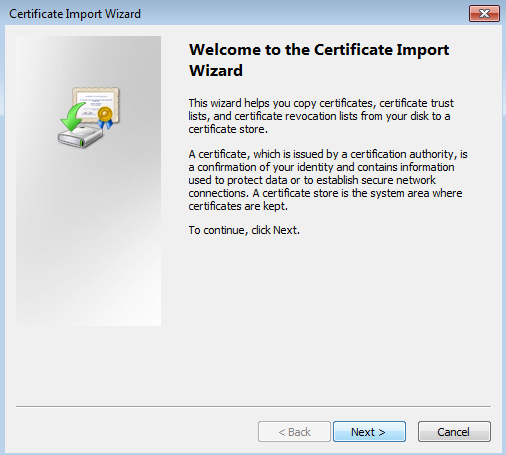
Certificate Import Wizard
- Click Browse and select the certificate that was saved in the "To make the self-signed certificate for CyberTrace Web trusted when using Internet Explorer:" procedure above.
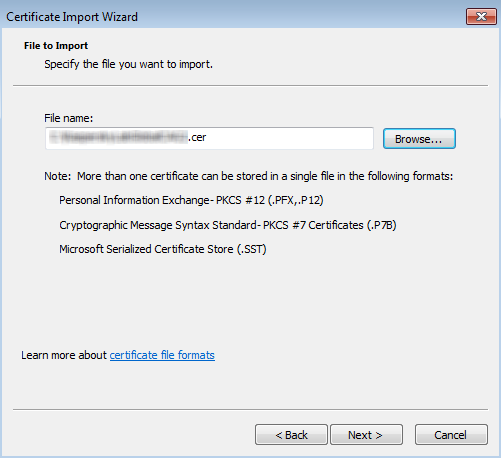
Importing the previously saved certificate
- On the next page of the Certificate Import Wizard, click Next.
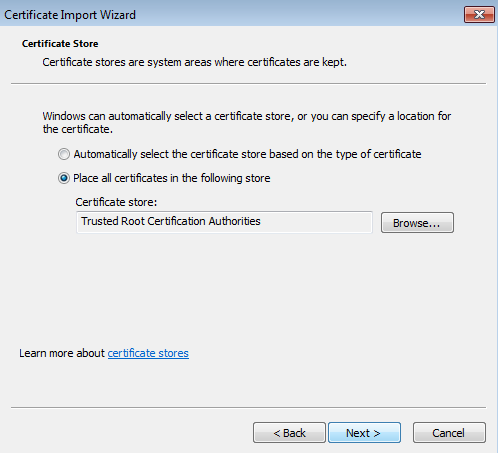
Selecting a certificate store
- On the last page of the Certificate Import Wizard, click Finish.
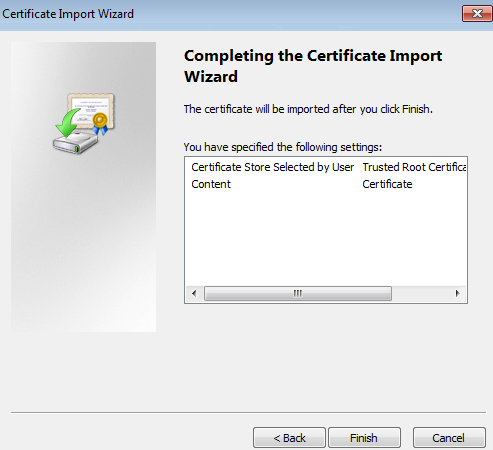
Completing the certificate import
- Close the MMC-based console and restart the browser.
The security problem (untrusted certificate) is resolved, as shown in the figure below.
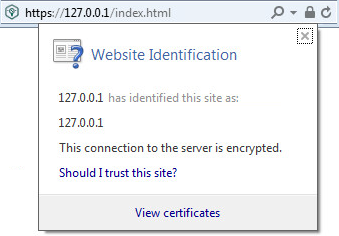
Website identification
Causing a self-signed certificate to be trusted by a browser (CyberTrace Web opens in Google Chrome installed on a Windows system)
To make the self-signed certificate for CyberTrace Web trusted when using Google Chrome:
- Open the
https://127.0.0.1orhttps://localhostaddress in Google Chrome.A warning is displayed in the address bar that the connection to the site is not secure.
- Click the Not secure message.
A window opens with security details about the website.
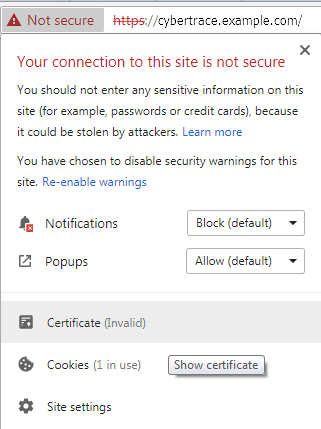
Security details
- Click Certificate to view the certificate information. (When the mouse pauses over Certificate, a Show certificate tooltip appears.)
- In the Certificate window that opens, select the Details tab, and then click Copy to File to create a local copy of the certificate.
The Certificate Export Wizard starts.
Certificate Export Wizard
- Follow the Wizard instructions.
Use the default Wizard settings during the certificate export.
- After the certificate is saved to a local disk, open it and add it to the Trusted Root Certification Authorities store, as described in the procedure for Internet Explorer.
- Restart the browser.
Causing a self-signed certificate to be trusted by a browser (CyberTrace Web opens in Mozilla Firefox)
You add CyberTrace Web to the list of Mozilla Firefox trusted sites so that the browser will not display warnings about the certificate.
Causing a self-signed certificate to be trusted by a browser (CyberTrace Web opens in a browser for Linux)
Procedures for using a browser to import a certificate as trusted (on Linux systems) vary depending on the browser and Linux distribution used. But the procedures share common steps: to open the browser settings form and use the form to import the certificate to a store.
To manually cause a self-signed certificate to be trusted by a browser on a Linux system:
- Create a
/usr/local/share/ca-certificates/directory if it does not exist on your computer:mkdir /usr/local/share/ca-certificates/ - Copy your root certificate (.crt file) to the created directory:
cp <full path to the certificate> /usr/local/share/ca-certificates/ - Update the certificates:
sudo update-ca-certificatesIf you do not have the ca-certificates package, install it with your package manager.
Removing a certificate from the list of trusted ones
After you have reconfigured or uninstalled CyberTrace, old certificates are no longer used by CyberTrace. You can remove them from the list of trusted certificates.
To remove a certificate from the list of trusted certificates (on Windows):
- Open the Certificates management console, and then run the following command:
certmgr.msc - In the tree pane, select Trusted Root Certification Authorities > Certificates.
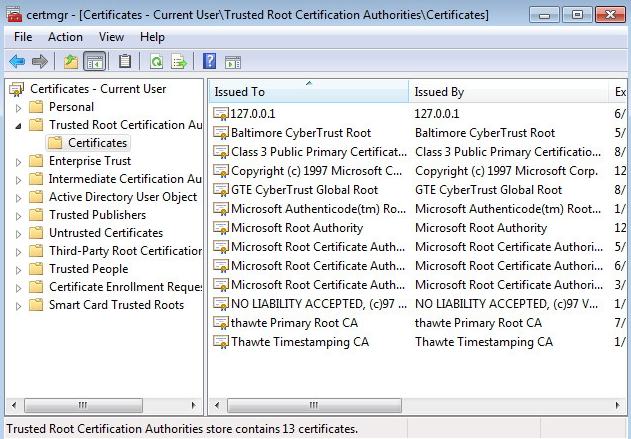
Certificates management console
- In the results pane, right-click the added certificate, and then select Delete.
On a Linux system, the removal procedure is performed in a way that is similar to the addition of a certificate: open the list of the trusted certificates and remove those that you do not need.
Page topWatchdog module workflow
This section describes the watchdog module workflow.
How watchdog mode works (Linux)
Kaspersky CyberTrace can run in watchdog mode. In this case, a separate module monitors the service and re-launches it when it freezes or crashes. It works as follows:
- Every two minutes, the watchdog module sends a message to Feed Service.
- If this message is received, a response is sent back in the same TCP connection.
- If the watchdog module has not received the response, it performs the following steps:
- The watchdog module sends a notification (a
KL_ALERT_ServiceUnavailableevent) to the event target software that Feed Service is unavailable. - If logging is turned on, the watchdog module writes information about the Feed Service unavailability to the watchdog module log (a separate log).
- The watchdog module starts Feed Service.
- If logging is turned on, the watchdog module writes information about the restart of Feed Service to the watchdog module log.
- Feed Service sends a notification (a
KL_ALERT_ServiceStartedevent) to the event target software that Feed Service started.
- The watchdog module sends a notification (a
You can run Feed Service in watchdog mode from the command line or by using the script.
How watchdog mode works (Windows)
Kaspersky CyberTrace runs in watchdog mode: the watchdog service monitors Feed Service and re-launches it when it freezes or crashes. It works as follows:
- Every four minutes, the watchdog service sends a message to Feed Service.
- If this message is received, a response is sent back in the same TCP connection.
- If the watchdog service has not received the response, the following steps are performed:
- The watchdog service sends a notification (a
KL_ALERT_ServiceUnavailableevent) to the event target software that Feed Service is unavailable. - If logging is turned on, the watchdog service writes information about Feed Service unavailability to the watchdog service log (a separate log).
- The watchdog service starts Feed Service.
- If logging is turned on, the watchdog service writes information about the Feed Service restart to the watchdog service log.
- Feed Service sends a notification (a KL_ALERT_ServiceStarted event) to the event target software that Feed Service has started.
- The watchdog service sends a notification (a
When you run Feed Service in watchdog mode, make sure that one scanner (the ServiceSettings > ScannersCount element in the configuration file) is reserved for the watchdog module.
The watchdog service binary file kl_watchdog_service.exe is launched from the command line. The binary file uses the flags described in the following table.
Flags for kl_watchdog_service.exe
Flag |
Description |
--reg |
Adds the watchdog service to the list of Windows services. |
--del |
Removes the watchdog service from the list of Windows services. |
--svc |
Starts the watchdog service as a Windows service. Note that only Service Control Manager can run kl_watchdog_service.exe with this flag. If the user tries to run kl_watchdog_service.exe with this flag, an error occurs. |
--help (or -h) |
Prints information about flags that can be used with kl_watchdog_service.exe. |
If no flag is specified, the kl_watchdog_service.exe program prints the list of available flags to the screen.
Restarting Feed Service by the watchdog module
Feed Service can be launched in watchdog mode. In this case, the watchdog module monitors Feed Service to make sure that it keeps running. When the watchdog module detects that the service has crashed or frozen, it notifies the SIEM solution and restarts the service. Feed Service starts working and notifies the SIEM solution. Therefore, you can look in the SIEM solution log to learn the period during which Feed Service was not active.
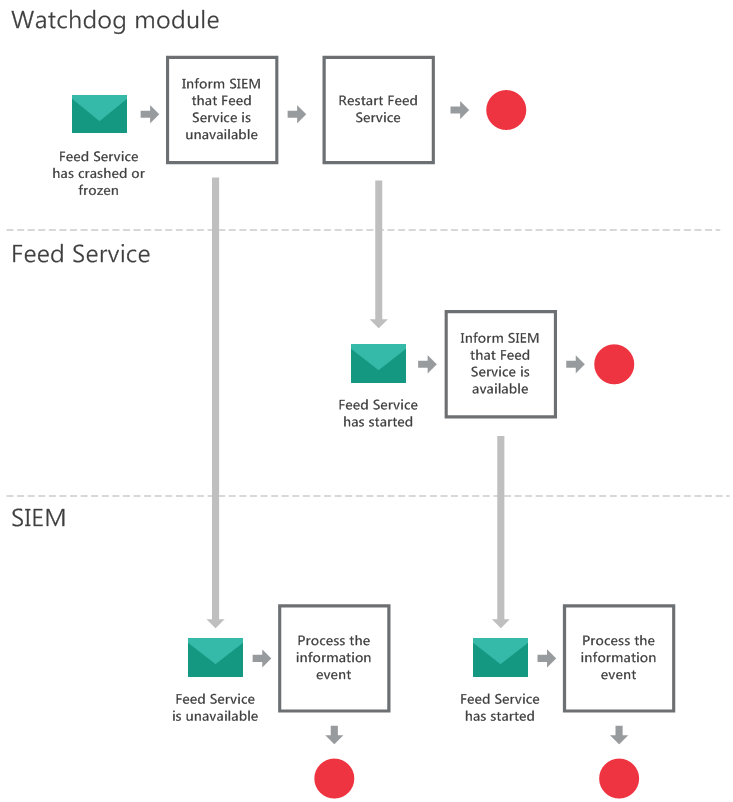
Restarting Feed Service using the watchdog module
Page topTesting the connection with Feed Service and the availability of feeds
This section explains how to test the connection with Feed Service and its ability to match events against specific feeds.
Before testing the connection with Feed Service, make sure that there is at least one unused scanner in the ServiceSettings > ScannersCount element of the configuration file.
Sending a ping request
You can send a ping request to test the connection with Feed Service. This method does not require any feeds to be enabled. You do not need a commercial certificate for Kaspersky Threat Data Feeds to use this method.
To test the connection with Feed Service by sending a ping request:
- Establish a TCP connection using the IP address and port that Feed Service listens on for incoming events (see section "Service settings").
- Send
X-KF-ReplyBackPINGas the first message. - Wait for the response.
If the response is PONG, it means that Feed Service is running and listening for incoming events on the specified IP address and port.
Sending a test event
Kaspersky Threat Intelligence Data Feeds contain records that are provided for test purposes only and do not represent malicious objects. You can use these records to make sure that Feed Service can match events against specific feeds. These records always appear in the feeds and will never be removed.
To test the connection with Feed Service by sending a test event:
- Establish a TCP connection using the IP address and port that Feed Service listens on for incoming events (see section "Service settings").
- Send
X-KF-SendFinishedEventX-KF-ReplyBackas the first message. - Send a test event containing a test record for the specific feed from the tables below.
The following table contains the test records for commercial feeds.
Test records (commercial feeds)
Feed used
Test records
Event category
Malicious URL Data Feed
http://fakess123.nu
KL_Malicious_URL
Phishing URL Data Feed
http://fakess123ap.nu
KL_Phishing_URL
Botnet CnC URL Data Feed
http://fakess123bn.nu
KL_BotnetCnC_URL
IP Reputation Data Feed
192.0.2.1
KL_IP_Reputation
Malicious Hash Data Feed
FEAF2058298C1E174C2B79AFFC7CF4DF
KL_Malicious_Hash_MD5
Mobile Malicious Hash Data Feed
60300A92E1D0A55C7FDD360EE40A9DC1
KL_Mobile_Malicious_Hash_MD5
Mobile Botnet CnC URL Data Feed
http://sdfed7233dsfg93acvbhl.su/steallallsms.php
KL_Mobile_BotnetCnC_URL
Ransomware URL Data Feed
http://fa7830b4811fbef1b187913665e6733c.com
KL_Ransomware_URL
Vulnerability Data Feed
D8C1F5B4AD32296649FF46027177C594
KL_Vulnerable_File_Hash_MD5
APT URL Data Feed
http://b046f5b25458638f6705d53539c79f62.com
KL_APT_URL
APT Hash Data Feed
7A2E65A0F70EE0615EC0CA34240CF082
KL_APT_Hash_MD5
APT IP Data Feed
192.0.2.4
KL_APT_IP
IoT URL Data Feed
http://e593461621ee0f9134c632d00bf108fd.com/.i
KL_IoT_URL
ICS Hash Data Feed
7A8F30B40C6564EFF95E678F7C43346C
KL_ICS_Hash_MD5
The following table contains the test records that can be used when only demo feeds are enabled.
Test records (demo feeds)
Feed used
Test records
Event category
DEMO Botnet_CnC_URL_Data_Feed
http://5a015004f9fc05290d87e86d69c4b237.com
KL_BotnetCnC_URL
DEMO IP_Reputation_Data_Feed
192.0.2.1
KL_IP_Reputation
DEMO Malicious_Hash_Data_Feed
776735A8CA96DB15B422879DA599F474
KL_Malicious_Hash_MD5
- Wait for the response:
- If the response is a detection event that contains the corresponding event category from the tables above, it means that Feed Service can receive events and match them against the specific feed.
- If the response is
LookupFinishedwithout event information, it means that Feed Service can receive events and perform matching, but the specific feed is disabled (see section "Enabling and disabling feeds").
Developer guides
This chapter provides information about developing applications that interact with Kaspersky CyberTrace.
Python application tutorial: Part 1
This tutorial explains how you can implement a Python application that sends and receives data from Kaspersky CyberTrace.
Part 1 of this tutorial describes an application that sends data to Kaspersky CyberTrace.
Part 2 of this tutorial describes an application that listens for incoming events from Kaspersky CyberTrace.
Introduction
In this part of the tutorial, you implement a Python application that sends data to Kaspersky CyberTrace. Kaspersky CyberTrace analyzes the received data for matched indicators. If there are matched indicators, Kaspersky CyberTrace sends its own events in response.
You can use any name for your application. This tutorial uses the send_events_cybertrace.py file name for this application in the examples.
We recommend using Python 3 for implementing this application. Code examples in this tutorial use the Python 3 syntax.
About the X-KF-ReplyBack flag
In this part of the tutorial, your application uses the X-KF-ReplyBack flag to receive events from Kaspersky CyberTrace without a listener application. You will implement an application that listens for Kaspersky CyberTrace events in Part 2 of this tutorial.
The X-KF-ReplyBack flag enables the ReplyBack mode. In this mode, Kaspersky CyberTrace sends its detection events to the same socket connection.
This flag is optional. If your application does not send this flag, Kaspersky CyberTrace sends its own events as specified in the OutputSettings > ConnectionString parameter.
About the X-KF-SendFinishedEvent flag
Your application uses the X-KF-SendFinishedEvent flag to make Kaspersky CyberTrace generate a special event in response to each received event.
Kaspersky CyberTrace generates this event by using the format specified in the OutputSettings > FinishedEventFormat parameter. The value of the enabled attribute of this parameter is ignored.
About the X-KF-SaveStatistic flag
Your application uses the X-KF-SaveStatistic flag to make Kaspersky CyberTrace save detection statistics for all events received during the current connection. The events will also be saved for retrospective scanning.
Stage 1. Define the main() function
In this stage:
- Import the
socketmodule.Your application uses functions from this module to establish connections with Kaspersky CyberTrace and send data.
- Define the
main()function. - In the
CYBERTRACE_ADDRandCYBERTRACE_PORTvariables, specify the address and port where Kaspersky CyberTrace listens for incoming events.You can get this information on the Service settings page in CyberTrace Web.
import socket
CYBERTRACE_ADDR = "192.0.2.42"
CYBERTRACE_PORT = 9999
def main():
pass
if __name__ == '__main__':
main()
Stage 2. Add example events
In this stage:
- In the
main()function, define a list with example events.The events in this list contain indicators. Your application sends these events to Kaspersky CyberTrace.
Each event must terminate with a newline character (
\n). The newline character acts as a separator for events.def main():
events = [
'192.0.2.1\n',
'ip=192.0.2.3\n',
'776735A8CA96DB15B422879DA599F474\n',
'EICAR md5=FEAF2058298C1E174C2B79AFFC7CF4DF\n',
'Regular event\n',
'44D88612FEA8A8F36DE82E1278ABB02F\n',
'val1=04BFFABE7980E7D84424001896D2572E val2=0F9CCE3EA0EDFD6F41FF8A769F721631\n',
'val=E9A6B1346D1A2447CABB980F3CC5DD27\n',
'Regular event\n',
'http://5a015004f9fc05290d87e86d69c4b237.com\n',
'Domain: http://fakess123bn.nu\n',
]
Stage 3. Establish a socket connection
In this stage:
- In the
main()function, add the code that establishes a connection to Kaspersky CyberTrace and closes it when all events are sent. - In this code, send the
X-KF-SendFinishedEventandX-KF-ReplyBackflags.Send the
X-KF-SendFinishedEventandX-KF-ReplyBackflags when you establish a connection. These flags make Kaspersky CyberTrace always generate an event in response to a received event, even if the received event does not match any indicators.Send the
X-KF-SaveStatisticflag if you want Kaspersky CyberTrace to save detection statistics and events for retroscan during the current connection.If you want to use the
X-KF-ReplyBackflag, theX-KF-SendFinishedEventflag must precede it.If you want to use the
X-KF-SaveStatisticflag, theX-KF-ReplyBackflag must precede itct_socket = socket.socket(socket.AF_INET, socket.SOCK_STREAM)
try:
ct_socket.connect((CYBERTRACE_ADDR, CYBERTRACE_PORT))
ct_socket.sendall(b'X-KF-SendFinishedEventX-KF-ReplyBackX-KF-SaveStatistic')
# Code from the next stage goes here
finally:
ct_socket.close()
Stage 4. Send events
In this stage:
- In the code from the previous stage, in the
try... finallyblock, iterate over theeventslist and send each event to Kaspersky CyberTrace.The
16384parameter in thesocket.recv()function specifies the size of a message buffer. If you expect a response to contain more than 16384 bytes, increase the buffer value. This may be required if individual events contain a large number of matched indicators.for event in events:
ct_socket.sendall(event.encode())
response = ct_socket.recv(16384)
- Add console output for sent events and received responses.
for event in events:
print("Sending:\n{}".format(event))
ct_socket.sendall(event.encode())
response = ct_socket.recv(16384)
print("Response:\n{}".format(response.decode()))
Stage 5. Run your application
In this stage:
- Run your application from the console:
python3 ./send_events_cybertrace.py
Below is an example of the application output. Kaspersky CyberTrace sends an event for each matched indicator and an event for the finished lookup operation.
Sending: val1=192.0.2.1 val2=ip=192.0.2.3
Response: - category=KL_IP_Reputation matchedIndicator=192.0.2.1 url=- src=- ip=192.0.2.1 md5=- sha1=- sha256=- usrName=- confidence=100 category=test first_seen=01.01.2017 00:00 ip=192.0.2.1 ip_geo=ru last_seen=16.07.2020 10:02 popularity=1 threat_score=75 - category=KL_IP_Reputation matchedIndicator=192.0.2.3 url=- src=- ip=192.0.2.3 md5=- sha1=- sha256=- usrName=- confidence=100 category=test first_seen=15.01.2017 00:00 ip=192.0.2.3 ip_geo=ru last_seen=16.07.2020 09:51 popularity=1 threat_score=75 LookupFinished
Sending: EICAR md5=FEAF2058298C1E174C2B79AFFC7CF4DF
Response: - category=KL_Malicious_Hash_MD5 matchedIndicator=FEAF2058298C1E174C2B79AFFC7CF4DF url=- src=- ip=- md5=FEAF2058298C1E174C2B79AFFC7CF4DF sha1=- sha256=- usrName=- confidence=100 MD5=FEAF2058298C1E174C2B79AFFC7CF4DF SHA1=D01D17F6B13C7255A234F558ED85078EA5DD3F3D SHA256=4CA914C9791CF2BF2AC69F9A2B21006F0361E247F2CE92F0A9F166DBC6B43670 file_size=1989 first_seen=10.07.2015 23:53 last_seen=13.07.2020 14:35 popularity=1 threat=HEUR:Trojan.Win32.Generic LookupFinished
Sending: Regular event
Response: LookupFinished |
Full code for Part 1
Below is the full code for Part 1 of this tutorial.
import socket
CYBERTRACE_ADDR = "192.0.2.42" CYBERTRACE_PORT = 9999
def main():
events = [ '192.0.2.1\n', 'ip=192.0.2.3\n', 'val1=192.0.2.1 val2=ip=192.0.2.3\n', '776735A8CA96DB15B422879DA599F474\n', 'EICAR md5=FEAF2058298C1E174C2B79AFFC7CF4DF\n', 'Regular event\n', '44D88612FEA8A8F36DE82E1278ABB02F\n', 'val1=04BFFABE7980E7D84424001896D2572E val2=0F9CCE3EA0EDFD6F41FF8A769F721631\n', 'val=E9A6B1346D1A2447CABB980F3CC5DD27\n', 'Regular event\n', 'http://5a015004f9fc05290d87e86d69c4b237.com\n', 'Domain: http://fakess123bn.nu\n', ]
ct_socket = socket.socket(socket.AF_INET, socket.SOCK_STREAM)
try: ct_socket.connect((CYBERTRACE_ADDR, CYBERTRACE_PORT)) ct_socket.sendall(b'X-KF-SendFinishedEventX-KF-ReplyBackX-KF-SaveStatistic')
for event in events: print("Sending:\n{}".format(event)) ct_socket.sendall(event.encode()) response = ct_socket.recv(16384) print("Response:\n{}".format(response.decode()))
finally: ct_socket.close()
if __name__ == '__main__':
main() |
Python application tutorial: Part 2
This tutorial explains how you can implement a Python application that sends and receives data from Kaspersky CyberTrace.
Part 1 of this tutorial describes an application that sends data to Kaspersky CyberTrace.
Part 2 of this tutorial describes an application that listens for incoming events from Kaspersky CyberTrace.
Introduction
In this part of the tutorial, you implement a Python application that listens for incoming events from Kaspersky CyberTrace.
You can use any name for your application. This tutorial uses the listen_events_cybertrace.py file name for this application in the examples.
About connection settings and event formats
Your application will listen on the specified address and port, accept incoming connections from Kaspersky CyberTrace, and parse received data.
To determine the address and port where to send events, Kaspersky CyberTrace uses the OutputSettings > ConnectionString parameter. You can view and configure the address and port for outgoing events on the Service settings page in CyberTrace Web.
To determine the format of events, Kaspersky CyberTrace uses formats from the OutputSettings section of the Feed Service configuration file. Every event terminates with a newline character (\n). You can see and configure the event formats on the Event format settings page in CyberTrace Web.
Stage 1. Define the main() function
In this stage:
- Import the
socketmodule.Your application uses functions from this module to establish connections with Kaspersky CyberTrace and receive data.
- Define the
main()function. - In the
LISTEN_ADDRandLISTEN_PORTvariables, specify the address and port where the application listens for incoming events.You can get this information in CyberTrace Web, on the Service settings page, in the Service sends events to area.
import socket
LISTEN_ADDR = "192.0.2.105"
LISTEN_PORT = 9998
def main():
pass
if __name__ == '__main__':
main()
Stage 2. Add the server code
In this stage:
- In the
main()function, add the code that starts a server on a specified address and port.server_socket = socket.socket(socket.AF_INET, socket.SOCK_STREAM)
print("Starting on {}:{}".format(LISTEN_ADDR, LISTEN_PORT))
server_socket.bind((LISTEN_ADDR, LISTEN_PORT))
server_socket.listen()
- Add the code that handles incoming connections.
The
socket.accept()function accepts an incoming connection. It returns a new socket object for the connection (in theconnectionvariable) and an address that established the connection on the other end (in theclient_addressvariable).At this stage, the application ignores data received from connections. You will add the data parsing functionality in the next stage.
The application starts an endless loop. You can terminate it by using a standard shortcut or command for your operating system. On most operating systems, this is ^C or Control-C.
while True:
connection, client_address = server_socket.accept()
try:
print("Connection from {}".format(client_address))
# Add data parsing herefinally:
connection.close()
Stage 3. Parse received data
In this stage:
- In the
try... finallyblock, call a function that parses the received data into events.Because each connection can send any number of events, the application must parse the received data until all events are processed. The
parse_response()function returns a generator. Theforloop then uses this generator to iterate over the received events. You will implement theparse_response()function in the next step.try:
print("Connection from {}".format(client_address))
for event in parse_response(connection):
print("Received:\n{}".format(event.decode()))
finally:
connection.close()
- Implement the
parse_response()function.Events from Kaspersky CyberTrace terminate in a newline character (
\n). Theparse_response()function reads data from the socket connection into a buffer until the buffer contains a newline character. Then the function splits an event from the buffer and yields it. Thechunk_receive()function iterates over the data from the socket connection. You will implement this function in the next step.When the
forloop from themain()function proceeds to the next iteration, theparse_response()function splits another event from the buffer and yields it. If it is not possible, the function reads more data from the connection into the buffer. The process repeats until there is no more data received from the connection and all the events in the buffer are yielded.def parse_response(connection):
buff = b''
for data in chunk_receive(connection):
buff += data
while b'\n' in buff:
event, buff = buff.split(b'\n',1)
yield event
- Implement the
chunk_receive()function.The
chunk_receive()function reads 4096 bytes of data from the connection and yields this data. The function returns data until there is no more data to receive from the connection.The
socket.recv()function receives data from the connection. If there is no data, the function waits until more data is received. The function returns zero bytes when the connection closes, so thewhileloop terminates on this condition.def chunk_receive(connection):
data = None
while data != b'':
data = connection.recv(4096)
yield data
Stage 5. (Optional) Modify the application that sends events
If you want to send events to Kaspersky CyberTrace with the application that you implemented in Part 1 of this tutorial, modify it to send events without waiting for a response.
In this stage:
- Comment or delete the line in the application code that sends flags. Kaspersky CyberTrace sends events to the listener application, so the
X-KF-ReplyBackflag is no longer needed. - Comment or delete lines that receive and output the response.
Below is the try... finally block from the application, with commented lines.
try: ct_socket.connect((CYBERTRACE_ADDR, CYBERTRACE_PORT))
for event in events: print("Sending:\n{}".format(event)) ct_socket.sendall(event.encode())
finally: ct_socket.close()
|
Stage 6. Run your application
Run your application from the console:
python3 ./listen_events_cybertrace.py
The application listens for detection and alert events from Kaspersky CyberTrace, and outputs them to the console.
If you want to send events to Kaspersky CyberTrace by using the application developed in Part 1 of this tutorial, run it from the console:
python3 ./send_events_cybertrace.py
Below is an example of the application output.
Starting on 192.0.2.105:9998 Connection from ('192.0.2.42', 41882) Received: - category=KL_Malicious_Hash_MD5 matchedIndicator=776735A8CA96DB15B422879DA599F474 url=- src=- ip=- md5=776735A8CA96DB15B422879DA599F474 sha1=- sha256=- usrName=- confidence=100 MD5=776735A8CA96DB15B422879DA599F474 SHA1=3B66A1D70562E291DA023E87B349DD89DFE00213 SHA256=1963CBCBB9FDAAD45F782FAAA467EE2C115C3111C003AE14D01181880B03F6ED file_size=1431 first_seen=10.07.2015 23:53 last_seen=14.07.2020 13:35 popularity=1 threat=HEUR:Trojan.Win32.Generic Received: - category=KL_IP_Reputation matchedIndicator=192.0.2.1 url=- src=- ip=192.0.2.1 md5=- sha1=- sha256=- usrName=- confidence=100 category=test first_seen=01.01.2017 00:00 ip=192.0.2.1 ip_geo=ru last_seen=17.07.2020 09:02 popularity=1 threat_score=75 Received: - category=KL_Malicious_Hash_MD5 matchedIndicator=FEAF2058298C1E174C2B79AFFC7CF4DF url=- src=- ip=- md5=FEAF2058298C1E174C2B79AFFC7CF4DF sha1=- sha256=- usrName=- confidence=100 MD5=FEAF2058298C1E174C2B79AFFC7CF4DF SHA1=D01D17F6B13C7255A234F558ED85078EA5DD3F3D SHA256=4CA914C9791CF2BF2AC69F9A2B21006F0361E247F2CE92F0A9F166DBC6B43670 file_size=1989 first_seen=10.07.2015 23:53 last_seen=14.07.2020 13:35 popularity=1 threat=HEUR:Trojan.Win32.Generic Received: - category=KL_IP_Reputation matchedIndicator=192.0.2.3 url=- src=- ip=192.0.2.3 md5=- sha1=- sha256=- usrName=- confidence=100 category=test first_seen=15.01.2017 00:00 ip=192.0.2.3 ip_geo=ru last_seen=17.07.2020 08:51 popularity=1 threat_score=75 |
Full code for Part 2
Below is the full code for Part 2 of this tutorial.
import socket
LISTEN_ADDR = "192.0.2.105" LISTEN_PORT = 9998
def chunk_receive(connection): data = None while data != b'': data = connection.recv(4096) yield data
def parse_response(connection): buff = b'' for data in chunk_receive(connection): buff += data while b'\n' in buff: event, buff = buff.split(b'\n',1) yield event
def main():
server_socket = socket.socket(socket.AF_INET, socket.SOCK_STREAM) print("Starting on {}:{}".format(LISTEN_ADDR, LISTEN_PORT)) server_socket.bind((LISTEN_ADDR, LISTEN_PORT)) server_socket.listen()
while True: connection, client_address = server_socket.accept() try: print("Connection from {}".format(client_address)) for event in parse_response(connection): print("Received:\n{}".format(event.decode())) finally: connection.close()
if __name__ == '__main__':
main() |
REST API reference
This chapter provides information about using the REST API of Kaspersky CyberTrace.
About the REST API
This section describes the features of the Kaspersky CyberTrace REST API.
About the REST API
Kaspersky CyberTrace provides a REST API interface that you can use to perform the following actions:
- Perform an indicator search.
- Add new suppliers, and configure and remove suppliers that were added with the REST API.
- Add, remove, and update supplier indicators for suppliers that were added with the REST API; and for InternalTI and FalsePositive suppliers.
Supported protocols
The REST API supports HTTPS protocol with basic authentication. All requests are synchronous. Kaspersky CyberTrace processes a request and returns the result in the response.
To communicate by using HTTPS, Kaspersky CyberTrace uses the certificate specified in the GUISettings > HTTPServer >SSLCertificatePath and GUISettings > HTTPServer >SSLPrivateKeyPath elements of the kl_feed_service.conf configuration file.
For more information about authentication, see Accessing the REST API.
The maximum number of processed requests is specified in the ServiceSettings > ScannersCount element of the kl_feed_service.conf configuration file.
REST API suppliers
Suppliers that were added with the REST API are different from regular suppliers. Only the suppliers that you add with the REST API can be accessed through the REST API. You cannot access all other suppliers through the REST API. In addition, the REST API provides a way to manage indicators from FalsePositive and InternalTI suppliers.
Suppliers that were added with the REST API are displayed on the Custom feeds tab. If a vendor is specified for a supplier, the supplier is displayed on the vendor tab instead. Each REST API supplier has a short description that marks it as a REST API supplier.
For suppliers that were added with the REST API, you cannot perform the following actions in Kaspersky CyberTrace Web:
- Editing supplier properties.
- Enabling or disabling supplier fields.
- Specifying filtering rules for a supplier.
- Specifying the maximum number of records in a supplier.
You can perform the following actions for suppliers that were added with the REST API in Kaspersky CyberTrace Web:
- Specify actionable fields for a supplier.
- Enable or disable a supplier.
- Delete a supplier.
User roles and REST API
Methods that are available to a user depend on the user's role:
- Users with the Administrator role can make all requests.
- Users with the Analyst role can perform the indicator search.
REST API and logging
Kaspersky CyberTrace logs the following information about the REST API:
- If the logging level is err and above, Kaspersky CyberTrace logs information about REST API errors.
- If the logging level is info and above, Kaspersky CyberTrace logs information about all REST API requests and responses.
Accessing the REST API
This section explains how to access the Kaspersky CyberTrace REST API.
REST API endpoint
Kaspersky CyberTrace accepts requests on the endpoint which consists of the IP address of the computer with Kaspersky CyberTrace and the port specified in the GUISettings > HTTPServer > ConnectionString element of the kl_feed_service.conf configuration file.
The format of the address is:
https://%ENDPOINT%/api/%API_VERSION%/%REQUEST%
For example, if ConnectionString is 0.0.0.0:104, and the IP address of the computer with Kaspersky CyberTrace is 192.168.0.2, the lookup request must be made to the following address:
https://192.168.0.2:104/api/1.0/lookup
Request headers
Each request must have the following headers:
- Accept
Response content type. This header must have the
application/jsonvalue. - Authorization
This header must hold the Basic authorization string.
Basic authorization
The credentials for the Basic authorization scheme are constructed as follows:
- The username and the password are combined with a colon.
For example, if a username is
user, and a password ispassword, the string must beuser:password. - The resulting string is then base64 encoded.
For the example above, the resulting string is
dXNlcjpwYXNzd29yZA==. - The final authorization string is constructed by prepending the "Basic" string to the credentials string.
For the example above, the final authorization string is
Basic dXNlcjpwYXNzd29yZA==.
Response statuses
This section describes Kaspersky CyberTrace REST API response statuses.
For more information about responses, see the individual request descriptions.
200 OK
This status is returned for requests that were successfully processed. The response body holds the result.
201 Created
This status is returned when an entity (a supplier or an indicator) was successfully created. The response body holds the status of the operation.
202 Partial success
This status is returned when only a subset of entities (indicators) were successfully created. The response body holds the status of the operation and information about entities that were not processed.
401 Unauthorized user
The user is not authorized, the specified user does not exist, or the password specified in the authorization header is not valid.
Examples:
- A request without the Authorization header returns this status.
- A request with an authorization attempt for a non-existent user account returns this status.
403 User does not have rights to this operation
A user does not have rights to perform the operation. This may happen, for example, when the license key does not include the indicator search functionality, or when a user with the Analyst role attempts to add indicators or a new supplier.
The response body may contain the error description.
404 Request not supported
The specified request or API version is not supported.
Examples:
- The login request is not supported. A
POST /api/1.0/loginrequest returns this status. - The API version 8.0 is not supported. A
POST /api/8.0/lookupreturns this status.
405 Method Not Allowed
The specified method is not supported.
For example, the lookup request supports only the POST method. A GET /api/1.0/lookup request returns this status.
425 Kaspersky CyberTrace initializing
A request was made while Kaspersky CyberTrace is still initializing.
406 Not Acceptable
The specified data format is not supported.
For example, if the Accept header contains the application/pdf value, the response returns this status.
429 Too Many Requests
Kaspersky CyberTrace cannot process the request.
The request is rejected and is not processed. You must make another request later.
400 Bad Request
The request has an incorrect format:
- Mandatory headers are not present in the request.
- Request body is required, but not present.
- Request body has an incorrect format.
- Request body parameters have invalid values.
- Request body size does not conform to the size requirements.
500 Internal Server Error
An error occurred while processing the request
The response body may contain the error description.
Page topRequests
This section describes requests that you can make using the Kaspersky CyberTrace API, responses to these requests, and provides examples.
The requests available in the REST API are described below.
Indicator search
You can perform an indicator search with the following request:
POST /api/1.0/lookupPerforms an indicator search in the General tenant.
Managing suppliers
You can manage REST API suppliers by using the following requests:
GET /api/1.0/suppliersGets a list of suppliers and their statuses.
POST /api/1.0/suppliersAdds a new supplier.
GET /api/1.0/suppliers/{supplier}Gets information about a specified supplier.
PUT /api/1.0/suppliers/{supplier}Updates the specified supplier information.
DELETE /api/1.0/suppliers/{supplier}Deletes the specified supplier.
Managing indicators
You can manage indicators in REST API suppliers by using the following requests:
PUT /api/1.0/suppliers/{supplier}/indicatorsAdds new indicators to a supplier and updates existing indicators.
/api/1.0/suppliers/{supplier}/indicatorsDeletes the specified indicators from a supplier.
POST lookup
Performs an indicator search.
Path
/api/1.0/lookup
Method
POST
Request headers
This request has the following headers.
Request headers
Name |
Value |
Description |
|---|---|---|
|
|
|
|
|
Response content type. |
|
|
Request content type. You can also specify the |
|
|
Request body size, in bytes. The maximum body size for this request is 64 MB ( |
Request body
This request body contains a JSON array of objects for search. At least one object must be specified.
[{"object":"%OBJECT_VALUE%"},...{"object":"%OBJECT_VALUE%"}]
Object properties are described in the following table.
Object properties
Property |
Value |
Mandatory |
Description |
|---|---|---|---|
|
|
Yes |
Object for search. |
Request example
The following is an example of a POST lookup request.
POST https://192.0.2.57/api/1.0/lookup
Accept: application/json Content-Type: application/json Authorization: Basic Content-Length: 81
[] |
Response headers
The response has the following headers.
Response headers
Name |
Value |
Description |
|---|---|---|
Content-Type |
|
Response content type. |
Content-Length |
|
Response body size, in bytes. |
Response body
The response body contains a JSON array of search result objects.
[
{
"object": "%OBJECT_VALUE%",
"result": "%LOOKUP_RESULT%",
"categories":
[
{
"category": "%CATEGORY_1%",
"detected_indicator": "%DETECTED_INDICATOR%",
"context":
{
"%supplier_field_1%": "%supplier_field_1_value%",
...
"%supplier_field_N%": "%supplier_field_N_value%"
}
},
...
{
"category": "%CATEGORY_N%",
"detected_indicator": "%DETECTED_INDICATOR%",
"context":
{
"%supplier_field_1%": "%supplier_field_1_value%",
...
"%supplier_field_N%": "%supplier_field_N_value%"
}
}
]
},
...
{
"object": "%OBJECT_VALUE%",
"result": "%LOOKUP_RESULT%",
"categories":
[
{
"category": "%CATEGORY_1%",
"detected_indicator": "%DETECTED_INDICATOR%",
"context":
{
"%supplier_field_1%": "%supplier_field_1_value%",
...
}
},
...
]
}
]
Search result object properties are described in the following table.
Search result object properties
Property |
Value |
Description |
|---|---|---|
|
|
Object that was searched. |
|
|
Search result. The following values are possible:
|
|
|
An array of category objects, as described below. This property is included if result is |
|
|
Cause of the error. |
Properties of category objects are described in the following table.
Category object properties
Property |
Value |
Description |
|---|---|---|
|
|
Detection category. |
|
|
Matched indicator. |
|
|
Array of context objects. |
Properties of context objects are described in the following table.
Context object properties
Property |
Value |
Description |
|---|---|---|
|
|
The name of the property corresponds to the name of a field of a matched indicator. The value of the property contains the value of the field. |
Response example
The following is an example of a POST lookup request response.
НТТР/1.1 200 ОК Date:Mon, 23 Dec 2019 09:56:10 UTC Content-Type: application/json Content-Length: 372
[ ]}, {"object":"http:\/\/error.example.com","result":"error","reason":"Limit on the lookup operation exceeded"} ] |
Error responses
For more information about possible response statuses, see Response statuses.
An error response contains a JSON object with the error description.
[
{
"status": "%ERROR%"
}
]
Error object properties are described in the following table.
Error object properties
Property |
Value |
Description |
|---|---|---|
|
|
Error description. |
|
|
Cause of the error. |
Error response example
The following is an example of a POST lookup error response.
НТТР/1.1 500 Internal Server Error Date:Mon, 23 Dec 2019 09:56:10 UTC Content-Type: application/json Content-Length: 75
[{"status": "An error occurred while performing the lookup of indicators", "reason": "The database is not available"}] |
GET suppliers
Gets a list of suppliers and their statuses.
Only suppliers that were created with the REST API, FalsePositive, and InternalTI suppliers are returned.
Path
/api/1.0/suppliers
Method
GET
Request headers
This request has the following headers.
Request headers
Name |
Value |
Description |
|---|---|---|
|
|
|
|
|
Response content type. |
Request body
This request has an empty body.
Request example
The following is an example of a GET suppliers request.
GET https://192.0.2.57/api/1.0/
Accept: application/json Authorization: Basic |
Response headers
The response has the following headers.
Response headers
Name |
Value |
Description |
|---|---|---|
Content-Type |
|
Response content type. |
Content-Length |
|
Response body size, in bytes. |
Response body
The response body contains a JSON array of supplier status objects.
[
{
"name":"%SUPPLIER_NAME_1%",
"status": "%SUPPLIER_STATUS%"
},
...
{
"name":"%SUPPLIER_NAME_N%",
"status": "%SUPPLIER_STATUS%"
}
]
Supplier status object properties are described in the following table.
Supplier status object properties
Property |
Value |
Description |
|---|---|---|
|
|
Name of the supplier. |
|
|
Status of the supplier. This value is This value is |
Response example
The following is an example of a GET suppliers request response.
НТТР/1.1 200 ОК Date:Mon, 23 Dec 2019 09:56:10 UTC Content-Type: application/json Content-Length: 99
[ {"name":"ExampleSupplier", "status":"enabled"}, {"name":"AnotherExampleSupplier", "status":"disabled"} ] |
Error responses
For more information about possible response statuses, see Response statuses.
An error response contains a JSON object with the error description.
[
{
"status": "An error occurred while getting a list of suppliers",
}
]
Error object properties are described in the following table.
Error object properties
Property |
Value |
Description |
|---|---|---|
|
|
Error description. |
Error response example
The following is an example of a GET suppliers error response.
НТТР/1.1 500 Internal Server Error Date:Mon, 23 Dec 2019 09:56:10 UTC Content-Type: application/json Content-Length: 63
[{"status": "An error occurred while getting a list of suppliers"}] |
POST suppliers
Adds a new supplier.
The added supplier is a REST API supplier and can be managed with REST API methods. The new supplier is enabled by default.
Path
/api/1.0/suppliers
Method
POST
Request headers
This request has the following headers.
Request headers
Name |
Value |
Description |
|---|---|---|
|
|
|
|
|
Response content type. |
|
|
Request content type. You can also specify the |
|
|
Request body size, in bytes. The maximum body size for this request is 128 MB ( |
Request body
This request body contains a JSON array with a supplier object. Only one supplier object must be specified.
[
{
"name":"%SUPPLIER_NAME%",
"confidence": %SUPPLIER_CONFIDENCE%,
"retention": %SUPPLIER_RETENTION%,
"vendor": "%SUPPLIER_VENDOR%"
}
]
Supplier object properties are described in the following table.
Supplier object properties
Property |
Value |
Mandatory |
Description |
|---|---|---|---|
|
|
Yes |
Name of the supplier. The name of the supplier must contain only Latin letters, digits, hyphens ( Do not use FalsePositive or InternalTI as the supplier name, since they are reserved for the built-in supplier names of Kaspersky CyberTrace. |
|
|
Yes |
Confidence level for indicators from this supplier. The range of values for this parameter is from |
|
|
Yes |
Retention period for indicators, in minutes. This parameter determines the timeout after which indicators from this supplier are not used in matching. The timeout is calculated from the last update of the indicator. |
|
|
No |
Supplier vendor name. |
Request example
The following is an example of a POST suppliers request.
POST https://192.0.2.57/api/1.0/
Accept: application/json Content-Type: application/json Authorization: Basic Content-Length: 91 [ {"name":"ExampleSupplier", "confidence": 90, "retention": 5000, "vendor": "ExampleVendor"} ] |
Response headers
The response has the following headers.
Response headers
Name |
Value |
Description |
|---|---|---|
Content-Type |
|
Response content type. |
Content-Length |
|
Response body size, in bytes. |
Response body
The response body contains a JSON object with a status of the operation.
[
{
"status": "Supplier successfully created"
}
]
Status object properties are described in the following table.
Status object properties
Property |
Value |
Description |
|---|---|---|
|
|
Status of the operation. |
Response example
The following is an example of a POST suppliers request response.
НТТР/1.1 201 ОК Date:Mon, 23 Dec 2019 09:56:10 UTC Content-Type: application/json Content-Length: 41
[{"status": "Supplier successfully created"}] |
Error responses
For more information about possible response statuses, see Response statuses.
An error response contains a JSON object with the error description.
[
{
"status": "An error occurred while creating some suppliers",
"reason": "%REASON%"
}
]
Error object properties are described in the following table.
Error object properties
Property |
Value |
Description |
|---|---|---|
|
|
Error description. |
|
|
Cause of the error. |
Error response example
The following is an example of a POST suppliers error response.
ННТТР/1.1 400 Bad Request Date:Mon, 23 Dec 2019 09:56:10 UTC Content-Type: application/json Content-Length: 92
[] |
GET suppliers/{supplier}
Gets information about a specified supplier.
Only suppliers that were created with REST API, FalsePositive, and InternalTI suppliers are returned.
Path
/api/1.0/suppliers/{supplier}
Method
GET
Request headers
This request has the following headers.
Request headers
Name |
Value |
Description |
|---|---|---|
|
|
|
|
|
Response content type. |
Request parameters
This request has the following parameters:
Request parameters
Name |
Parameter type |
Description |
|---|---|---|
|
Path |
Name of the supplier. |
Request body
This request has an empty body.
Request example
The following is an example of a GET suppliers/{supplier} request.
GET https://192.0.2.57/api/1.0/
Accept: application/json Authorization: Basic |
Response headers
The response has the following headers.
Response headers
Name |
Value |
Description |
|---|---|---|
Content-Type |
|
Response content type. |
Content-Length |
|
Response body size, in bytes. |
Response body
The response body contains a JSON array with a supplier information object.
[
{
"name": "%SUPPLIER_NAME%",
"status": "%SUPPLIER_STATUS%",
"confidence": %SUPPLIER_CONFIDENCE%,
"retention": %SUPPLIER_RETENTION%,
"vendor": "%SUPPLIER_VENDOR%"
}
]
Supplier information object properties are described in the following table.
Supplier information object properties
Property |
Value |
Description |
|---|---|---|
|
|
Name of the supplier. |
|
|
Status of the supplier. This value is This value is |
|
|
Confidence level for indicators from this supplier. |
|
|
Retention period for indicators, in minutes. |
|
|
Supplier vendor name. |
Response example
The following is an example of a GET suppliers/{supplier} request response.
НТТР/1.1 200 ОК Date:Mon, 23 Dec 2019 09:56:10 UTC Content-Type: application/json Content-Length: 108
[ {name:"ExampleSupplier", "status":"enabled", "confidence": 90, "retention": 5000, "vendor": "ExampleVendor"} ] |
Error responses
For more information about possible response statuses, see Response statuses.
An error response contains a JSON object with the error description.
[
{
"status": "Supplier doesn't exist",
}
]
Error object properties are described in the following table.
Error object properties
Property |
Value |
Description |
|---|---|---|
|
|
Error description. |
Error response example
The following is an example of a GET suppliers error response.
НТТР/1.1 404 Supplier doesn't exist Date:Mon, 23 Dec 2019 09:56:10 UTC Content-Type: application/json Content-Length: 34
[{"status": "Supplier doesn't exist"}] |
PUT suppliers/{supplier}
Updates the specified supplier information.
Only suppliers that were created with the REST API can be updated with this request.
Path
/api/1.0/suppliers/{supplier}
Method
PUT
Request headers
This request has the following headers.
Request headers
Name |
Value |
Description |
|---|---|---|
|
|
|
|
|
Response content type. |
|
|
Request content type. You can also specify the |
|
|
Request body size, in bytes. The maximum body size for this request is 128 MB ( |
Request parameters
This request has the following parameters:
Request parameters
Name |
Parameter type |
Description |
|---|---|---|
|
Path |
Name of the supplier. |
Request body
This request body contains a JSON array with a supplier object. Only one supplier object must be specified.
[
{
"name":"%SUPPLIER_NAME%",
"status":"%SUPPLIER_STATUS%,
"confidence": %SUPPLIER_CONFIDENCE%,
"retention": %SUPPLIER_RETENTION%,
"vendor": "%SUPPLIER_VENDOR%"
}
]
Supplier object properties are described in the following table.
Supplier object properties
Property |
Value |
Mandatory |
Description |
|---|---|---|---|
|
|
No |
Name of the supplier. |
|
|
No |
Status of the supplier. This value must be This value must be |
|
|
No |
Confidence level for indicators from this supplier. |
|
|
No |
Retention period for indicators, in hours. This parameter determines the period after which indicators from this supplier are not used in matching. |
|
|
No |
Supplier vendor name. |
Request example
The following is an example of a PUT suppliers/{supplier} request.
PUT https://192.0.2.57/api/1.0/
Accept: application/json Content-Type: application/json Authorization: Basic Content-Length: 41
[ {"name":"NewName", "confidence": 90} ] |
Response headers
The response has the following headers.
Response headers
Name |
Value |
Description |
|---|---|---|
Content-Type |
|
Response content type. |
Content-Length |
|
Response body size, in bytes. |
Response body
The response body contains a JSON object with a status of the operation.
[
{
"status": "Supplier info successfully updated"
}
]
Status object properties are described in the following table.
Status object properties
Property |
Value |
Description |
|---|---|---|
|
|
Status of the operation. |
Response example
The following is an example of a PUT suppliers/{supplier} request response.
НТТР/1.1 201 ОК Date:Mon, 23 Dec 2019 09:56:10 UTC Content-Type: application/json Content-Length: 46
[{"status": "Supplier info successfully updated"}] |
Error responses
For more information about possible response statuses, see Response statuses.
An error response contains a JSON array with the error description.
[
{
"status": "An error occurred while updating Supplier info",
"reason": "%REASON%"
}
]
Error object properties are described in the following table.
Error object properties
Property |
Value |
Description |
|---|---|---|
|
|
Error description. |
|
|
Cause of the error. |
Error response example
The following is an example of a PUT suppliers/{supplier} error response.
НТТР/1.1 404 Supplier doesn't exist Date:Mon, 23 Dec 2019 09:56:10 UTC Content-Type: application/json Content-Length: 93
[{"status": "An error occurred while updating supplier info", "reason": "Supplier doesn't exist"}] |
DELETE suppliers/{supplier}
Deletes the specified supplier.
Only suppliers that were created with the REST API can be deleted with this request.
Path
/api/1.0/suppliers/{supplier}
Method
DELETE
Request headers
This request has the following headers.
Request headers
Name |
Value |
Description |
|---|---|---|
|
|
|
|
|
Response content type. |
Request parameters
This request has the following parameters:
Request parameters
Name |
Parameter type |
Description |
|---|---|---|
|
Path |
Name of the supplier. |
Request body
This request has an empty body.
Request example
The following is an example of a DELETE suppliers/{supplier} request.
DELETE https://192.0.2.57/api/1.0/
Accept: application/json Authorization: Basic |
Response headers
The response has the following headers.
Response headers
Name |
Value |
Description |
|---|---|---|
Content-Type |
|
Response content type. |
Content-Length |
|
Response body size, in bytes. |
Response body
The response body contains a JSON object with a status of the operation.
[
{
"status": "Supplier successfully removed"
}
]
Status object properties are described in the following table.
Status object properties
Property |
Value |
Description |
|---|---|---|
|
|
Status of the operation. |
Response example
The following is an example of a DELETE suppliers/{supplier} request response.
НТТР/1.1 201 ОК Date:Mon, 23 Dec 2019 09:56:10 UTC Content-Type: application/json Content-Length: 46
[{"status": "Supplier successfully removed"}] |
Error responses
For more information about possible response statuses, see Response statuses.
An error response contains a JSON object with the error description.
[
{
"status": "An error occurred while removing the supplier",
"reason": "%REASON%"
}
]
Error object properties are described in the following table.
Error object properties
Property |
Value |
Description |
|---|---|---|
|
|
Error description. |
|
|
Cause of the error. This property may not be present in the response. |
Error response example
The following is an example of a DELETE suppliers/{supplier} error response.
ННТТР/1.1 404 Supplier doesn't exist Date:Mon, 23 Dec 2019 09:56:10 UTC Content-Type: application/json Content-Length: 86
[{"status": "An error occurred while removing the supplier", "reason": "Supplier doesn't exist"}] |
PUT suppliers/{supplier}/indicators
Adds new indicators to a supplier and updates existing indicators.
Only indicators from suppliers created with the REST API can be updated with this request.
Path
/api/1.0/suppliers/{supplier}/indicators
Method
PUT
Request headers
This request has the following headers.
Request headers
Name |
Value |
Description |
|---|---|---|
|
|
|
|
|
Response content type. |
|
|
Request content type. You can also specify the |
|
|
Request body size, in bytes. The maximum body size for this request is 128 MB ( |
Request parameters
This request has the following parameters:
Request parameters
Name |
Parameter type |
Description |
|---|---|---|
|
Path |
Name of the supplier. |
Request body
This request body contains a JSON array of indicator objects.
[
{
"indicator":"%INDICATOR_VALUE_1%",
"context":
{
"%FIELD_NAME_1%":"%FIELD_VALUE_1%",
...
"%FIELD_NAME_N%":"%FIELD_VALUE_N%"
}
},
...
{
"indicator":"%INDICATOR_VALUE_N%",
"context":
{
"%FIELD_NAME_1%":"%FIELD_VALUE_1%",
...
"%FIELD_NAME_N%":"%FIELD_VALUE_N%"
}
}
]
Indicator object properties are described in the following table.
Indicator object properties
Property |
Value |
Mandatory |
Description |
|---|---|---|---|
|
|
Yes |
Value of the indicator. You can specify the following indicator types:
|
|
Indicator context object |
No (see description) |
Indicator context. This property must contain an indicator context object. If you are adding indicators to the FalsePositive supplier, do not specify the context property. |
Indicator context object properties are described in the following table.
Indicator context object properties
Property |
Value |
Mandatory |
Description |
|---|---|---|---|
|
|
Yes |
One or more context fields for the indicator. The name of the property must correspond to the name of the context field of the indicator. The value of the property must correspond to the value of the context field of the indicator. |
Request example
The following is an example of a PUT suppliers/{supplier}/indicators request.
PUT https://192.0.2.57/api/1.0/
Accept: application/json Content-Type: application/json Authorization: Basic Content-Length: 150
[ {"indicator":"tux.example.com","context":{"ip":"192.0.2.42","name":"ExampleIndicator", "threat_level":1}}, {"indicator":"malicious.example.com"} ] |
Response headers
The response has the following headers.
Response headers
Name |
Value |
Description |
|---|---|---|
Content-Type |
|
Response content type. |
Content-Length |
|
Response body size, in bytes. |
Response body
The response body contains a JSON object with a status of the operation.
[
{
"status": "All indicators were successfully added to the database"
}
]
Status object properties are described in the following table.
Status object properties
Property |
Value |
Description |
|---|---|---|
|
|
Status of the operation. |
Response example
The following is an example of a PUT suppliers/{supplier}/indicators request response.
НТТР/1.1 201 ОК Date:Mon, 23 Dec 2019 09:56:10 UTC Content-Type: application/json Content-Length: 46
[{"status": "All indicators successfully added to the database"}] |
Partial success response
This response is generated when not all indicators were successfully processed.
The response body contains the partial success object with the status of the operation and an array of indicator error objects:
[
{
"status": "An error occurred while adding some of the indicators to the database",
"error_indicators":[
{
"indicator": "%INDICATOR_VALUE_1%",
"reason": "%REASON%"
},
...
{
"indicator": "%INDICATOR_VALUE_N%",
"reason": "%REASON%"
}
]
}
]
Partial success object properties are described in the following table.
Partial success object properties
Property |
Value |
Description |
|---|---|---|
|
|
Status of the operation. |
|
Indicator error objects |
Array of information about indicators that were not processed. |
Indicator error object properties are described in the following table.
Indicator error object properties
Property |
Value |
Description |
|---|---|---|
|
|
Indicator that was not processed. |
|
|
Cause of the error. This property may not be present in the response. |
Partial success response example
The following is an example of a partial success response for the PUT suppliers/{supplier}/indicators request.
НТТР/1.1 202 Partial success Date:Mon, 23 Dec 2019 09:56:10 UTC Content-Type: application/json Content-Length: 265
[]}] |
Error responses
For more information about possible response statuses, see Response statuses.
An error response contains a JSON object with the error description.
[
{
"status": "An error occurred while adding indicators to the database",
}
]
Error object properties are described in the following table.
Error object properties
Property |
Value |
Description |
|---|---|---|
|
|
Error description. |
Error response example
The following is an example of a PUT suppliers/{supplier} error response.
ННТТР/1.1 500 Internal Server Error Date:Mon, 23 Dec 2019 09:56:10 UTC Content-Type: application/json Content-Length: 73
[{"status": "An error occurred while adding indicators to the database"}] |
DELETE suppliers/{supplier}/indicators
Deletes the specified indicators from a supplier.
Only indicators from suppliers created with the REST API can be deleted with this request.
Path
/api/1.0/suppliers/{supplier}/indicators
Method
DELETE
Request headers
This request has the following headers.
Request headers
Name |
Value |
Description |
|---|---|---|
|
|
|
|
|
Response content type. |
|
|
Request content type. You can also specify the |
|
|
Request body size, in bytes. The maximum body size for this request is 64 MB ( |
Request parameters
This request has the following parameters:
Request parameters
Name |
Parameter type |
Description |
|---|---|---|
|
Path |
Name of the supplier. |
Request body
This request body contains a JSON array of indicator objects.
[
{
"indicator":"%INDICATOR_VALUE_1%",
},
...
{
"indicator":"%INDICATOR_VALUE_N%",
}
]
Indicator object properties are described in the following table.
Indicator object properties
Property |
Value |
Mandatory |
Description |
|---|---|---|---|
|
|
Yes |
An indicator that must be deleted. You can specify the following indicator types:
|
Request example
The following is an example of a DELETE suppliers/{supplier}/indicators request.
DELETE https://192.0.2.57/api/1.0/
Accept: application/json Content-Type: application/json Authorization: Basic Content-Length: 77
[ {"indicator":"tux.example.com"}, {"indicator":"malicious.example.com"} ] |
Response headers
The response has the following headers.
Response headers
Name |
Value |
Description |
|---|---|---|
Content-Type |
|
Response content type. |
Content-Length |
|
Response body size, in bytes. |
Response body
The response body contains a JSON object with a status of the operation.
[
{
"status": "All indicators were successfully deleted from the database"
}
]
Status object properties are described in the following table.
Status object properties
Property |
Value |
Description |
|---|---|---|
|
|
Status of the operation. |
Response example
The following is an example of a DELETE suppliers/{supplier}/indicators request response.
НТТР/1.1 201 ОК Date:Mon, 23 Dec 2019 09:56:10 UTC Content-Type: application/json Content-Length: 74
[{"status": "All indicators were successfully deleted from the database"}] |
Partial success response
This response is generated when not all indicators were successfully deleted.
The response body contains the partial success object with the status of the operation and an array of indicator error objects:
[
{
"status": "An error occurred while deleting some of the indicators from the database",
"error_indicators":[
{
"indicator": "%INDICATOR_VALUE_1%",
"reason": "%REASON%"
},
...
{
"indicator": "%INDICATOR_VALUE_N%",
"reason": "%REASON%"
}
]
}
]
Partial success object properties are described in the following table.
Partial success object properties
Property |
Value |
Description |
|---|---|---|
|
|
Status of the operation. |
|
Indicator error objects |
Array of information about indicators that were not deleted. |
Indicator error object properties are described in the following table.
Indicator error object properties
Property |
Value |
Description |
|---|---|---|
|
|
Indicator that was not deleted. |
|
|
Cause of the error. This property may not be present in the response. |
Partial success response example
The following is an example of a partial success response for the DELETE suppliers/{supplier}/indicators request.
НТТР/1.1 202 Partial success Date:Mon, 23 Dec 2019 09:56:10 UTC Content-Type: application/json Content-Length: 251
[]}] |
Error responses
For more information about possible response statuses, see Response statuses.
An error response contains a JSON object with the error description.
[
{
"status": "An error occurred while deleting indicators from the database",
}
]
Error object properties are described in the following table.
Error object properties
Property |
Value |
Description |
|---|---|---|
|
|
Error description. |
Error response example
The following is an example of a PUT suppliers/{supplier} error response.
ННТТР/1.1 500 Internal Server Error Date:Mon, 23 Dec 2019 09:56:10 UTC Content-Type: application/json Content-Length: 77
[{"status": "An error occurred while deleting indicators from the database"}] |
Troubleshooting
This section contains information to help solve problems that you might encounter while using Kaspersky CyberTrace.
General troubleshooting
This section provides information to help you solve problems you might encounter when using Kaspersky CyberTrace.
If you encounter a problem while using Kaspersky CyberTrace, the specialists at Kaspersky can assist you. Contact your technical account manager (TAM) for more information about solutions to problems.
Problem: An error occurs when installing Kaspersky CyberTrace in Windows by using the executable installer
To solve this problem:
- Locate the log file of the executable installer:
- Navigate to the
C:\Windows\tempfolder. - In this folder, locate the installation log file. This file is named
ktfs_install_%timestamp%.log, where%timestamp%is the time of the installation in the "yyyymmddhhmmss" format.
- Navigate to the
- In the log file, look for an error message that contains additional details about the error.
- If the information in the log file does not help you to solve the error, contact your technical account manager (TAM).
Problem: The result of the verification test (self-test) is unexpected
To solve this problem when using Kaspersky CyberTrace Web:
- If one or more Kaspersky Threat Data Feeds fail the self-test that you ran on the Settings > Service tab by clicking Run self-test:
- If you defined any filtering rules on the Settings > Feeds tab, in the Filtering rules for feeds section, in the Filtering rules subsection, remove these filtering rules, and then click Save at the bottom of the page.
- On the Settings > Feeds tab, in the Feeds update section, click the Launch update now button to update your feeds.
Re-run the self-test. If all Kaspersky Threat Data Feeds pass the test, add the filtering rules again, if necessary. If the problem persists, please contact your technical account manager (TAM).
- If one or more Kaspersky Threat Data Feeds fail the verification test that you ran to check whether Kaspersky CyberTrace is correctly integrated with your SIEM solution:
- Check the feeds through Kaspersky CyberTrace Web:
- If you defined any filtering rules on the Settings > Feeds tab, in the Filtering rules for feeds section, in the Filtering rules subsection, remove these filtering rules, and then click Save at the bottom of the page.
- On the Settings > Feeds tab, in the Feeds update section, click the Launch update now button to update your feeds.
Re-run the self-test. If all Kaspersky Threat Data Feeds pass the test, add the filtering rules again by using Kaspersky CyberTrace Web, if necessary.
- Check the connection between the computer with Kaspersky CyberTrace and the computer with your SIEM solution, in both directions; that is, make sure that the computer with Kaspersky CyberTrace can be reached from the computer with your SIEM solution, and the computer with your SIEM solution can be reached from the computer with Kaspersky CyberTrace. Execute the following command on the command line:
ping %ip%Here,
%ip%is the IP address of the computer with Kaspersky CyberTrace (if the command is executed on the computer with your SIEM solution) or the IP address of the computer with your SIEM solution (if the command is executed on the computer with Kaspersky CyberTrace). - Depending on the execution result of the
pingcommand, do one of the following:- If the command failed on any computer, please ask your system administrator to check and, if necessary, reconfigure the firewall.
- If the command finished successfully on both the Kaspersky CyberTrace computer and the computer with your SIEM solution installed—and if you tried the solutions suggested in step 2a above but are still getting the wrong verification test results—please contact your technical account manager (TAM).
- Check the feeds through Kaspersky CyberTrace Web:
To solve this problem if you do not use Kaspersky CyberTrace Web, do the following:
- If you defined any filtering rules in the Feed Utility configuration file, remove them and run Feed Utility for the changes to take effect.
Re-run the verification test. If all Kaspersky Threat Data Feeds pass the test, add the filtering rules to the configuration file again, if necessary.
- Check the connection between the computer with Kaspersky CyberTrace and the computer with your SIEM solution in both directions. That is, make sure that the computer with Kaspersky CyberTrace can be reached from the computer with your SIEM solution, and that the computer with your SIEM solution can be reached from the computer with Kaspersky CyberTrace. Execute the following command on the command line:
ping %ip%Here,
%ip%is the IP address of the computer with Kaspersky CyberTrace (if the command is executed on the computer with your SIEM solution) or the IP address of the computer with your SIEM solution (if the command is executed on the computer with Kaspersky CyberTrace). - Depending on the execution result of the
pingcommand, do one of the following:- If the command failed on any computer, please ask your system administrator to check and, if necessary, reconfigure the firewall.
- If the command finished successfully and you tried (without result) editing the Feed Utility configuration file by removing the filtering rules and then running Feed Utility, please contact your technical account manager (TAM).
Problem: Feed Service cannot start
To solve this problem, try the following actions:
- Make sure that the port specified in the input settings is open.
- Check that the Feed Service configuration file is correct.
- Perform the initial configuration of Kaspersky CyberTrace:
/opt/kaspersky/ktfs/bin/configure -i
Problem: Feed Service does not write logs
To solve this problem, try the following actions:
- Make sure that Feed Service is running.
- Check the settings specified in the kl_feed_service_log.conf file.
- Contact your technical account manager (TAM).
Problem: The feeds cannot be downloaded
To solve this problem, try the following actions:
- Make sure that authentication of the proxy server is successful.
- Make sure that the certificate provided by your TAM is valid and has not expired.
Problem: The certificate cannot be authenticated
The "peer certificate cannot be authenticated with given CA certificates" error message appears in this case.
To solve this problem, try the following actions:
Make sure that you have the correct root certificate installed on your system. If you do not have the required root certificate, follows these steps:
- Go to https://wlinfo.kaspersky.com/ and authenticate with your certificate.
- In the leftmost part of the address bar of your browser, click the "lock" icon and select Certificate.
The Certificate window opens.
- In the Certificate window, select the Certification Path tab.
- Select the root certificate (the certificate at the top of the certification path) and click the View Certificate button.
The Certificate window opens.
- In the Certificate window, select the Details tab.
- In the table that appears, find the Serial number field and note its value. Do not close the window.
- Go to https://www.digicert.com/digicert-root-certificates.htm and use the serial number from step 6 to find the required root certificate.
- Download this root certificate and follow the standard procedure for your operating system to install it to the certificate store.
When following the linked procedure, make sure that you use the root certificate downloaded in steps 7 and 8, and not the one exported through a browser by clicking Copy to File.
You can use this procedure to solve the same problem with https://127.0.0.1 (or https://localhost) and other sites that Kaspersky CyberTrace visits to download custom or third-party feeds.
Problem: Microsoft Internet Explorer 11 does not display fonts and font styles properly
The cause of this problem may be the accessibility settings of Internet Explorer.
To solve this problem, try the following actions:
- Open Internet Explorer.
- Select the Tools button, and then select Internet options.
- Select the General tab, and then select Accessibility.
- Make sure that the Ignore font styles specified on webpages and Ignore font sizes specified on webpages check boxes are not selected.
- Click OK, and then OK again.
Feed Utility troubleshooting
This section provides information to help you solve problems you might encounter when using Feed Utility.
If you encounter a problem while using Feed Utility, the specialists at Kaspersky can assist you. Contact your technical account manager (TAM) for more information about solutions to problems.
Network problems
If Feed Utility does not download feeds, or you encounter any network-related problem:
- Check that the certificate specified in the configuration file is valid. The default certificate from the distribution kit can be used to download demo feeds only.
- Check that the network is configured properly.
If you want Feed Utility to access Kaspersky servers through a proxy server, use the --set-proxy command to configure the proxy server parameters. In this case, make sure that your user name and password for the proxy server are valid and have not expired.
An SSL error while downloading a third-party feed
If an SSL error occurs while downloading a third-party feed:
- Check that your operating system has a root certificate for the third-party feed source. If required, import the root certificate for the third-party feed source using standard system tools and utilities.
Problems with feed processing
If Feed Utility does not process feeds as required:
- Check that the configuration file parameters are specified without typos. Feed Utility ignores parameter names with typos. For example, if you specify a
ReqFieldsparameter instead ofRequiredFields, Feed Utility will ignore this parameter. - Check that feed rules and filtering rules are specified correctly. For example, filtering rules may be specified in such a way that no records are included in the resulting feed.
- If you download and unpack feeds (with the
-d-ucommands) separately from processing them (with the-pcommand), Feed Utility may print an error message about several versions of the original feed file. Make sure that you delete the original feed files in the directory where Feed Utility unpacks them. Feed Utility does not do this automatically.
Other problems
In case of other problems, contact your technical account manager (TAM).
Page topCyberTrace Web troubleshooting
This section provides information to help you solve problems that you might encounter when using Kaspersky CyberTrace Web.
If you encounter a problem while using Kaspersky CyberTrace Web, the specialists at Kaspersky can assist you. Contact your technical account manager (TAM) for more information about solutions to problems.
Problem: I forgot my password
To solve this problem, try the following actions:
- If your user account role is Analyst, contact your Administrator to change the password.
- If your user account role is Administrator, and you want to change the password for another user, see User settings.
- If your user account role is Administrator, and you want to reset the password for your user account, see Using Password Utility.
Problem: A white screen is displayed when CyberTrace Web is opened in a browser
A possible reason for this problem is the use of an unsupported browser. Please check that you use a supported browser.
Problem: "Could not update feeds" error message is displayed when updating feeds manually
To solve this problem, try the following actions:
- Try to run the update process again later. The source of this problem is another update process that runs at the same time.
- Contact your technical account manager (TAM).
Problem: Untrusted connection error when connecting to Kaspersky CyberTrace Web
The SSL certificates that are generated during the installation of CyberTrace are self-signed, and so the browser you use informs you about an untrusted connection.
To solve this problem, try the following actions:
- (Recommended) Use other certificates that are trusted in your infrastructure.
- If you cannot use other certificates, you can add the initially generated certificates as trusted to your browser or operating system.
Problem: The SSL certificate has expired
The SSL certificates that are generated during the installation of CyberTrace are valid for two years. If the certificates expire, you must generate new certificates.
To solve this problem, try the following actions:
- In Linux:
- Run the following command in the console:
%service_dir%/configure --change - Specify the same parameters that you specified during the previous CyberTrace installation.
- Run the following command in the console:
- In Windows:
- Run the executable installer of Kaspersky CyberTrace.
- Click the Change button.
- Specify the same parameters that you specified during the previous Kaspersky CyberTrace installation.
Problem: An error occurred while searching for indicators from a log file or file hashes
There are several possible reasons for this error:
- There is no free disk space on the computer on which Kaspersky CyberTrace is installed.
We recommend that you do the following:
- Restart Kaspersky CyberTrace: some files might be left that are related to previous searches.
- Delete unnecessary files from the computer on which Kaspersky CyberTrace is installed.
- An error occurred while trying to open a file selected for a search. This can occur when a file has been removed or if the Kaspersky CyberTrace process did not have read rights to the file.
- Make sure that the file is not removed and you have access to it.
Problem: Cannot sign in to Kaspersky CyberTrace after it is updated
To solve this problem, try the following actions:
- Clear the browser cache using the standard method for your browser.
Splunk troubleshooting
This section provides information to help you solve problems you might encounter when using Kaspersky CyberTrace with Splunk.
If you encounter a problem while using Kaspersky CyberTrace, the specialists at Kaspersky can assist you. Contact your technical account manager (TAM) for more information about solutions to problems.
Problem: Kaspersky CyberTrace App does not display the events from Feed Service or displays them incorrectly
To solve this problem, try the following actions:
- Make sure that the Feed Service computer is turned on and that Feed Service is running.
- Make sure that the Feed Service computer is accessible from the computer on which Splunk is installed. You can use the
pingutility for this purpose. - Make sure that the Feed Service configuration file contains a correct output connection string (you can check the connection string on the Settings > Service tab in Kaspersky CyberTrace Web).
- Make sure that ports and addresses for incoming events are specified correctly in the Kaspersky CyberTrace App configuration file.
- Make sure that the specified ports are open. You can use the
netcatutility for this purpose. - Try using the default integration scheme for Splunk and Feed Service (in this scheme, the forwarder, indexer, and search head are installed on a single computer).
Problem: Feed Service does not receive events from Splunk
To solve this problem, try the following actions:
- Make sure that the Splunk computer is turned on and that Splunk is running.
- Make sure that the Feed Service computer is accessible from the Splunk computer. You can use the
pingutility for this purpose. - Make sure that the events are forwarded from Splunk to Feed Service. Check that addresses and ports are specified correctly in Kaspersky CyberTrace App configuration files.
- Make sure that ports specified in the Kaspersky CyberTrace App configuration files are open on the Feed Service computer. You can use the
netcatutility for this purpose. - Try using the default integration scheme for Splunk and Feed Service.
ArcSight troubleshooting
This section provides information to help you solve problems you might encounter when using Kaspersky CyberTrace with ArcSight.
If you encounter a problem while using Kaspersky CyberTrace, the specialists at Kaspersky can assist you. Contact your technical account manager (TAM) for more information about solutions to problems.
Problem: ArcSight does not display the events from Feed Service or displays them incorrectly
To solve this problem, try the following actions:
- Make sure that the Feed Service computer is turned on and Feed Service is running (for Windows version, see section "Managing Feed Service using the script (Windows)").
- Make sure that the ArcSight computer is accessible from the Feed Service computer.
- Make sure that the port specified in the output connection string is open.
- Make sure that ArcSight Forwarding Connector and ArcSight SmartConnector (for Windows version, see section "Installing ArcSight SmartConnector (Windows)") are running.
- Make sure that Feed Service listens on the port to which Forwarding Connector sends data from ArcSight ESM.
- Make sure that Feed Service sends the events to ArcSight SmartConnector.
- Check that ArcSight SmartConnector is configured properly.
For this purpose, run the following command:
%ARCSIGHT_HOME%/current/bin/runagentsetup.sh(in Linux)%ARCSIGHT_HOME%\current\bin\runagentsetup.bat(in Windows)
Here
%ARCSIGHT_HOME%is the directory where ArcSight SmartConnector is installed.
Problem: An active channel does not display events after a new ARB package is imported
To solve this problem, try the following actions:
Check the filter used in the active channel:
- Go to Filters > Shared > All Filters > Public > Kaspersky CyberTrace Connector.
- Make sure that the
device productfield has the value ofKaspersky CyberTrace for ArcSight.
Create a new active channel:
- Delete the current active channel and create a new one.
- Configure the new active channel as follows:
- Set the
Start TimeandEnd Timeparameters as you wish. - Set the
Use as Timestampparameter toManager Receipt Time. - If you want the active channel to be updated automatically, select Continuously evaluate in the Time Parameters section of the active channel's properties.
- In the Filters section, specify the filter that has the same name as the active channel itself. You can find available filters in the tree view of ArcSight Console, at the Filters > Shared > All Filters > Public > Kaspersky CyberTrace Connector location when the Filters item is selected in the drop-down box.
- In the Fields section, specify the item that has the same name as the active channel itself.
You can find available fields in the tree view of ArcSight Console, at the Field Sets > Shared > All Field Sets > Public > Kaspersky CyberTrace Connector location when the Field Sets item is selected in the drop-down box.
- Set the
Problem: Feed Service does not receive events from ArcSight
To solve this problem, try the following actions:
- Make sure that the Feed Service computer is turned on and Feed Service is running (for Windows, see section "Managing Feed Service using the script (Windows)").
- Make sure that the ArcSight computer is turned on and ArcSight is running.
- Make sure that the Feed Service computer is accessible from the ArcSight computer.
You can use the
pingutility for this purpose. - Make sure that the port that is specified in the input connection string is open on the Feed Service computer.
You can use the
netcatutility for this purpose. - Check the regular expressions in the Feed Service configuration file or by using the Settings > Events Format tab in Kaspersky CyberTrace Web.
- Make sure that the ArcSight forwarding connector that you installed is running.
In Linux, you can use the following command for this purpose:
ps -Af | grep %DIR_NAME%/current/binHere
%DIR_NAME%is the directory in which the forwarding connector is installed. If the forwarding connector process is running, the information about it will be displayed in the console. - If Feed Service stopped receiving events from ArcSight after a new ARB package is imported, register ArcSight Forwarding Connector once more by running the following command and following the instructions of the wizard:
%ConnectorInstallDir%/current/bin/runagentsetup.shHere
%ConnectorInstallDir%is the directory in which ArcSight Forwarding Connector is installed.
Problem: an authentication error occurs in ArcSight Forwarding Connector or the account intended for use by ArcSight Forwarding Connector is absent
To solve this problem, try the following actions:
- Run ArcSight Console.
- Select Users > Shared > Custom User Groups.
- Create the Kaspersky CyberTrace Connector group.
- Right-click the Kaspersky CyberTrace Connector group, and then select Edit Access Control.
- Select the Events tab.
- Click Add.
- Select the CyberTrace forwarding events filter.
- Click Save.
- In the Kaspersky CyberTrace Connector group, specify the following options for the account:
- Any user name (for example,
FwdCyberTrace) - In the type field, the
Forwarding Connectortype - Password
- Any user name (for example,
These credentials will be used to forward events from ArcSight to Kaspersky CyberTrace.
Page topQRadar troubleshooting
This section provides information to help you solve problems you might encounter when using Kaspersky CyberTrace with QRadar.
If you encounter a problem while using Kaspersky CyberTrace, the specialists at Kaspersky can assist you. Contact your technical account manager (TAM) for more information about solutions to problems.
Problem: QRadar does not display the events from Feed Service or displays them incorrectly
To solve this problem, try the following actions:
- Make sure that the Feed Service computer is turned on and Feed Service is running.
- Make sure that the Feed Service configuration file contains a correct output connection string and the format of output events conforms to the QRadar LEEF standard.
- Make sure that Feed Service is added to QRadar as a log source.
- Make sure that the QIDs of the Feed Service events are imported to QRadar.
- Make sure that the QIDs are correctly mapped to the Feed Service events.
- Make sure that the QRadar computer is accessible from the Feed Service computer.
- Make sure that the port specified in the output connection string is open.
Problem: Feed Service does not receive events from QRadar
To solve this problem, try the following actions:
- Make sure that the events are forwarded from QRadar to Feed Service and the routing rules are set correctly.
- Make sure that the Feed Service computer is turned on and Feed Service is running.
- Make sure that the QRadar computer is turned on and QRadar is running.
- Make sure that the Feed Service computer is accessible from the QRadar computer.
You can use the
pingutility for this purpose. - Make sure that the port that is specified in the input connection string is open on the Feed Service computer.
You can use the
netcatutility for this purpose. - Check the regular expressions in the Feed Service configuration file or by using the Settings > Events Format tab in Kaspersky CyberTrace Web.
Problem: After Kaspersky Threat Feed App is installed and custom event properties are added, some of these event properties are incorrectly extracted from the detection event context
To solve this problem, try the following actions:
- In QRadar Console, select Admin > Custom Event Properties.
- Locate the custom event properties with the Log Source Type value of Kaspersky CyberTrace by sorting the table by log source type.
- Select the row corresponding to the property that is extracted incorrectly and click Edit.
The Custom Event Property Definition window opens.
- In the Test Field form, paste an example of an event generated by Kaspersky CyberTrace that contains the incorrectly extracted property.
- In the Property Expression Definition pane, in the Extraction section, change the value in the RegEx field from
%property%=([^=]*)(?:\s[^=]+=)to%property%=\[(.*)\], where%property%is the property name. - Click Test to make sure the required part of the event is highlighted in the Test Field form.
- Click Save to apply the changes.
Problem: After Kaspersky Threat Feed App is installed, no chart is displayed
To solve this problem, try the following actions:
- Wait until the data is loaded by QRadar.
Do the same when you change the log source name in the Kaspersky Threat Feed App settings.
Problem: A search cannot be made using Kaspersky Threat Feed App, or the self-test of Kaspersky Threat Feed App fails
To solve this problem, try the following actions:
- Make sure that you have specified the correct value in the
Feed Service Connection Stringsetting of Kaspersky Threat Feed App. - If Kaspersky CyberTrace is installed on the QRadar computer, add the necessary iptables rules, as described in section "Configuring Kaspersky Threat Feed App".
Problem: When you add a new regular expression to the event output format, QRadar extracts the incorrect corresponding value from Kaspersky CyberTrace detection events
To solve this problem, make sure that event fields in a row are separated by a tab character, as required by the LEEF standard.
Page topRSA NetWitness troubleshooting
This section lists actions that you can undertake and problems that you might encounter while integrating Kaspersky CyberTrace with RSA NetWitness.
If you encounter a problem while using Kaspersky CyberTrace, the specialists at Kaspersky can assist you. Contact your technical account manager (TAM) for more information about solutions to problems.
Checking whether events arrive from RSA NetWitness at Feed Service
There are several ways to check whether RSA NetWitness sends events to Feed Service:
- You can check whether the Feed Service log files contain messages about arriving of events from RSA NetWitness.
In this case the Feed Service logging configuration file (
bin/kl_feed_service_log.conf) must contain thedbgstring in theWriteLogelement. - You can use the netcat utility to send events from the computer on which RSA NetWitness is installed and then check whether the corresponding messages are added to the Feed Service log files.
- You can stop Feed Service and use the netcat utility to listen for events from RSA NetWitness by running the following command:
nc -l -p [port] -s [IP]Here
[IP]and[port]are the IP address and port to which RSA NetWitness sends events for Feed Service. - You can use the tcpdump utility to listen on the port where events from RSA NetWitness must arrive.
The tcpdump utility listens on port
[port]if you run the utility by using the following command:tcpdump -neX port [port]Note that the tcpdump utility may use a different flag (not
-neX) depending on the operating system it runs on.
If no event arrives from RSA NetWitness, check the following:
- Check whether all steps listed in section "Forwarding events from RSA NetWitness" are performed correctly.
- Check whether the events arrive at RSA NetWitness from the source device.
You can check it in the same way as you check whether RSA NetWitness sends events to Feed Service.
- Check that the computer on which Feed Service is installed is accessible from the computer on which RSA NetWitness is installed.
You can check it by using the ping utility.
Checking whether Feed Service matches events against Kaspersky Threat Data Feeds
Use the Feed Service log files to check whether the URL fields, hash fields, and IP address fields of events are matched against Kaspersky Threat Data Feeds. The log files must contain messages like those provided in the following example.
|
If there are no such messages in the log files, check whether the Feed Service configuration file contains the correct regular expressions. You can also check the used regular expressions by using Kaspersky CyberTrace Web.
Checking whether Feed Service sends events to RSA NetWitness
You can check whether Feed Service sends events to RSA NetWitness in the following ways:
- By consulting Feed Service log files.
Following is an example of messages written to the log when an event is successfully sent to RSA NetWitness.
|
Following is an example of a message written to the log when an event could not be sent to RSA NetWitness.
2020/05/20 17:09:12.987 DBG 26341 siem Failed to send notification KL_ALERT_FailedToUpdateFeed (error: 0x80000072 (Unknown exception)) |
- By using the tcpdump utility on the computer that receives events from Feed Service.
The tcpdump utility listens on the IP address
[IP]and port514if you run the utility by using the following command:tcpdump -neX src [IP] and port 514In this command specify the IP address at which Feed Service sends events.
Note that the tcpdump utility may use a different flag (not
-neX) depending on the operating system it runs on.
If Feed Service sends no event, check the following:
- Check that the Feed Service log files contain messages about detecting URLs, hashes, or IP addresses.
If there are no such messages, see the information in subsection "Checking whether Feed Service matches events against Kaspersky Threat Data Feeds". It may also be that the feeds do not contain checked URLs, hashes, and IP addresses.
- Check that the Feed Service configuration file contains the correct destination IP address and port.
Problem: RSA NetWitness does not display events from Feed Service
If RSA NetWitness displays no events from Feed Service, check whether the procedure in section "Step 2. Sending events from Feed Service to RSA NetWitness" is performed correctly.
Note that RSA NetWitness may display events from a device with a delay of 10 minutes.
Problem: The configurator displays an error message when the IP address and port of Log Decoder are specified in the OutputSettings > ConnectionString setting.
An error message like the following can be displayed:
Can't connect using the specified string. Press [Enter] to specify another string, or type "ok" to continue with 10.10.0.127:514
Check that the computer on which RSA NetWitness is installed is accessible from the computer on which Feed Service is installed (for example, by using the ping utility).
Problem: Some fields of events from Feed Service are not displayed in the metafields in RSA NetWitness
If some fields of events from Feed Service are not displayed in the metafields in RSA NetWitness, do the following:
- Check whether the metafields mentioned in the v20_cybertracemsg.xml configuration file have their
flagsparameter set toNonein the/etc/netwitness/ng/envision/etc/table-map-custom.xmlconfiguration file.If these fields are absent from table-map-custom.xml, add them as follows:
<mapping envisionName="url" nwName="url" flags="None" format="Text" envisionDisplayName="URL"/> - Check whether all the fields described in section "Forwarding events from Feed Service to RSA NetWitness" are contained in the following configuration files:
- index-logdecoder-custom.xml (if you do not use Concentrator)
- index-concentrator-custom.xml
You can browse the contents of these files by selecting Administration > Services. Then select Concentrator (or Log Decoder), click the Settings split button (
), and select View > Config > Files. A drop-down list is displayed that contains all these files.After you have edited the files, restart Log Decoder or Concentrator so that the new settings will be in place.
Update only the configuration file of Concentrator (index-concentrator-custom.xml) if both Log Decoder and Concentrator are used, Concentrator receives data from Log Decoder, and Log Decoder receives events from Feed Service. Also, you can leave the configuration file of Log Decoder (index-logdecoder-custom.xml) unchanged if you do not use Log Decoder as the source of data in which you search for events or if you do not use Log Decoder to create reports or dashboards.
If the configuration files do not contain necessary fields, add these fields as described at https://community.rsa.com/docs/DOC-41760. For example, the index-concentrator-custom.xml file must contain the following lines:
<key description="virusName" format="Text" level="IndexValues" name="virusname" defaultAction="Open" />
<key description="user.src" format="Text" level="IndexValues" name="user.src" defaultAction="Open" />
<key description="ip.src" format="IPv4" level="IndexValues" name="ip.src" defaultAction="Open"/>
<key description="action" format="Text" level="IndexValues" name="action" defaultAction="Open" />
<key description="msg" format="Text" level="IndexKeys" name="msg" defaultAction="Open" />
<key description="event.source" format="Text" level="IndexValues" name="event.source" defaultAction="Open" />
<key description="device.ip" format="IPv4" level="IndexValues" name="ip.dst" defaultAction="Open"/>
<key description="ip.dst" format="IPv4" level="IndexValues" name="ip.dst" defaultAction="Open"/>
<key description="url" format="Text" level="IndexValues" name="url" defaultAction="Open"/>
<key description="checksum" format="Text" level="IndexValues" name="checksum" defaultAction="Open"/>
Make sure that the values of the name and format fields in the configuration files are equal to the values of the nwName and format fields, respectively, in the table-map-custom.xml file.
Problem: After the Kaspersky CyberTrace dashboard is imported, no data is displayed
A dashlet displays an error message instead.

Dashlet displays no data
To fix this error, reconfigure the dashlet as follows:
- In the top right area of the dashlet, click the Settings button.

The Settings button
The Options window opens.
- Click Browse.
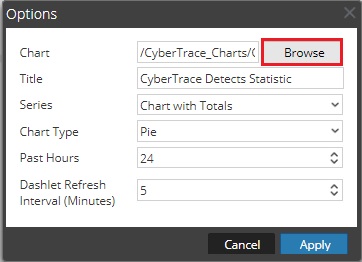
Dashlet parameters
The Select Chart window opens.
- Select the chart to be used in the dashlet.
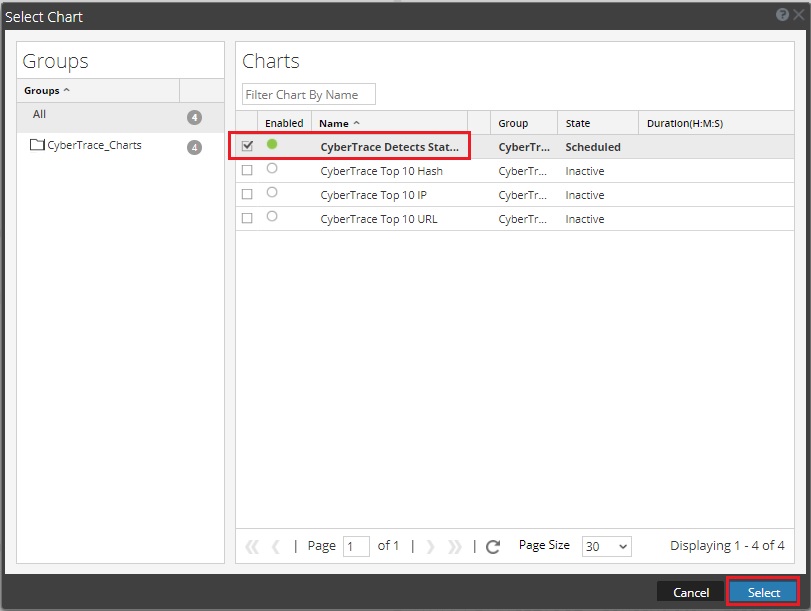
Selecting a chart
- Click Apply.
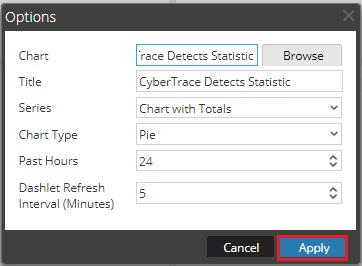
The Apply button
Problem: Feed Utility displays the "peer certificate cannot be authenticated with given CA certificates" error message
The certificate cannot be authenticated. Make sure that root certificates are installed on your system. If root certificates are not installed, install them using a standard procedure for installing root certificates on your operating system.
Page topRisk mitigation
We recommend that you take the following measures to mitigate security risks when using Kaspersky CyberTrace:
- Restrict access to the computer on which Kaspersky CyberTrace is installed.
This will make it more difficult to carry out denial-of-service (DoS) attacks on this computer. For example, you can allow this computer to communicate only with the administrator's computer, the computer that sends events for checking by Feed Service, and the computer that receives check results.
- Use network security solutions.
If your network is infected, attackers can reconfigure Feed Service so that it will send check results to some other computer.
- If the computer designated to receive check results has received no events during the last 24 hours, check whether the Feed Service settings have been changed maliciously.
How to get technical support
If you cannot find a solution to your issue in the product documentation, contact Technical Support. A Technical Support specialist will answer all of your questions about installing and using Kaspersky CyberTrace.
Kaspersky provides support for Kaspersky CyberTrace during its lifecycle (see the product support lifecycle page). Before contacting Technical Support, please read the support rules.
To contact Technical Support, use the contact details provided to you at the time of transaction.
Page topCopyright
Dear User,
Thank you for choosing Kaspersky as your security software provider. We hope that this document helps you to use our product.
Attention! This document is the property of AO Kaspersky Lab (herein also referred to as Kaspersky): all rights to this document are reserved by the copyright laws of the Russian Federation and by international treaties. Illegal reproduction and distribution of this document or parts hereof incur civil, administrative, or criminal liability under applicable law.
Any type of reproduction or distribution of any materials, including translations, is allowed only with the written permission of Kaspersky.
This document, and graphic images related to it, may be used for informational, non-commercial, and personal purposes only.
Kaspersky reserves the right to amend this document without additional notification.
Kaspersky assumes no liability for the content, quality, relevance, or accuracy of any materials used in this document to which rights are held by third parties, or for any potential harms associated with use of the document.
Document revision date: 4/14/2021
© 2021 AO Kaspersky Lab
https://www.kaspersky.com
https://support.kaspersky.com
Information about third-party code
Information about third-party code is contained in a file named legal_notices.txt and stored in the doc subdirectory of the application installation directory.
Trademark notices
Registered trademarks and service marks are the property of their respective owners.
Active Directory is a registered trademark of Microsoft Corporation in the United States and other countries.
Android, Chrome, Google, and Google Chrome are trademarks of Google, Inc.
Apache and the Apache feather logo are trademarks of The Apache Software Foundation.
Apple, iPhone, and Safari are trademarks of Apple Inc., registered in the U.S. and other countries.
Blue Coat, Symantec are trademarks or registered trademarks of Symantec Corporation or its affiliates in the U.S. and other countries.
Check Point is a trademark or registered trademark of Check Point Software Technologies Ltd. or its affiliates.
Cisco, Cisco IronPort, Snort, Sourcefire are registered trademarks or trademarks of Cisco Systems, Inc. and/or its affiliates in the United States and certain other countries.
Debian is a registered trademark of Software in the Public Interest, Inc.
Elasticsearch, Logstash, and Kibana are trademarks of Elasticsearch BV, registered in the U.S. and in other countries.
F5 and F5 Networks are trademarks of F5 Networks, Inc. in the U.S. and in certain other countries.
FireEye is a registered trademark of FireEye, Inc.
Firefox and Mozilla are trademarks of the Mozilla Foundation.
Fortinet, FortiGate are either registered trademarks or trademarks of Fortinet Corporation in the United States and/or other countries.
Express, IBM, ibm.com, QRadar are trademarks of International Business Machines Corporation, registered in many jurisdictions worldwide.
Imperva is a trademark of Imperva, Inc. and its subsidiaries.
Internet Explorer, Microsoft, Microsoft Edge, Win32, Windows, Windows Server are registered trademarks of Microsoft Corporation in the United States and other countries.
Java is a registered trademark of Oracle and/or its affiliates.
Juniper, Juniper Networks is a trademark or a registered trademark of Juniper Networks, Inc. in the United States and other countries.
Linux is the registered trademark of Linus Torvalds in the U.S. and other countries.
McAfee is a trademark or registered trademark of McAfee, Inc. in the United States and other countries.
Python is a trademark or registered trademark of the Python Software Foundation.
RSA and RSA NetWitness are either registered trademarks or trademarks of EMC Corporation in the United States and/or other countries.
Splunk is a trademark and registered trademark of Splunk Inc. in the United States and other countries.
Tor is a trademark of The Tor Project, U.S. Registration No. 3,465,432.
Trend Micro is a trademark of Trend Micro.
UNIX is a registered trademark in the United States and other countries, licensed exclusively through X/Open Company Limited.
Websense is a trademark or registered trademark of Forcepoint in the U.S. and other countries.
Page top